
What Does FY Mean? – Explained (Full Guide)

What Does FY Mean? - Fiscal Year - financial year

FY stands for Fiscal Year or Financial Year – a 12-month accounting period that businesses, governments, and organizations use for financial reporting, budgeting, and tax purposes.

It does not have to follow the calendar year (January to December). In fact, many countries and companies run their fiscal year on a completely different schedule.

Fiscal Year and Financial Year mean the same thing. They’re interchangeable terms for the same 12-month accounting period.

“Fiscal year” is more commonly used in the United States and Canada, while “financial year” is the preferred term in India, the UK, and Australia.


Why a Fiscal Year matters?

A fiscal year is the period over which an organization tracks its revenues, expenses, profits, and losses for official reporting purposes. At the end of each fiscal year, companies publish financial statements, file taxes, and report earnings to shareholders or governing bodies.

Think of it as the financial “chapter” of a business or government’s story — one complete cycle of income and spending, summarized and closed out every 12 months.

Why Don’t All Organizations Use the Calendar Year?

There are a few practical reasons:

  • Seasonal businesses prefer a fiscal year that ends after their slow season, so their books look cleaner
  • Government budgets are often set at different times of year, so their fiscal cycles align with legislative schedules
  • Industry norms – many sectors (retail, agriculture, education) have natural rhythms that don’t align with January–December

When Does a Fiscal Year Start and End?

This varies by country and organization. Here are the most common fiscal year schedules around the world:

Country / RegionFiscal Year StartFiscal Year End
United States (Federal)October 1September 30
United States (most corporations)January 1December 31
IndiaApril 1March 31
United KingdomApril 6April 5
AustraliaJuly 1June 30
CanadaApril 1March 31
JapanApril 1March 31

India’s financial year runs April 1 to March 31.


How Is a Fiscal Year Different From a Calendar Year?

Calendar YearFiscal Year
Always Jan 1 – Dec 31?YesNo
Used for?General timekeepingFinancial reporting & tax
Same for everyone?YesVaries by org / country
Can span two calendar years?NoYes (e.g., Oct 2025–Sep 2026)

How Companies Choose Their Fiscal Year?

Corporations typically choose a fiscal year that makes operational sense for their business. Some common choices:

  • Retailers often end their fiscal year in January or February – after the holiday shopping season – so Q4 captures peak revenue
  • Tech companies vary widely; many use calendar year but some (like Microsoft) use a July–June fiscal year
  • Agricultural businesses may align with harvest cycles
  • Schools and universities often run July–June to match the academic year

In the US, the IRS allows any 12-month period as a fiscal year, provided it’s consistent from year to year.


FY in Business: Common Uses

You’ll see “FY” used constantly in business contexts:

  • FY Revenue: Total income earned in a fiscal year
  • FY Budget: Money allocated for the fiscal year
  • FY Targets / FY Goals: Annual performance objectives
  • Q1 FY26, Q2 FY26…: Quarters within a fiscal year (each fiscal year has 4 quarters)
  • End of FY / EOFY: The final days of a fiscal year, often a busy period for accounting teams

Quick Reference: FY Terms Glossary

TermMeaning
FYFiscal Year
FY25Fiscal Year 2025
FY26Fiscal Year 2026
Q1–Q4Four quarters within a fiscal year
EOFYEnd of Fiscal Year
Financial YearSame as Fiscal Year (more common outside the US)
YTDYear to Date (from the start of the fiscal year to now)
Prior Year / PYThe previous fiscal year

Key Takeaways

  • FY = Fiscal Year — a 12-month financial reporting period
  • A fiscal year does not have to match the calendar year
  • The start and end dates of a fiscal year vary by country and organization
  • India’s financial year runs April 1 to March 31
  • The US Federal fiscal year runs October 1 to September 30

Understanding fiscal years is essential for reading financial reports, interpreting earnings announcements, planning budgets, and filing taxes correctly – no matter which country or industry you’re working in.

This article is for informational purposes only and should not be considered financial advice. Investing in stocks, cryptocurrencies, or other assets involves risks, including the potential loss of principal. Always conduct your own research or consult a qualified financial advisor before making investment decisions. The author and publisher are not responsible for any financial losses incurred from actions based on this article. While efforts have been made to ensure accuracy, economic data and market conditions can change rapidly. The author and publisher do not guarantee the completeness or accuracy of the information and are not liable for any errors or omissions. Always verify data with primary sources before making decisions.

What do the green and red numbers mean in stocks? – Simple Explanation for Beginners

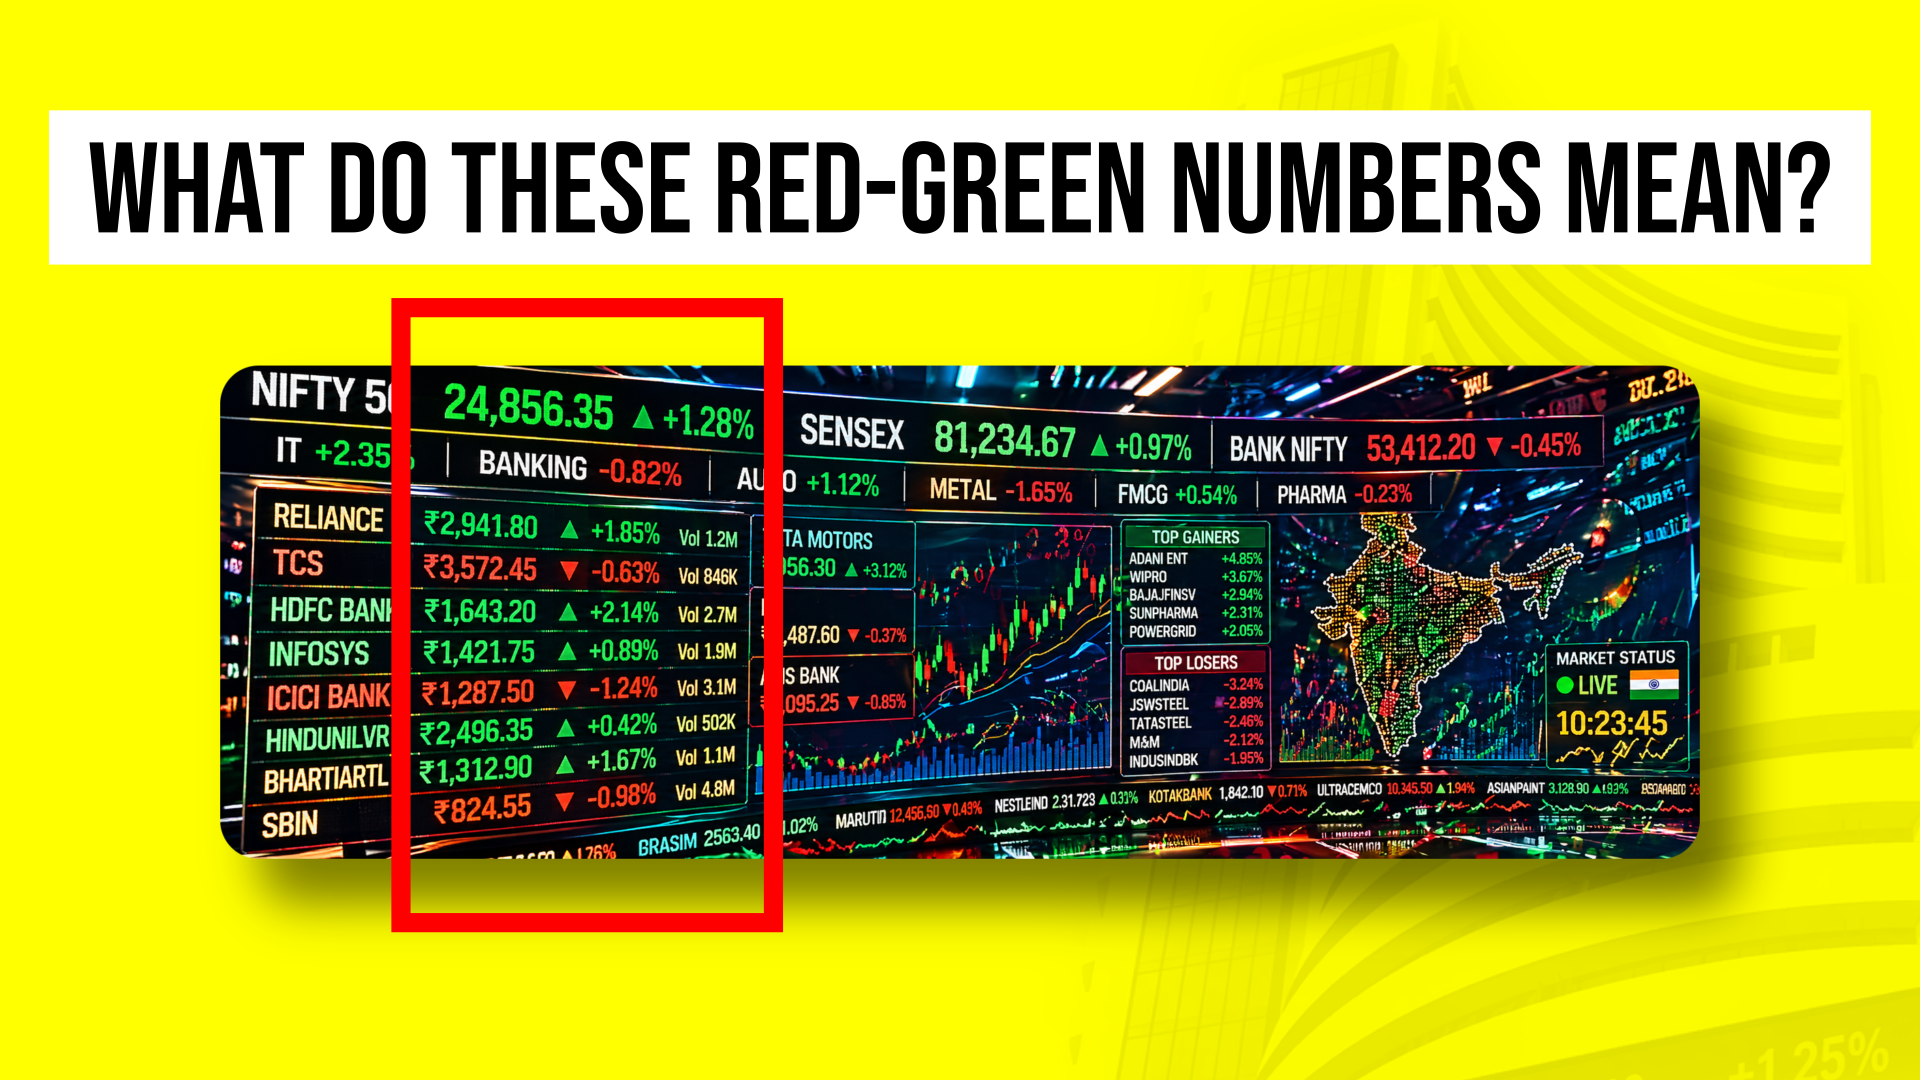
What do the green and red numbers represent in stock trading?

The first time most people open a stock market app, it doesn’t feel like money at all.

It feels like noise.

Red numbers, green numbers, percentages, values constantly moving… everything changing every second. It almost looks like a control panel instead of something related to investing.

And naturally, the first thought that comes to mind is simple:

What do these numbers actually mean?

The truth is, these numbers are not complicated. They just look complicated because no one explains them in a simple, relatable way.

Once you understand the basic idea behind them, everything starts to feel much clearer.


Understanding the Most Important Concept: Closing Price

Before understanding all the numbers, you need to understand one single concept:

Closing price.

When someone says a stock “closed at ₹100”, it simply means this:

Throughout the day, people are buying and selling that stock. Because of this, the price keeps changing continuously. It might go from ₹98 to ₹101, then to ₹99, then to ₹100, and so on.

At the end of the day, just before the market closes, the last transaction that happens between a buyer and a seller determines the final price.

That final price is called the closing price.

So if a stock “closed at ₹100”, it means the last deal of the day happened at ₹100.

This closing price becomes the most important reference point for the next day.

Also Read – Does the share price go up because company profits are added to it?


What do the green and red numbers mean in the stock market?

Now imagine this.

Yesterday, the stock closed at ₹100.

Today, you open your app and see ₹103.

What does that mean?

It simply means the price is ₹3 higher than where it ended yesterday.

That’s it.

The entire system of stock market numbers revolves around comparing the current price with the previous closing price.


Breaking Down Stock Market Numbers

When you look at a stock, you will usually see something like this:

₹103 +3 (+3%)

This may look confusing at first, but it’s actually very simple when broken down.

The first number, ₹103, is the current price. This tells you where the stock is right now.

The second number, +3, is the absolute change. This shows how much the price has moved compared to yesterday’s closing price.

The third number, +3%, is the percentage change. This shows how big that movement is in percentage terms.

All three numbers are just different ways of telling the same story.


Understanding Positive and Negative Changes

Now let’s look at both scenarios clearly.

If yesterday the stock closed at ₹100 and today it is at ₹103, then:

₹103 +3 (+3%)

This means the price has increased by ₹3.

This is usually shown in green.

On the other hand, if yesterday it closed at ₹100 and today it is at ₹97, then:

₹97 -3 (-3%)

This means the price has decreased by ₹3.

This is usually shown in red.

So the logic is simple.

Positive change means the price has gone up.
Negative change means the price has gone down.

Watch this video for a better understanding!


Why Are Some Numbers Green and Some Red?

The colors in the stock market are there to make things easier to understand visually.

If the current price is higher than the previous closing price, it is shown in green. This indicates that the stock is up.

If the current price is lower than the previous closing price, it is shown in red. This indicates that the stock is down.

There is nothing more complicated behind it. It is simply a visual indicator of whether the price is higher or lower compared to the last closing price.


What Do Percentage Changes Really Mean?

A common beginner confusion is this:

If the absolute change is already shown, why do we need percentage?

The answer is simple.

Absolute change alone does not tell you how significant the movement is.

For example, if a stock moves from ₹100 to ₹103, that is a 3% move.

But if a stock moves from ₹1000 to ₹1003, that is only a 0.3% move.

Even though the change is ₹3 in both cases, the impact is very different.

Percentage helps you understand the intensity of the movement, not just the number.


What is Meant by “Points” in the Stock Market in India?

When people talk about the stock market moving in “points”, they are usually referring to an index like Nifty or Sensex.

If someone says the market went up by 100 points, it simply means the index value increased by 100 units.

This is very similar to how individual stock prices move, but instead of a single company, an index represents a group of companies.

So “points” is just another way of expressing numerical movement, especially for indices.


What Does It Mean When the Market Drops 1,000 Points?

You might often hear statements like:

“The market dropped 1,000 points today.”

This does not mean that every stock lost value equally.

It means that a major index, like Sensex or Nifty, has fallen by 1,000 points compared to its previous closing value.

This usually indicates a broad decline in the market, but the actual impact can vary across different stocks.

Some stocks may fall more, some less, and a few might even rise.

Also Read – Does money go to the company when you buy shares from the stock exchange?


Bringing It All Together

At first, stock market numbers look confusing because they are presented all at once.

But in reality, they are just telling one simple story in three ways.

The current price tells you where the stock is right now.

The absolute change tells you how much it has moved compared to the last closing price.

The percentage change tells you how big that movement is.

And all of this is always being compared to one reference point:

Where the price last ended.


Final Thought

Once you understand this, the stock market stops feeling like a complicated system full of random numbers.

It starts feeling like a simple comparison.

Every number you see is just answering one question:

Where is the price now, compared to where it was before?

And once this clicks, the entire screen that once felt confusing starts making sense.

What are Q1, Q2, Q3, and Q4 in the stock market?

In the stock market, Q1, Q2, Q3, and Q4 simply refer to the four quarters of a financial year (fiscal year). Instead of reporting performance for the entire year at once, companies break it into these four parts to show progress step by step. Q1 represents the first three months of the financial year, Q2 covers the next three months, Q3 includes the following three months, and Q4 represents the final three months of the year.

What does it mean when the Dow drops 1,000 points?

It means the Dow Jones Industrial Average is 1,000 points lower than its previous closing level. In simple terms, the combined value of 30 major U.S. stocks has declined compared to the last trading day’s close. This reflects overall market weakness and selling pressure.

What is Meant by “Points” in the Stock Market in India?

When people talk about the stock market moving in ‘points,’ they usually mean the index has moved up or down by a certain number of units. For example, if the market goes up by 100 points, it means the index value has increased by 100

How to do Paper Trading in Upstox? – A Complete Guide for Beginners (2026)

With platforms like Upstox and Sensibull, it becomes easy to practice trading in segments such as Nifty and Bank Nifty options, stock futures and options, currency derivatives like USDINR, and commodities including gold, silver, and crude oil.

Paper trading is one of the best ways to learn trading without risking real money. It allows traders to test strategies in real market conditions and understand how trades behave before using actual capital.

With platforms like Upstox, it is possible to forward test strategies across multiple segments including Nifty, Bank Nifty, and stock futures and options.

How to do Paper Trading in Upstox? – Step-by-Step Tutorial


Can You Do Paper Trading on Upstox on your Computer?

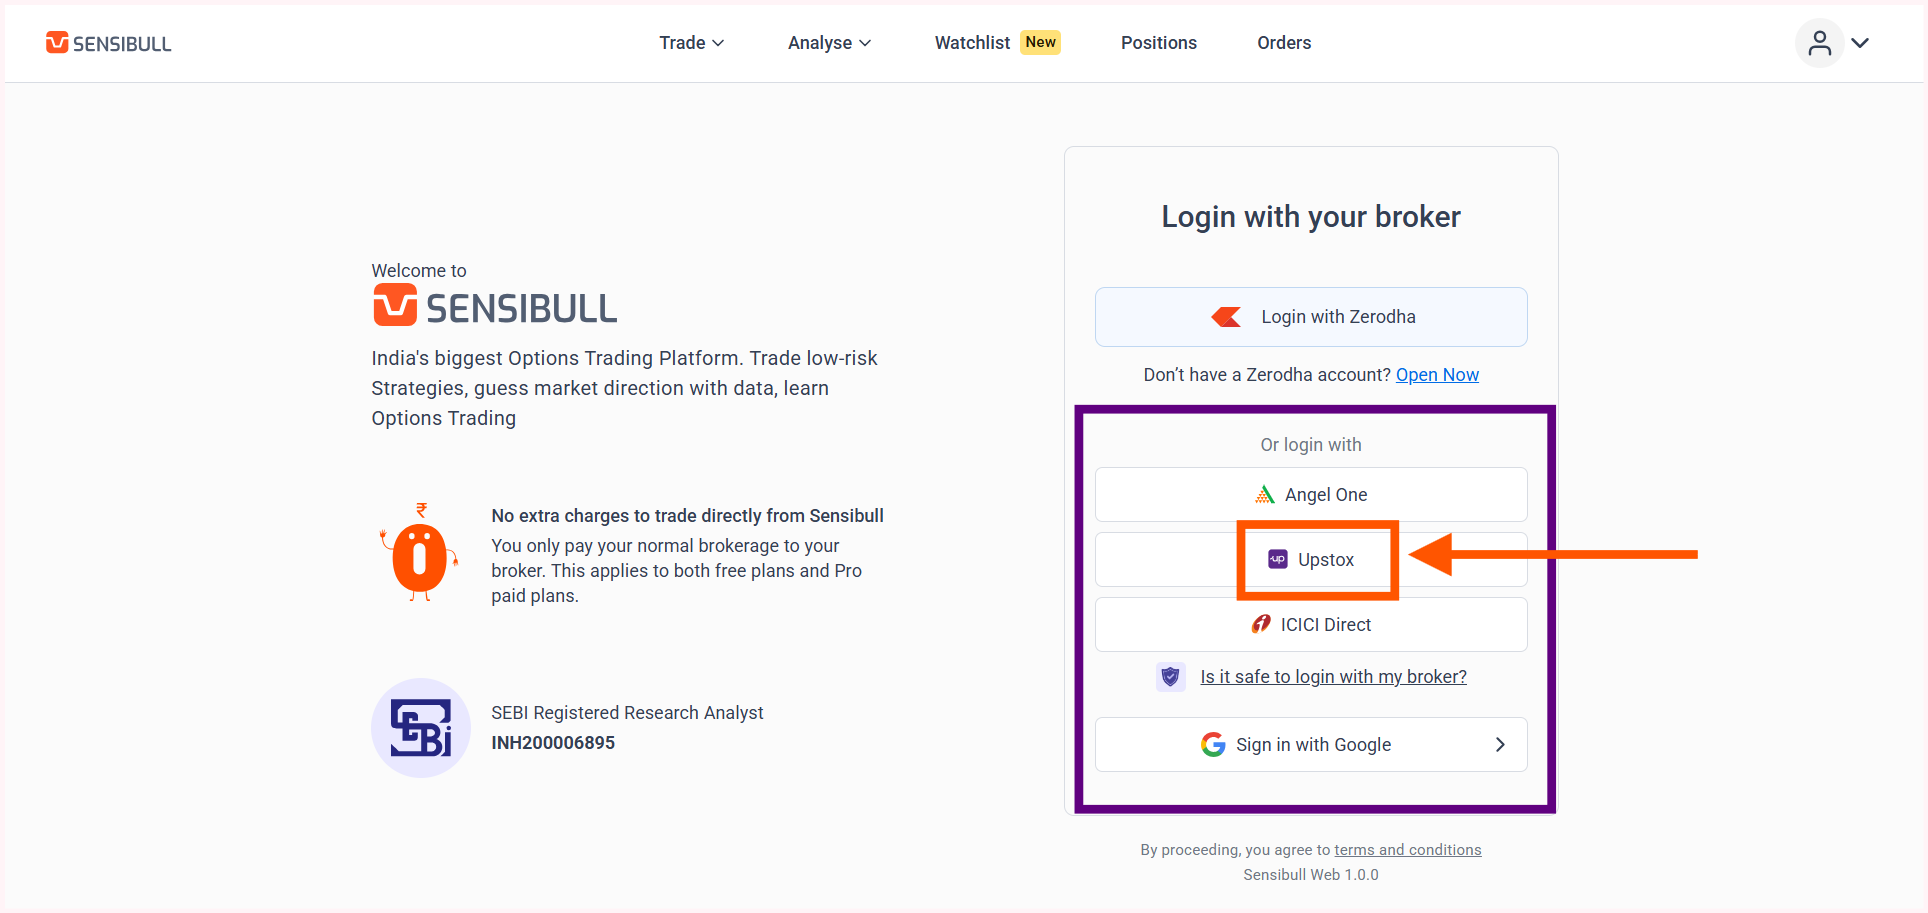
Open the Sensibull website and proceed to login using Upstox credentials.
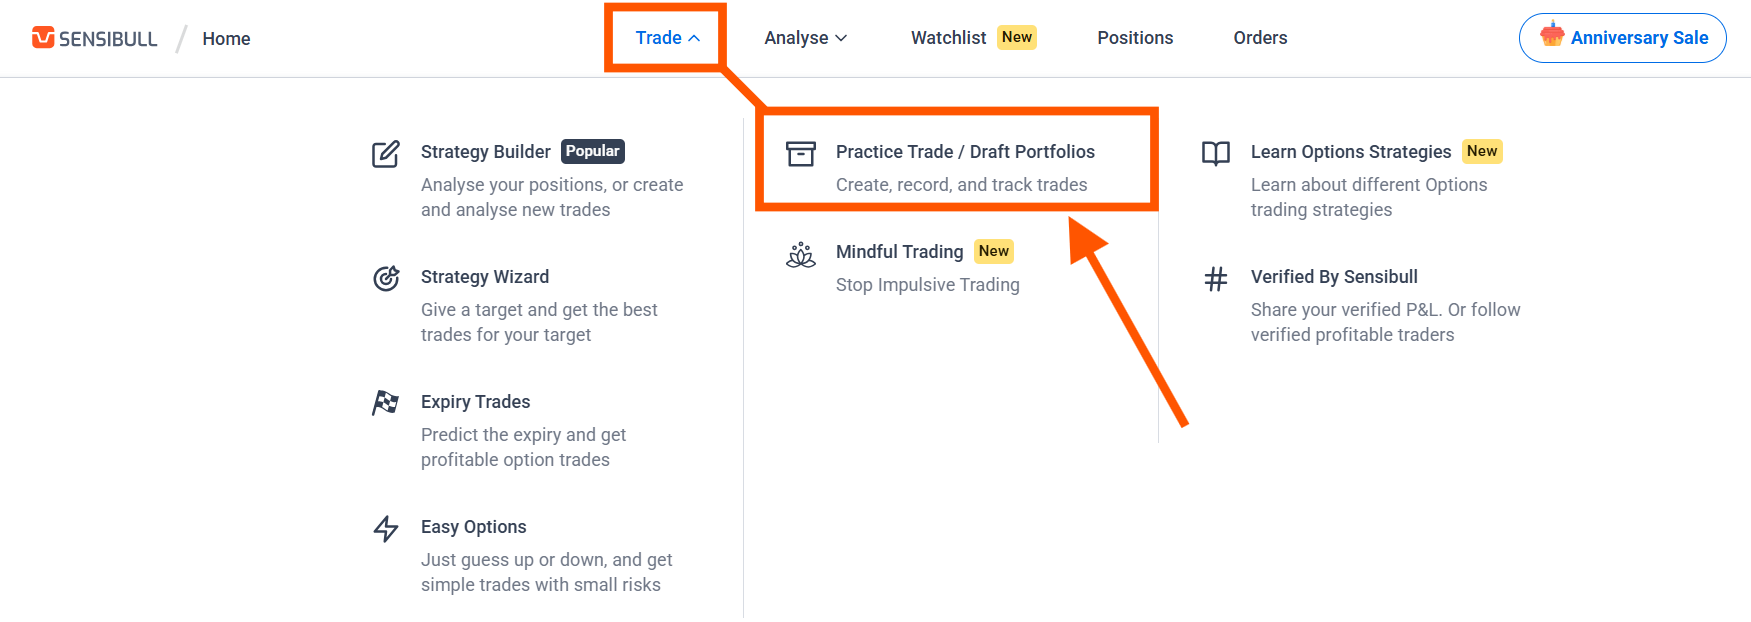
  • After logging in, go to the Trade section in the upper menu.
  • Locate the Practice Trade/Draft Portfolios option and open it.
  • Once opened, it will say that you can’t do paper trading because you have a free plan.

In conclusion, no.

Unlike Zerodha, Upstox offers only a free plan that won’t let you do paper trading on a PC.


How to Do Paper Trading on Upstox on your Mobile?

However, Upstox allows you to do paper trading on the Sensibull mobile app – even with a free plan – as long as you log in using your Upstox account.

  • Go to the Play Store or App Store and download the Upstox application.
  • Open the app and create a demat account if it is not already created.
  • After the account becomes active, go back to the Play Store or App Store.
  • Search for Sensibull and download the application.
  • Open the Sensibull app and login using Upstox credentials.
  • After logging in, you will be in the ‘Home’ section.
  • Click on Practice Trade/Draft Portfolios option and start practicing.

Paper trading does not require any real money. The platform provides virtual capital for practice, and all trades are simulated but based on real market data. This helps in understanding market behavior without financial risk.

After setting up, trading can be practiced in segments like Nifty, Bank Nifty, stock options, and futures. Traders can execute trades, such as buying calls and puts or selling options.

It is also possible to test different strategies like straddles and iron condors, observe how option premiums move, and improve risk management and position sizing skills.


Important Considerations

Paper trading does not involve real emotions like fear or greed, so real trading can feel very different. The focus should be on consistency and learning rather than just profits.

It is also important to practice risk management right from the start.


Does Upstox allow paper trading?

No, Upstox does not support paper trading directly. However, you can do paper trading indirectly via Sensibull on your mobile if you have an active Demat account with Upstox.

How do I switch to paper trading with Upstox?

To practice paper trading with Upstox in the Indian financial markets, you must have a Demat account with them. Once your account is active, log in to Sensibull using your Upstox credentials on your mobile; from there, you can practice under the ‘Virtual Trading’ option.

Powering “Quantum Space” – How EV Batteries are Solving the Moon’s Biggest Problem?

We are currently witnessing the birth of Quantum Space. It’s a world defined by thousands of new satellites weaving a “quantum-safe” web around Earth and the first permanent human outposts on the Moon. But as the Artemis II crew recently reminded us, space is not just a destination; it’s a logistical nightmare.

We can build the rockets, but one question remains the ultimate “bottleneck” for human expansion: How do we keep the lights on?

In space, traditional energy fails. You can’t burn fossil fuels in a vacuum, and solar power – while iconic – is far more fragile than most people realize. The answer to the energy crisis of the Moon isn’t coming from rocket science; it’s coming from the electric car parked in your driveway.


The “Lunar Night” Problem

On Earth, we take power for granted. In space, power is life.

Currently, satellites and moon bases rely on massive solar arrays. But these are plagued by three “silent killers”:

  1. Radiation: Constant bombardment from solar flares degrades panels over time.
  2. The Dust Factor: On the Moon, abrasive, “electrostatic” regolith (dust) coats everything, choking solar efficiency.
  3. The Temperature Swing: In the lunar day, it hits 120°C. At night? A bone-chilling -170°C.

If your batteries fail during the 14-day lunar night, the mission ends. Period.

Why Current Batteries Aren’t Cutting It

For decades, we’ve used Lithium-ion batteries – the same ones in your phone. But these use a liquid electrolyte. In the vacuum of space, liquid is a liability. It can freeze, boil, or leak. Even worse, radiation can break down these liquids, creating a fire risk in a place where there is no “out” for the smoke.

The Solid-State Revolution: From EVs to Orbit

This is where the “Quantum” in Quantum Space becomes literal. Companies like QuantumScape and research teams at NASA (via the SABERS project) are pivoting to Solid-State Batteries (SSBs).

By replacing the liquid “insides” of a battery with a solid ceramic or polymer material, we unlock five game-changing advantages for space exploration:

1. Thermal Immunity

Unlike car batteries that lose 50% of their range in a winter storm, solid-state batteries are “thermal tanks.” Recent tests show they can operate from -60°C to +120°C without breaking a sweat. The solid material doesn’t freeze or boil, making it the only viable choice for the lunar surface.

2. Radiation Shielding by Design

Radiation destroys liquids through a process called radiolysis. Solids are inherently more stable. Recent gamma-ray testing suggests that SSBs can survive the harsh environment of “Cis-lunar” space for 15+ years – nearly double the lifespan of current satellite power packs.

3. “Weight is Wealth”

In rocketry, every kilogram costs thousands of dollars. Solid-state batteries are significantly lighter and hold more energy (higher energy density) than liquid ones. This allows us to launch smaller rockets or, more importantly, pack more food, water, and scientific tools instead of heavy battery casings.

4. Zero Fire Risk

In a vacuum, a battery fire is a death sentence. Because SSBs don’t have flammable liquids, they are virtually “fire-proof.” This safety profile is why they are the top choice for the crewed modules of future Moon bases.


Real-World Proof: It’s Already Happening

This isn’t science fiction.

  • The Japanese Milestone: A team from Japan recently conducted the first successful space test of an all-solid-state battery on the ISS, proving they work perfectly in zero-gravity and vacuum conditions.
  • The QuantumScape Pivot: Just this week, following their Q1 2026 earnings, QuantumScape signaled a massive shift toward defense and aerospace. They realize that the same tech making your car go 500 miles on a single charge is what will keep a lunar greenhouse running.

The Future: A Two-World Energy Grid

The beauty of this trend is the Inverted Innovation Loop. Usually, NASA invents something and we get it 20 years later (like Velcro or GPS). This time, the massive R&D of the global car industry is subsidizing the colonization of space.

The “B-LO Zero” projects and lunar-night battery packs of tomorrow are being built in the EV factories of today.

Final Thought

Building “Quantum Space” is about more than just the “cool factor” of rockets. It’s about building a smart, resilient energy grid that can survive the most hostile environment known to man.

The next time you see an electric car, look at the floorboard. The technology inside isn’t just helping us save our planet – it’s giving us the power to leave it.

This article is for informational purposes only and should not be considered financial advice. Investing in stocks, cryptocurrencies, or other assets involves risks, including the potential loss of principal. Always conduct your own research or consult a qualified financial advisor before making investment decisions. The author and publisher are not responsible for any financial losses incurred from actions based on this article. While efforts have been made to ensure accuracy, economic data and market conditions can change rapidly. The author and publisher do not guarantee the completeness or accuracy of the information and are not liable for any errors or omissions. Always verify data with primary sources before making decisions.

Coinbase CFO Alesia Haas Files Notice for $2 Million Stock Sale Ahead of Q1 Results

Coinbase Global, Inc. Chief Financial Officer Alesia Haas has filed a notice to sell 10,020 shares of the company’s common stock, according to a recent Form 144 filing with the Securities and Exchange Commission.

The proposed transaction, dated April 16, 2026, carries an estimated aggregate market value of $2,004,000. This planned sale comes as the digital asset industry prepares for a pivotal stretch of corporate reporting and structural shifts in the crypto-economy.

The securities involved in this filing were originally acquired by Haas through equity compensation directly from Coinbase, with shares earned in May and August of 2025. In corporate finance, equity compensation is a non-cash pay category where executives receive shares or stock options. This practice is intended to align the interests of leadership with those of shareholders, as the value of the compensation rises or falls based on the company’s market performance.

Also Read – Circle Internet Group (CRCL) – Insider Activity and Outlook Ahead of Q1 Earnings

This latest filing follows a period of significant selling activity for the CFO. Over the past three months, Haas has sold a total of 384,570 shares, generating gross proceeds of approximately $59.5 million. The largest of these transactions occurred on February 6, 2026, when 364,600 shares were sold for more than $55.4 million. The sale is being conducted through a Rule 10b5-1 trading plan adopted on September 3, 2025. This specialized financial tool allows company insiders to set up a predetermined schedule for selling stocks at a time when they do not possess private, market-moving information, providing a transparent way to manage personal liquidity.

Anticipation Builds for Q1 Earnings and Crypto Market Milestones

The timing of the disclosure coincides with heightened investor interest as Coinbase prepares to report its first-quarter financial results. The company is scheduled to release its Q1 2026 earnings on April 30, 2026, following the close of market trading. These results are expected to provide a health check on the broader cryptocurrency sector, particularly regarding trading volumes and the growth of institutional services.

Beyond the earnings calendar, the digital asset landscape is navigating significant technical and regulatory updates. Market participants are closely monitoring the impact of the recent Bitcoin Halving—a recurring event that reduces the rate at which new units of the cryptocurrency are created. This process is designed to manage scarcity and has historically influenced market volatility and trading activity across exchange platforms. Additionally, the industry is tracking the expansion of spot crypto Exchange-Traded Funds (ETFs), which have increasingly integrated traditional finance with digital assets, directly impacting the custodial and transaction revenue models for firms like Coinbase.

Market Context and Regulatory Standards

The proposed sale represents a small fraction of the total 223,041,278 shares outstanding for the exchange operator. While the filing indicates an intent to sell, such notices are standard regulatory requirements under Rule 144. This rule governs the sale of “restricted” or “control” securities held by insiders, ensuring that such trades do not cause undue instability in the public marketplace.

By filing the Form 144, the executive represents that they are unaware of any material adverse information regarding the company’s operations that has not been disclosed to the public. The transaction is slated to be handled through Merrill Lynch on the Nasdaq exchange, maintaining the transparent reporting standards expected of major financial institutions.

Company Profile

Coinbase Global, Inc. operates within the financial technology sector, specifically classified under the software and services industry as a leading provider of financial infrastructure and technology for the crypto-economy. The company went public via a direct listing in 2021 and maintains its corporate headquarters in New York City. Coinbase provides a comprehensive platform that allows consumers, institutions, and developers to trade, store, and interact with various digital assets and decentralized applications. The business generates the majority of its revenue through transaction fees earned from trades executed on its platform, as well as through subscription and services revenue, which includes interest income, staking rewards, and custodial fees.

This article is for informational purposes only and should not be considered financial advice. Investing in stocks, cryptocurrencies, or other assets involves risks, including the potential loss of principal. Always conduct your own research or consult a qualified financial advisor before making investment decisions. The author and publisher are not responsible for any financial losses incurred from actions based on this article. While efforts have been made to ensure accuracy, economic data and market conditions can change rapidly. The author and publisher do not guarantee the completeness or accuracy of the information and are not liable for any errors or omissions. Always verify data with primary sources before making decisions.

Circle Internet Group (CRCL) – Insider Activity and Outlook Ahead of Q1 Earnings

As Circle Internet Group, Inc. (NYSE: CRCL) prepares to pull back the curtain on its first-quarter performance for 2026, recent regulatory filings and market data suggest a company at a significant crossroads. With a pivotal earnings date set for May and notable insider selling by top leadership, investors are closely watching how the “infrastructure layer of the digital economy” will fare in an increasingly complex regulatory environment.

Insider Sales Under the Microscope

A Form 144 filing dated April 13, 2026, reveals that Heath Tarbert, President of Circle, proposed the sale of 15,000 Class A shares with an approximate market value of $1.43 million.

The sale was executed through Fidelity Brokerage Services under a pre-arranged Rule 10b5-1 trading plan adopted on August 14, 2025. This transaction follows a string of disposals by Tarbert over the last three months, totaling over 200,000 shares for proceeds exceeding $20 million. While insider selling can sometimes trigger alarm, these automated plans are often scheduled months in advance to diversify executive holdings regardless of current market sentiment.

Q1 2026 Earnings: What to Expect

Circle has officially scheduled its Q1 2026 financial results for Monday, May 11, 2026, at 8:00 a.m. ET. Analysts are looking for several key indicators:

  • USDC Adoption: Investors will gauge transaction volumes and market share for USDC to determine recurring platform revenue.
  • Arc Blockchain Milestones: Progress on the enterprise-focused Arc blockchain will be a primary focus for those looking for SaaS-style growth.
  • Earnings Growth: Consensus estimates project high growth, with annual earnings expected to rise by 69.4% as the company moves toward sustained profitability.

Stock Performance and Market Sentiment

CRCL’s performance in 2026 has been a tale of recovery. After a volatile start to the year that saw shares dip toward the $50 mark in early February, the stock has rallied significantly.

MetricValue (As of April 17, 2026)
Last Price$105.91
52-Week High$298.99
52-Week Low$49.90
Market Cap~$26.18 Billion

The stock is currently up roughly 14% year-to-date, trading well above its 50-day moving average of $90.08.

The Road Ahead

Circle’s transition from a “crypto proxy” to a critical piece of “financial infrastructure” appears to be gaining traction with institutional investors. However, the path to the $120+ level predicted by some models will likely depend on the regulatory clarity surrounding the Clarity Act and the company’s ability to maintain high margins amidst rising global operational costs.

Investors should keep a sharp eye on the May 11 call for updates on stablecoin yield legislation and new enterprise partnerships.

This article is for informational purposes only and should not be considered financial advice. Investing in stocks, cryptocurrencies, or other assets involves risks, including the potential loss of principal. Always conduct your own research or consult a qualified financial advisor before making investment decisions. The author and publisher are not responsible for any financial losses incurred from actions based on this article. While efforts have been made to ensure accuracy, economic data and market conditions can change rapidly. The author and publisher do not guarantee the completeness or accuracy of the information and are not liable for any errors or omissions. Always verify data with primary sources before making decisions.

Which Stocks, Industries, and Sectors May Get Affected by a U.S.–Iran Conflict?

Weekly Market Outlook - How a US–Iran–Israel Conflict Could Reshape Global Markets

Rising geopolitical tensions involving the United States, Iran, and Israel are beginning to influence global financial markets. Historically, even the risk of escalation in the Middle East has been enough to shift capital flows, increase volatility, and trigger sector rotation across equity markets.

This week, markets are likely to trade more on geopolitical headlines than on earnings or macroeconomic data.


Energy Sector: The Most Direct Impact

The energy sector is typically the first and most sensitive area impacted by Middle East tensions.

• Crude oil prices often rise due to supply disruption fears.
• Oil producers and integrated energy companies may benefit from higher realized prices.
• Oilfield services and drilling companies could see renewed investor interest.

However:

• Airlines, logistics firms, and chemical manufacturers may face margin pressure due to higher fuel and input costs.
• Sustained oil spikes can increase inflation expectations, influencing central bank policy outlooks.

Short-term winner: Upstream oil producers.
Short-term risk: Fuel-dependent industries.

Also Read – Top 13 Stocks That Could Be Impacted by a Strait of Hormuz Blockade


Defense & Aerospace: Structural Beneficiary

Heightened geopolitical risk tends to increase expectations for defense spending.

• Missile systems, aerospace manufacturing, and military technology providers often attract capital during periods of conflict.
• Long-term government contracts provide earnings visibility, which can make defense stocks relatively defensive during uncertainty.

Even if tensions ease, increased security budgets often remain in place, providing medium-term support.


Precious Metals & Safe-Haven Assets

Geopolitical uncertainty usually drives investors toward perceived safe havens.

• Gold and precious metal miners often gain as investors hedge risk.
• U.S. Treasuries may see increased demand.
• Defensive sectors such as utilities and consumer staples may outperform broader cyclical markets.


Transportation & Industrials: Potential Headwinds

• Airlines face rising jet fuel costs and potential airspace disruptions.
• Shipping companies could experience route uncertainty and higher insurance premiums.
• Export-heavy industrial firms may see demand concerns if global trade sentiment weakens.

Defense-linked industrial companies, however, may diverge positively from the broader industrial sector.


Financials: Volatility Sensitivity

Banks and financial institutions often underperform during periods of geopolitical uncertainty due to:

• Increased market volatility
• Tighter credit conditions
• Risk repricing in global markets

If higher oil prices revive inflation concerns, interest rate expectations could also shift, adding another layer of complexity for financial stocks.


Technology Sector: Mixed Reaction

Large-cap technology stocks can behave in two ways:

• Software and cloud companies may act as relative safe growth plays.
• Hardware and semiconductor companies could face volatility due to supply chain concerns and global risk sentiment.

The reaction largely depends on whether tensions escalate into broader regional disruption.

Also Read – I Created the Best Bitcoin Guide You’ll Ever Read


Broader Market Outlook

In most historical geopolitical episodes:

• Markets experience short-term volatility spikes.
• Sector rotation becomes more pronounced.
• Energy and defense lead performance.
• Cyclical and transport-linked stocks lag.

Unless escalation becomes prolonged or expands regionally, markets typically stabilize once risk clarity improves.


Investor Takeaway

A U.S.–Iran conflict scenario primarily reshuffles sector leadership rather than triggering systemic collapse.

Potential beneficiaries:
• Energy producers
• Defense contractors
• Precious metals

Potentially vulnerable sectors:
• Airlines and transportation
• Consumer discretionary
• Financials

For investors, this is a phase of selective positioning and risk management rather than broad liquidation. Monitoring oil prices, defense spending signals, and diplomatic developments will remain critical in assessing near-term market direction.

Also Read – Why Every Investor is a Trader?

This article is for informational purposes only and should not be considered financial advice. Investing in stocks, cryptocurrencies, or other assets involves risks, including the potential loss of principal. Always conduct your own research or consult a qualified financial advisor before making investment decisions. The author and publisher are not responsible for any financial losses incurred from actions based on this article. While efforts have been made to ensure accuracy, economic data and market conditions can change rapidly. The author and publisher do not guarantee the completeness or accuracy of the information and are not liable for any errors or omissions. Always verify data with primary sources before making decisions.

Why Every Investor is a Trader?

Investing Begins With a Trade

Trading is often portrayed as reckless speculation, while investing is positioned as thoughtful and virtuous. But this framing collapses under scrutiny. Every investment begins with a trade. When you buy shares with a long-term mindset, you are still executing a trade with someone selling. When you exit years later, you trade again – this time with a buyer. Mechanically, investing is simply low-frequency trading stretched across time.

So if both investing and trading rely on the same market actions, the distinction clearly lies somewhere else.

Also Read – I Created the Best Bitcoin Guide You’ll Ever Read

If It’s Not the Act of Trading, Then What Actually Separates Investing from Speculation?

The true difference is not whether trades occur, but why capital is deployed. Investing is driven by ownership – the belief that a business will grow, generate cash flows, and create real economic value over time.

Speculative trading, on the other hand, seeks profit primarily from price movements, often disconnected from long-term value creation.

Frequent buying and selling is not inherently wrong. But when activity shifts from owning risk to arbitraging expectations, the economic character of participation changes – and so do the moral and financial consequences.

Why Can a Well-Reasoned Investment Still Fail?

An investor may buy a stock believing earnings will rise over the next year or two. The reasoning may be sound. The business may even perform exactly as expected. Yet the stock price may stagnate or fall.

This apparent contradiction confuses many market participants – and it reveals something crucial about how markets actually work.

What Makes Financial Markets Fundamentally Different from Every Other Market?

Financial markets are not reactive; they are forward-looking. Prices do not wait for earnings announcements or business results. They continuously absorb expectations about the future. By the time growth, profitability, or industry tailwinds become visible, those narratives are often already reflected in prices.

The market is never asking whether a company will do well. It is asking whether the company will do better than what is already expected.

Who Is Pricing the Future Faster Than You Think?

Modern markets are dominated by participants with extraordinary informational and analytical advantages – institutional investors, analysts, quantitative funds, and algorithmic systems. These players process massive data sets and model future outcomes at speed.

Their collective activity compresses the time window in which new information can create mispricing, especially in the short to medium term. This is why being “right” about a company often isn’t enough.

Why Being Right About the Business Isn’t the Same as Being Right About the Stock?

Stock market returns do not come from predicting the future accurately. They come from recognizing when market expectations about the future are wrong, incomplete, or mispriced.

You can be correct about earnings growth and still lose money if that growth was already priced in. Markets reward expectation gaps, not correctness.

Is Investing Really About Trading Less – or About Understanding Expectations Better?

At its core, investing is not a debate between trading and not trading.

It is a debate between owning value creation and competing over price expectations.

Understanding this distinction is not optional. It is essential for navigating markets responsibly, intelligently, and with realistic expectations of risk and reward.

This article is for informational purposes only and should not be considered financial advice. Investing in stocks, cryptocurrencies, or other assets involves risks, including the potential loss of principal. Always conduct your own research or consult a qualified financial advisor before making investment decisions. The author and publisher are not responsible for any financial losses incurred from actions based on this article. While efforts have been made to ensure accuracy, economic data and market conditions can change rapidly. The author and publisher do not guarantee the completeness or accuracy of the information and are not liable for any errors or omissions. Always verify data with primary sources before making decisions.

5 Reasons MSFT Might Be at the Right Spot for a Potential Bounce

Microsoft’s sharp post-earnings fall illustrates that short-term price moves are often about sentiment, expectations, and liquidity rather than fundamental shifts in business quality. Structurally, the stock is now trading near zones that historically matter to technical participants and longer-term investors.

Microsoft has been one of the strongest blue-chip performers of the last decade. Yet even the strongest stocks go through phases where price corrects faster than sentiment can adjust.

Microsoft’s recent price action has left many investors confused. Strong earnings, record cloud revenue, and solid guidance would normally support higher prices. Instead, the stock corrected sharply, falling with greater magnitude immediately after the earnings release.

After a sharp decline from recent highs, investors are now asking a simple but important question: Is MSFT setting up for a move back up, or is this weakness just the beginning?

To answer that, it’s important to step away from emotions and look at how markets actually behave.


Why Did MSFT Fall So Strongly After Good Earnings Itself?

Financial markets are far more intelligent than they appear on the surface. Time and again, they manage to locate liquidity at precisely the right moment and at the right price levels. This behavior has been observed repeatedly across market cycles.

More often than not, technical structures move first, and fundamentals arrive later as the catalyst that validates the move. From our perspective, we focus on feeling the candlesticks—placing greater weight on technical analysis than anything else. That said, fundamentals are not ignored; they are simply treated as secondary confirmation rather than the primary driver.

In Microsoft’s case, the market had already priced in the company’s strong performance well before the earnings release. Expectations were high, optimism was elevated, and positioning reflected that confidence. What followed appears to be a classic case of profit booking.

After the earnings announcement, many euphoric participants likely rushed in to buy the stock, assuming strong results would automatically push prices higher. At the same time, more experienced investors found exactly the liquidity they needed to exit their positions and lock in gains. This imbalance between late buyers and early sellers could explain why MSFT declined sharply—even after delivering solid earnings results.

In essence, the post-earnings drop may not be a reflection of weakness in the business, but rather the market efficiently redistributing risk and reward.

When expectations are high, even strong performance can fail to push prices higher. What follows is often a reset rather than a rejection of the business itself.

Markets Are Smarter Than They Look

Financial markets have a habit of doing one thing extremely well: finding liquidity at the right time and at the right levels. This has been seen repeatedly across cycles, sectors, and asset classes.

Very often, technical direction leads, and fundamentals arrive later as the justification.

Price moves first; narratives follow. That’s why, in our framework, we focus on feeling the candlesticks. Technical analysis takes priority – not because fundamentals don’t matter, but because they are usually already reflected in price.

In Microsoft’s case, the market had already priced in strong performance well ahead of earnings. Optimism was elevated, positioning was heavy, and expectations were stretched.


Strong Earnings, Weak Price: A Classic Market Reaction

Microsoft reported its earnings after the bell, delivering impressive results:

  • Revenue: $81.3 billion, up 17% year over year (above expectations of $80.2 billion)
  • Net Income: $38.5 billion
  • Non-GAAP EPS: $4.14, beating the $3.93 consensus
  • Cloud Revenue: Surpassed $50 billion for the first time

On paper, this was a strong quarter by almost any metric.

Yet the stock fell sharply, dropping more than 11% in the session that followed. This reaction highlights an important reality for Big Tech in 2026: “good” is no longer good enough when valuations are already stretched.

What likely played out was profit booking. Euphoric investors may have bought into the earnings release expecting immediate upside, while more seasoned participants used that surge in liquidity to exit positions. The result was a sharp downside move -not because the business weakened, but because expectations had already peaked.


Long-Term Structure – Inside the 2025 Yearly Range

From a higher-timeframe perspective, MSFT is still trading within the 2025 yearly candlestick range, roughly bounded between 555 on the upper end and 344 on the lower end.

The stock has now retraced sufficiently from its top, entering zones that historically attract interest from long-term participants. This pullback has likely cleared a significant amount of investor froth that built up in the upper range.

For savvy investors, such retracements often matter more than headlines.


Medium-Term Setup – Approaching a Key Moving Average

On the six-month chart, Microsoft is approaching its 9-EMA, a level that has acted as reliable dynamic support in many prior instances.

While no indicator works every time, this moving average often marks zones where selling pressure slows and price discovery becomes more balanced.

This is not a guarantee of a reversal – but it is a zone where risk-reward dynamics begin to shift.


Monthly and Daily Charts Point to the Same Gap Zone

Switching to the monthly timeframe, there is a visible price gap between 396 and 424, created during the sharp upward move at the beginning of May. From that point onward, the stock stayed in a strong upward trajectory – until now.

Price is currently poised to fill that gap, a process that markets frequently undergo before establishing fresh accumulation. Importantly, the same gap structure is visible on the daily chart, reinforcing the technical significance of this zone.

When multiple timeframes point to the same area, markets tend to respond.


The 396–350 Zone: Where Bulls and Bears Clash

The broader range between roughly 396 and 350 represents an area where price discovery could intensify. This zone may attract significant interaction between buyers and sellers, potentially serving as a battleground for accumulation. Such zones often draw interest from institutional and sophisticated investors who prefer to scale into positions systematically rather than chase momentum at elevated levels. As sentiment shifts from euphoria toward caution, this range could be where price begins to stabilize and reset.

As the saying goes:

Be greedy when others are fearful, and fearful when others are greedy.


MSFT’s Long-Term Strategic Position Remains Strong

Microsoft’s fundamental positioning remains deeply rooted in enduring secular trends. Its cloud and enterprise software businesses continue to generate substantial revenue, and its ongoing investments in artificial intelligence reflect a strategic commitment to future growth.

Recent coverage highlights that Microsoft’s AI division has become larger than some of its longstanding franchises, and the company continues to invest heavily in AI infrastructure. CEO Satya Nadella has emphasized that the company is still in the early stages of AI adoption, even as cloud revenue growth slightly decelerates.

Additionally, the market’s concerns around elevated capital expenditures largely tied to AI capacity build-out suggest that investors are wrestling with timing and cost dynamics as much as revenue strength. High AI spending and associated build-out costs have weighed on sentiment, despite long-term revenue potential.

Microsoft’s Stance on Cryptocurrency

Regarding cryptocurrency, Microsoft has maintained a cautious and selective approach rather than aggressive direct investment. In a recent shareholder vote, investors rejected a proposal to explore adding Bitcoin to Microsoft’s corporate treasury, reflecting both the board’s and major investors’ preference for stability over the volatility commonly associated with crypto assets.

Also Read – I Created the Best Bitcoin Guide You’ll Ever Read

Microsoft’s involvement in blockchain technology primarily comes through its Azure cloud platform rather than direct ownership of digital currencies. Azure has offered blockchain-related services and support for enterprise blockchain development, including tools and frameworks that leverage platforms such as Ethereum and other distributed ledger technologies. This reflects a strategy of enabling blockchain and decentralized applications through infrastructure and enterprise services rather than using its corporate balance sheet to hold cryptocurrencies.

This article is for informational purposes only and should not be considered financial advice. Investing in stocks, cryptocurrencies, or other assets involves risks, including the potential loss of principal. Always conduct your own research or consult a qualified financial advisor before making investment decisions. The author and publisher are not responsible for any financial losses incurred from actions based on this article. While efforts have been made to ensure accuracy, economic data and market conditions can change rapidly. The author and publisher do not guarantee the completeness or accuracy of the information and are not liable for any errors or omissions. Always verify data with primary sources before making decisions.

5 Reasons Gold Pulled Back 4% from $5,598 to $5,100

Why Gold Pulled Back 4% From $5,500 to $5,100

Gold prices have been on a historic tear in 2026, smashing through multiple all-time highs amid geopolitical chaos, economic uncertainty, and a weakening U.S. dollar.

After peaking near $5,598 per ounce on January 29, the yellow metal witnessed a sharp 4% retreat, slipping toward the $5,100 level in intraday trading.

The 4% pullback from $5,500 to $5,100 appears to be a healthy correction within a broader bull market rather than a trend reversal. Long-term fundamentals—including central bank diversification, geopolitical uncertainty, and global macro risks—continue to support elevated gold prices.

Such volatility is not unusual in overheated bull markets. Rapid, parabolic gains often invite corrections, even when the broader trend remains intact. While the long-term outlook for gold continues to look constructive – supported by safe-haven demand and sustained central bank buying—the recent pullback reflects a convergence of short-term pressures.

Below are the five key reasons behind gold’s swift reversal.


1. Profit-Taking After an Explosive Rally

Gold’s January rally was extraordinary. Prices surged more than 30% in a single month, rising from around $4,319 at the start of the year to above $5,598 at the peak. Moves of this magnitude naturally attract short-term traders looking to capitalize on momentum.

Once gold approached a major psychological level like $5,500, profit-taking intensified. Many investors chose to lock in gains, especially after gold delivered an unprecedented 64% return in 2025.

As selling began, algorithmic strategies and stop-loss orders amplified the downside, creating a cascading effect that accelerated the decline.


2. Hawkish Federal Reserve and Shifting Rate Expectations

The Federal Reserve’s January decision to keep interest rates unchanged at 3.50%–3.75%, combined with Chair Jerome Powell’s assessment that the U.S. economy remains in a “good place,” dampened expectations for near-term rate cuts.

Also Read – Fed Interest Rates vs Gold Prices – What to Expect Ahead of the September 2025 FOMC Meeting?

Gold typically performs best in low-interest-rate environments, since it does not generate yield. As markets adjusted to the possibility of fewer rate cuts in 2026—amid persistent inflation and resilient growth—real yields edged higher. This shift reduced gold’s relative appeal and triggered a rapid unwinding of bullish positions, contributing to the sharp pullback.


3. Forced Selling From Index Funds and Market Rebalancing

January is a common period for commodity index rebalancing. Passive funds are required to adjust their holdings based on predefined rules, regardless of price trends or fundamentals. This process can result in forced selling, even during strong bull markets.

Such mechanical flows can temporarily distort prices, increasing volatility and pressuring gold lower. With banks holding sizable net short positions in paper gold, these rebalancing-driven selloffs tend to magnify downside moves, as weaker hands are shaken out and liquidity-driven declines feed on themselves.


4. Easing Geopolitical Fears and a Shift Toward Risk Assets

Gold’s rally has been fueled in large part by safe-haven demand, driven by geopolitical tensions, trade conflicts, and rising global debt concerns. However, even minor signs of de-escalation can cool demand for defensive assets.

Recent indications of softer trade rhetoric and progress in diplomatic discussions have reduced immediate hedging urgency. At the same time, strong corporate earnings—particularly in the technology sector—and major equity indices pushing to new highs have encouraged a risk-on environment. As capital rotates back into equities, gold often experiences temporary pullbacks.


5. Dollar Stabilization and Speculative Position Unwind

Earlier weakness in the U.S. dollar provided a powerful tailwind for gold, making it cheaper for international buyers. However, as the dollar stabilized, the traditional inverse relationship between the two assets reasserted itself.

Crowded speculative long positions—built on themes such as de-dollarization and fiat currency debasement—began to unwind rapidly once macro signals shifted. While these flows can drive sharp short-term declines, they do not necessarily undermine gold’s longer-term structural support.


This article is for informational purposes only and should not be considered financial advice. Investing in stocks, cryptocurrencies, or other assets involves risks, including the potential loss of principal. Always conduct your own research or consult a qualified financial advisor before making investment decisions. The author and publisher are not responsible for any financial losses incurred from actions based on this article. While efforts have been made to ensure accuracy, economic data and market conditions can change rapidly. The author and publisher do not guarantee the completeness or accuracy of the information and are not liable for any errors or omissions. Always verify data with primary sources before making decisions.