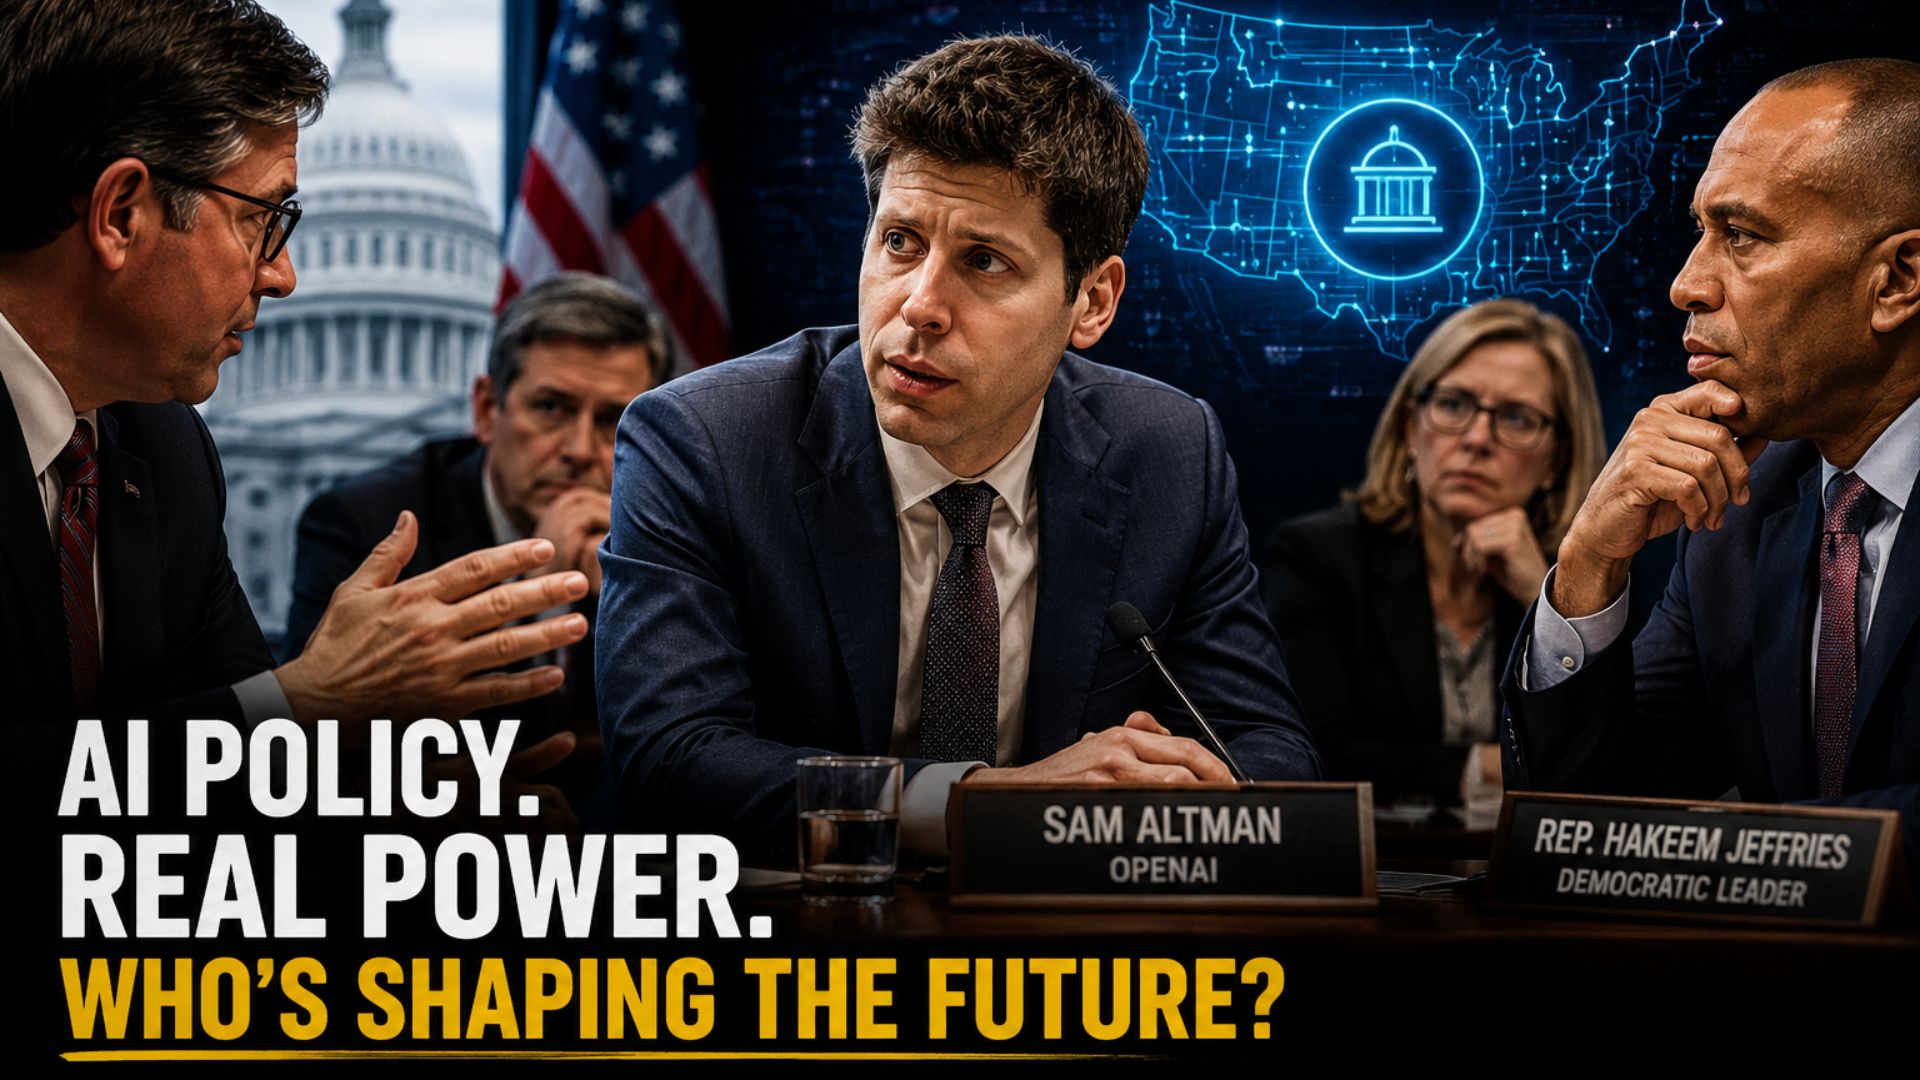
Multi Commodity Exchange Announces q4 FY 2026 Results

MCX Financial Results 2026: Key Highlights, Dividend, and Profit Growth Analysis

The Board of Directors of Multi Commodity Exchange of India Limited met on Friday, May 08, 2026, to approve the audited financial results for the quarter and the full financial year that ended on March 31, 2026.

During this meeting, the board recommended a final dividend of ₹8 per equity share, which has a face value of ₹2 each. This dividend proposal is now awaiting the final approval of the shareholders at the upcoming 24th Annual General Meeting of the company.

Also Read – State Bank of India Declares Massive 1735% Dividend for Shareholders

The specific dates for the meeting and the dividend payment will be shared by the company at a later time.

Consolidated Revenue and Profit Performance

The consolidated financial performance of the company showed growth across major metrics for the full financial year. For the year ended March 31, 2026, the total income reached ₹2,429.05 crores, which is an increase of ₹1,220.19 crores or 100.94% compared to the ₹1,208.86 crores reported in the previous fiscal year.

The net profit for the full year stood at ₹1,331.55 crores, representing a rise of ₹771.51 crores or 137.76% from the ₹560.04 crores earned in the prior year.

Looking at the quarterly performance, the total income for the quarter ended March 31, 2026, was ₹925.33 crores. This is an increase of ₹228.22 crores or 32.74% from the ₹697.11 crores recorded in the preceding quarter ended December 31, 2025.

When compared to the same quarter in the previous year, where income was ₹320.49 crores, the total income rose by ₹604.84 crores or 188.72%. Net profit for the final quarter was ₹529.77 crores, which is an increase of ₹128.65 crores or 32.07% over the ₹401.12 crores reported in the December quarter.

On a year-on-year basis, the net profit grew by ₹394.31 crores or 291.10% from the ₹135.46 crores recorded in the quarter ended March 31, 2025.

Operational Expenses and Statutory Contributions

The company reported total expenses of ₹733.82 crores for the full year ended March 31, 2026, compared to ₹511.55 crores in the previous year.

For the final quarter of the year, expenses were ₹242.10 crores, reflecting an increase from the ₹192.40 crores spent in the previous quarter and the ₹152.96 crores spent in the same quarter of the previous year. A portion of these costs includes employee benefits, which amounted to ₹180.11 crores for the full year. The company also accounted for an expense of ₹0.10 crore related to increased obligations for gratuity and leave encashment following the notification of new Labour Codes by the Government of India.

In terms of regulatory and statutory requirements, the company provided ₹40.56 crores as an exchange contribution to the Core Settlement Guarantee Fund during the final quarter. The total Core Settlement Guarantee Fund corpus as of March 31, 2026, stood at ₹1,367.29 crores.

Additionally, a subsidiary of the company contributed ₹1.00 crore to the Settlement Guarantee Fund as a financial disincentive due to market disruptions that occurred on December 23, 2025, and January 28, 2026, as mandated by the Securities and Exchange Board of India.

Corporate Governance and Internal Audit

The board also approved the re-appointment of M/s. Mittal & Associates as the internal auditors for the company for the 2026-27 financial year. This firm, which was established in 1977, specializes in internal audits for capital market entities.

In financial terminology, an internal audit is an independent process used to review a company’s internal controls and operations to ensure accuracy and compliance. The company continues to operate within a single business segment, which is the commodity exchange business, meaning all its financial reporting is consolidated under this one area of operation.

Company Background

Multi Commodity Exchange of India Limited operates in the financial services sector within the commodity exchange industry. It provides a platform for the nationwide online trading of commodity derivatives, facilitating price discovery and risk management. The company was listed on the stock exchanges in 2012 and operates on a large scale as a key infrastructure provider in the Indian financial markets, supported by its subsidiary, the Multi Commodity Exchange Clearing Corporation Limited.

BKT Tires Hits ₹10,800 Crore Milestone: Balkrishna Industries Announces Final Dividend and Massive ₹2,000 Crore Expansion Plan

Balkrishna Industries Limited – stock latest audited financial results news

Balkrishna Industries Limited held a meeting of its Board of Directors on Friday, May 8, 2026, to approve the audited financial results for the quarter and the full financial year ended March 31, 2026. The company reported a consolidated revenue from operations of ₹10,823.08 crore for the full fiscal year, compared to ₹10,446.95 crore in the previous year.

Alongside these results, the Board recommended a final dividend of ₹4 per equity share, which is 200% on the face value of ₹2 per share. This recommendation is subject to the approval of shareholders at the upcoming 64th Annual General Meeting.

Quarterly Performance and Comparative Analysis

In the fourth quarter ended March 31, 2026, the company achieved a consolidated revenue from operations of ₹2,932.82 crore. When compared to the previous quarter ended December 31, 2025, which saw revenues of ₹2,736.79 crore, this represents an absolute Quarter-on-Quarter increase of ₹196.03 crore, or 7.16%. On a Year-on-Year basis, the revenue of ₹2,932.82 crore rose by ₹180.44 crore from the ₹2,752.38 crore reported in the same quarter of the previous year, marking a 6.56% increase.

The consolidated profit for the period in the fourth quarter stood at ₹299.46 crore. This is a decrease of ₹82.69 crore, or 21.64%, from the ₹382.15 crore earned in the preceding quarter. Compared to the ₹368.55 crore profit in the quarter ended March 31, 2025, the current profit shows a Year-on-Year decline of ₹69.09 crore, or 18.75%.

Also Read – State Bank of India Declares Massive 1735% Dividend for Shareholders

Full Year Financial Review

For the entire financial year ended March 31, 2026, Balkrishna Industries reported a consolidated profit of ₹1,243.10 crore. This represents a decrease of ₹411.86 crore, or 24.89%, compared to the ₹1,654.96 crore profit recorded in the previous financial year. The total income for the year was ₹10,985.74 crore, a slight decrease of ₹89.17 crore from the ₹11,074.91 crore reported in the prior fiscal year, representing a decline of 0.81%. Total expenses for the year were ₹8,798.35 crore, down from ₹9,431.23 crore in the previous year, an absolute decrease of ₹632.88 crore or 6.71%.

Operational Updates and Capacity Expansion

The company provided updates on its ongoing capital projects, noting that its carbon black capacity expansion is expected to reach completion in the first quarter of the 2026-27 financial year. Projects involving Passenger Car Radial Tyres and additional Off-Highway Tyres facilities are currently progressing according to their original schedules. To further support infrastructure development and capacity across On-Road and Off-Road tyre categories, as well as AI-enabled automation and sustainability initiatives, the Board has approved an additional capital expenditure of ₹2,000 crore.

Board Decisions and Corporate Governance

The Board approved the re-appointment of Vipul Shah as a Whole Time Director, designated as Director and Company Secretary, for a five-year term starting February 11, 2027. Additionally, the Board approved the appointment of Deloitte Haskins & Sells LLP as a Joint Statutory Auditor for a period of five consecutive years, beginning from the conclusion of the 64th Annual General Meeting. During the final quarter of the year, the company issued 75,000 listed unsecured non-convertible debentures with a face value of ₹1 lakh each, aggregating to ₹750 crore on a private placement basis.

Company Background

Balkrishna Industries Limited, widely known by its brand BKT, operates in the tyre industry within the auto components sector. Established in 1961, the company specializes in the manufacture of Off-Highway Tyres used in segments such as agriculture, industry, mining, and earthmoving. Balkrishna Industries Limited is a large-scale global player with its equity shares listed on the BSE Limited and the National Stock Exchange of India Limited.

State Bank of India Declares Massive 1735% Dividend for Shareholders

MCX Financial Results 2026: Key Highlights, Dividend, and Profit Growth Analysis

The Central Board of the State Bank of India, during its meeting held on Friday, May 8, 2026, has declared a dividend of ₹17.35 per equity share for the financial year ended March 31, 2026. This dividend payout represents 1735% of the face value of each fully paid-up equity share, which stands at ₹1.

Record Date and Eligibility for Shareholders

To determine which shareholders are eligible to receive this payment, the bank has established Saturday, May 16, 2026, as the official record date.

A record date is a specific date set by a company to finalize the list of shareholders who are documented on its books as owners of the stock, thereby qualifying them to receive the declared dividend. Only those investors who hold the bank’s shares by the close of business on this date will be entitled to the payout.

Also Read – SBI Earned ₹80,032 Crore in FY26 – But 3 Numbers in Its Results Should Make Investors Nervous

Details of Book Closure and Payment Timeline

Following the record date, the State Bank of India will initiate a book closure period starting from Sunday, May 17, 2026, through Tuesday, May 19, 2026. Both the start and end dates are included in this period.

Book closure is a process where a company temporarily suspends the transfer of shares in its records to facilitate the accurate processing of dividend payments to the identified eligible members.

The bank has scheduled the actual dividend payment date for Thursday, June 4, 2026.

About State Bank of India

State Bank of India is a prominent entity in the banking and financial services sector, operating as a public sector bank. Headquartered in Mumbai, it manages a vast scale of operations both within India and internationally. As a central pillar of the Indian financial industry, it provides a wide range of banking products and services to retail, corporate, and institutional clients.

Shipping Corporation of India Reports Financial Results for Fiscal Year 2025-26

The Shipping Corporation of India Limited – stock latest AUDITED FINANCIAL RESULTS news

The Shipping Corporation of India Limited has officially announced its audited financial results for the quarter and the full financial year ended March 31, 2026.

Following a meeting of the Board of Directors held on May 8, 2026, the company reported a significant increase in its annual performance. For the full financial year 2025-26, the company achieved a standalone profit after tax of ₹1,326.25 crore, which represents a 62.91% increase compared to the ₹814.10 crore profit recorded in the previous financial year.

Shipping Corporation of India Dividend q4 2026

The Board has also recommended a final dividend of ₹1 per equity share of face value of ₹10 each, amounting to a 10% dividend payout, which is subject to shareholder approval at the upcoming Annual General Meeting.

Quarterly Performance and Sequential Growth

During the fourth quarter of the financial year, the company recorded a standalone profit after tax of ₹413.76 crore. When compared to the preceding quarter ended December 31, 2025, where the profit was ₹393.37 crore, this represents a quarter-on-quarter increase of ₹20.39 crore, or 5.18%.

The total income for the quarter stood at ₹1,657.30 crore, showing a slight decrease of ₹8.84 crore, or 0.53%, from the ₹1,666.14 crore reported in the third quarter.

Revenue from operations for the period was ₹1,512.73 crore, while other income saw a substantial rise to ₹144.57 crore from ₹54.92 crore in the previous quarter.

Also Read –Netripples Software Limited Announces Financial Results for Quarter and Year Ended March 31, 2026

Year-on-Year Comparisons and Annual Totals

On a year-on-year basis, the fourth-quarter profit of ₹413.76 crore shows a significant rise of 140.32% over the ₹172.17 crore profit reported in the same quarter of the previous year.

Total income for the quarter also grew by ₹257.82 crore, an 18.42% increase from the ₹1,399.48 crore earned in the quarter ended March 31, 2025.

For the entire financial year 2025-26, the total income reached ₹6,218.36 crore, marking a 7.48% growth over the ₹5,785.37 crore recorded in the 2024-25 fiscal year. The earnings per equity share for the full year improved to ₹28.47 from ₹17.48 in the prior year.

Segment Wise Revenue and Operations

The company operates through four primary segments: Liner, Bulk Carrier, Tanker, and Technical and Offshore. The Tanker segment remained the largest contributor to the revenue, generating ₹1,074.46 crore during the final quarter and ₹3,942.23 crore for the full year. The Bulk Carrier segment contributed ₹217.83 crore to the quarterly revenue, while the Liner and Technical and Offshore segments accounted for ₹164.67 crore and ₹72.37 crore, respectively.

In terms of segment results, the Tanker division reported a profit of ₹362.71 crore before tax and interest for the quarter, while the Bulk Carrier segment turned around from a loss in the previous quarter to a profit of ₹19.25 crore.

Consolidated Financial Overview

On a consolidated basis, which includes the performance of subsidiaries like Inland and Coastal Shipping Limited and SCI Bharat IFSC Limited, as well as joint ventures, the company reported an annual profit after tax of ₹1,422.81 crore for the fiscal year 2025-26. This is a substantial increase from the ₹843.58 crore reported in the previous year.

The consolidated total income for the year was ₹6,226.78 crore. For the quarter ended March 31, 2026, the consolidated profit after tax was ₹404.60 crore, compared to ₹185.14 crore in the corresponding quarter of the previous year.

Geopolitical and Administrative Updates

The company provided updates regarding maritime disruptions in the Middle East that occurred in February 2026.

Four vessels—Desh Garima, Desh Suraksha, Desh Vibhor, and Desh Vaibhav—faced restricted movement through the Strait of Hormuz due to heightened security risks. While one vessel, Desh Garima, reached Mumbai in April 2026, the others awaited clearance as of the reporting date. Management noted that freight revenue for these vessels has been recognized based on the percentage of voyage completion and stated that the disruption does not have a material impact on the financial statements.

Additionally, the company noted that the strategic disinvestment process initiated by the Government of India remains in progress.

Also Read – Does money go to the company when you buy shares from the stock exchange?

Company Background

The Shipping Corporation of India Limited is a Government of India Enterprise and a Navratna company. It operates in the shipping sector, providing a wide range of services including the transportation of goods and passengers. Established in 1950 and listed on the major Indian stock exchanges, the company manages a diverse fleet of tankers, bulk carriers, and container vessels. As a significant player in the Indian maritime industry, it maintains a large scale of operations both domestically and internationally, catering to various energy and trade requirements.

Netripples Software Limited Announces Financial Results for Quarter and Year Ended March 31, 2026

Balkrishna Industries Limited – stock latest audited financial results news

Netripples Software Limited has released its standalone unaudited financial results for the fourth quarter and the full financial year ending March 31, 2026.

The company’s Board of Directors approved the results during a meeting held on May 8, 2026. The figures highlight an increase in annual revenue and a growth in annual net profit, despite a loss recorded in the final quarter.

Quarterly Revenue and Income Performance

For the quarter ended March 31, 2026, Netripples Software Limited reported total revenue from operations of ₹2.02 crore. This represents a Quarter-on-Quarter (QoQ) absolute increase of ₹0.44 crore compared to the preceding quarter ended December 31, 2025, which saw revenue of ₹1.58 crore. This change indicates a growth of 27.85%.

On a Year-on-Year (YoY) basis, revenue saw a marginal absolute decrease of ₹0.01 crore from the ₹2.03 crore reported in the quarter ended March 31, 2025, reflecting a decline of 0.49%.

Total income for the quarter remained at ₹2.02 crore as no other income was reported.

Review of Quarterly Expenses and Profitability

Total expenses for the quarter ended March 31, 2026, amounted to ₹2.09 crore. This total includes employee benefits of ₹4.25 lakhs, depreciation and amortization of ₹3.50 lakhs, and other expenses of ₹2.01 crore.

The company recorded a net loss of ₹7.20 lakhs for the quarter.

This is a shift from the preceding quarter ended December 31, 2025, which had a net profit of ₹3.92 lakhs, resulting in a QoQ absolute decrease in profit of ₹11.12 lakhs or 283.67%.

Compared to the net loss of ₹0.84 lakhs in the same quarter of the previous year, the loss widened by an absolute ₹6.36 lakhs, a YoY increase in loss of 757.14%.

Full Year Financial Performance Comparison

For the full financial year ended March 31, 2026, Netripples Software Limited reported total revenue of ₹7.18 crore.

When compared to the ₹6.27 crore recorded in the previous financial year ended March 31, 2025, the company achieved an absolute Year-to-Year (FY-to-FY) increase of ₹0.91 crore, or a growth of 14.51%. Total annual expenses were ₹7.15 crore, up from ₹6.25 crore in the prior year.

The net profit for the full year 2026 stood at ₹2.72 lakhs, compared to ₹2.10 lakhs in the previous year. This reflects an absolute annual profit increase of ₹0.62 lakhs, representing a growth of 29.52%.

Assets, Liabilities, and Cash Flow Position

The company reported total assets of ₹10.23 crore as of March 31, 2026. Current assets made up ₹10.10 crore of this amount, with inventories valued at ₹9.80 crore.

Non-current assets, consisting of property, plant, and equipment, were reported at ₹12.80 lakhs.

Total liabilities stood at ₹3.41 crore, and the paid-up equity share capital was unchanged at ₹6.82 crore.

According to the cash flow statement, net cash flows from operating activities were ₹2.72 lakhs, with cash and cash equivalents ending the period at ₹7.49 lakhs.

Explaining Financial Concepts

In financial reporting, revenue from operations is the total amount of money a company receives from its primary business activities.

Net profit or loss is the final amount remaining after all operating costs, interest, and taxes have been paid.

A Year-on-Year (YoY) comparison looks at the same quarter across different years, while a Quarter-on-Quarter (QoQ) comparison looks at consecutive periods within the same or adjacent years.

Company Background and Scale

Netripples Software Limited is an information technology company that specializes in software development, particularly for the healthcare and medical sectors. Headquartered in Hyderabad, the company has been active since 1993. It operates as a small-to-medium scale enterprise providing various technology and software solutions to its clients.

Does money go to the company when you buy shares from the stock exchange?

where does the money I put to buy a stock go and how does a company make use of the fund I put in?

If you’ve ever bought a stock and wondered – “wait, where did my money actually go?” – you’re asking exactly the right question.

Most beginners assume the company receives their money. The reality is a little more interesting.

The short answer is: no, the company generally does not get your money when you buy shares on the stock exchange.

Here’s why.


The Stock Market Has Two Very Different Phases

Think of the stock market not as one single place, but as a system with two distinct phases. Understanding this is the key to everything.

Phase 1 – The Primary Market

This is the phase where a company actually receives money from investors. It happens through a process called an IPO (Initial Public Offering) — the very first time a company offers its shares to the public.

When a company launches an IPO (and it’s not an OFS – Offer for Sale, where existing shareholders are selling), it is essentially saying: “We’re selling shares to raise funds.” Investors buy those freshly created shares, and that money lands directly in the company’s bank account. The company then uses it for operations, expansion, hiring, paying off debt – whatever it needs.

This is the one moment where buying a share means the company directly benefits from your money. It’s a direct transaction: company on one side, investor on the other.

Phase 2 – The Secondary Market

This is where the confusion starts for most beginners – because this is where almost all everyday stock trading happens.

Once a company has done its IPO, those shares are now out in the world, held by investors. Those shares are now listed on the stock exchange – NSE, BSE, NYSE, or wherever.

Who gets the money when you buy a share on the stock exchange?

When you log into your trading app and buy a stock, you are almost always buying from one of these existing investors, not from the company itself.

The person selling it to you – another investor – gets the money. The company is simply watching from the sidelines. It doesn’t receive a single rupee from this transaction.

The stock exchange here is just a facilitator – a giant, highly efficient marketplace that connects buyers and sellers. It doesn’t create new ownership; it just transfers existing ownership from one person to another.

Also Read – Does the share price go up because company profits are added to it?


When you sell a stock, where does the money come from?

When you decide to sell your shares, the money comes from a new investor who wants to buy what you’re selling. They pay you, you hand over the shares, and the company is again completely uninvolved.

It’s a continuous chain:

  • Early investor buys in IPO – company gets money
  • Early investor sells on exchange – new investor pays them
  • New investor sells later – another new investor pays them …and so on

The company’s shares keep changing hands, but the company only ever saw money from that very first transaction.


One Exception Worth Knowing – Share Buybacks

There is one scenario where the company does pay you money for your shares — it’s called a Share Buyback.

Sometimes, a company decides it wants to repurchase its own shares from the market. It does this for various reasons – perhaps it believes its stock is undervalued, or it wants to return extra cash to shareholders. There are two common ways this happens: in an open market buyback, the company simply buys shares at the prevailing market price, just like any other investor would. In a tender offer buyback, the company approaches shareholders directly and offers to buy their shares at a fixed price, which is usually above the current market price – giving investors an incentive to participate.

Either way, the money flows from the company’s treasury to you. This is one of the few times the company actively steps into the market as a buyer rather than watching from the sidelines.


So What Do You Actually Own After Buying Shares?

Even though your money went to a previous investor and not to the company, you are now a part-owner of that company. This is what a share represents – a small slice of ownership.

As a shareholder, you’re entitled to:

  • A share of the company’s profits, if they pay dividends
  • Voting rights on major company decisions
  • A proportional claim on the company’s assets if it ever shuts down

The company may not have received your money, but your stake in the company is completely real.


A Simple Way to Think About It

Imagine a friend starts a bakery and sells you 10% of it for ₹10,000. That money goes to them to buy ovens and ingredients – that’s the primary market.

A year later, you want to sell your 10% stake. You find another person who pays you ₹15,000 for it. The bakery owner was never part of that deal – that’s the secondary market.

The stock exchange works exactly like this, just at a massive scale with millions of buyers and sellers every single day.


Quick Recap

SituationWhere does your money go?
Buying in an IPO Directly to the company
Buying on the stock exchangeTo the investor selling you the shares
Company does a share buyback Company pays money to you

Most of the time, when someone asks

“does the company get the money when I buy its stock?”

– the honest answer is no.

But you still become a real owner. And that ownership is what makes stocks valuable in the first place.

This article is for informational purposes only and should not be considered financial advice. Investing in stocks, cryptocurrencies, or other assets involves risks, including the potential loss of principal. Always conduct your own research or consult a qualified financial advisor before making investment decisions. The author and publisher are not responsible for any financial losses incurred from actions based on this article. While efforts have been made to ensure accuracy, economic data and market conditions can change rapidly. The author and publisher do not guarantee the completeness or accuracy of the information and are not liable for any errors or omissions. Always verify data with primary sources before making decisions.

Does the share price go up because company profits are added to it?

Does the share price go up because company profits are added to it?

This is a major confusion that beginners face. We think of the relationship between a stock and the company in a way that is completely opposite to reality. And it is not our fault – the way most people explain the stock market makes it sound like a simple profit-sharing machine. But it is not.

Shares are priced like marks on a paper

Shares are priced like people are giving marks to them – marks based on both present performance and future expected performance.

Think of it like a student being graded not just on last year’s results, but also on how much potential the teacher thinks the student has going forward.

If a company earns a profit, the share price goes up – not because the profits are added to it – but based on the perception that the company has done well and will do even better in the future.

The keyword here is perception. It is an opinion held by thousands of investors simultaneously, and that collective opinion is what moves the price.

Company performance and share price are relative in the stock market.

This is why two companies with the same profit can have very different stock price movements on the same day.

The market is always asking: “Was this good enough? And what does it tell us about tomorrow?”

Also Read – Does money go to the company when you buy shares from the stock exchange?

Then where do the profits actually go?

Now you may think – what about the profits? If they are not going into the share price, where are they going?

Yes, profits are added – but in the balance sheet, under an account called retained earnings. This is essentially the company’s savings account. When a company earns a net profit and does not make any major investment or announce a dividend, those profits sit in retained earnings.

Retained Earnings = Net Profit − Dividends Paid.

It is the portion of profit that the company keeps for itself – to reinvest, repay debt, or build a cash reserve. It shows up on the balance sheet under shareholders’ equity, not in the share price directly.

Now, if the company decides to share some of this profit with shareholders, it announces a dividend. This reduces retained earnings and rewards investors with a cash payout. Alternatively, a company may use profits to buy back its own shares from the market – called a buyback – which can indirectly push the share price up by reducing the number of shares in circulation.

So what actually moves the share price?

The share price moves based on demand and supply — and demand is driven by expectation. When more people want to buy a stock than sell it, the price rises. When more want to sell, it falls. Profits are one of the key factors that shape that expectation — but they are not the only one.

Other factors that influence share price include the overall market mood, interest rates, sector performance, global events, and management commentary. This is why a war breaking out in some part of the world can pull down an otherwise healthy company’s stock — even if the company itself did nothing wrong.

Also Read – What Does FY Mean? – Explained (Full Guide)

But what if the stock falls even on good results?

This is where it gets really interesting — and counterintuitive. Sometimes the share price goes down even when the company shows good results. Investors mainly cite the following reasons when this happens:

  • The results did not come as expected. The market does not react to profits in isolation — it reacts to how those profits compare to what analysts were expecting. If the street was expecting ₹500 crore in profit and the company reports ₹420 crore, it is still a profit — but it is a disappointment. The stock will likely fall.
  • Weak management commentary about the future. Sometimes the numbers are fine, but what the CEO says on the earnings call is not. If management signals slower growth ahead, rising input costs, or increased competition, investors reprice the stock immediately based on that revised future outlook.
  • The market had already priced in the good news. This is perhaps the most fascinating reason. If a company’s results were widely expected to be good, smart money had already bought in weeks ago. By the time the results drop, there is no new reason to buy — and the stock may actually fall as early investors exit to book their profits. This is called “buy the rumour, sell the news.”

Imagine a company whose stock has already risen 20% in the two months leading up to its results because everyone expected a strong quarter. The results come out — and they are indeed strong. But since the good news was already baked into the price, there is no upside surprise left. Investors who bought early now sell to lock in their gains, and the stock drops 5% on the same day it announced record profits.

And what happens when results beat expectations?

The price could have gone much higher if the results came in better than expected. That would have led to an even bigger jump in the share price – because the market loves a positive surprise far more than a result it already saw coming.

This is why companies sometimes intentionally set conservative guidance – so the actual results appear to “beat” expectations and trigger a sharper price rally. It is a well-known game between management and the market.

So the next time you see a company post profits and the stock barely moves – or even falls – you will know exactly why. The stock market is not a bank account where profits get deposited into the share price. It is a forward-looking mechanism that runs entirely on expectations, perception, and surprise.

This article is for informational purposes only and should not be considered financial advice. Investing in stocks, cryptocurrencies, or other assets involves risks, including the potential loss of principal. Always conduct your own research or consult a qualified financial advisor before making investment decisions. The author and publisher are not responsible for any financial losses incurred from actions based on this article. While efforts have been made to ensure accuracy, economic data and market conditions can change rapidly. The author and publisher do not guarantee the completeness or accuracy of the information and are not liable for any errors or omissions. Always verify data with primary sources before making decisions.

What Does FY Mean? – Explained (Full Guide)

What Does FY Mean? - Fiscal Year - financial year

FY stands for Fiscal Year or Financial Year – a 12-month accounting period that businesses, governments, and organizations use for financial reporting, budgeting, and tax purposes.

It does not have to follow the calendar year (January to December). In fact, many countries and companies run their fiscal year on a completely different schedule.

Fiscal Year and Financial Year mean the same thing. They’re interchangeable terms for the same 12-month accounting period.

“Fiscal year” is more commonly used in the United States and Canada, while “financial year” is the preferred term in India, the UK, and Australia.


Why a Fiscal Year matters?

A fiscal year is the period over which an organization tracks its revenues, expenses, profits, and losses for official reporting purposes. At the end of each fiscal year, companies publish financial statements, file taxes, and report earnings to shareholders or governing bodies.

Think of it as the financial “chapter” of a business or government’s story — one complete cycle of income and spending, summarized and closed out every 12 months.

Why Don’t All Organizations Use the Calendar Year?

There are a few practical reasons:

  • Seasonal businesses prefer a fiscal year that ends after their slow season, so their books look cleaner
  • Government budgets are often set at different times of year, so their fiscal cycles align with legislative schedules
  • Industry norms – many sectors (retail, agriculture, education) have natural rhythms that don’t align with January–December

When Does a Fiscal Year Start and End?

This varies by country and organization. Here are the most common fiscal year schedules around the world:

Country / RegionFiscal Year StartFiscal Year End
United States (Federal)October 1September 30
United States (most corporations)January 1December 31
IndiaApril 1March 31
United KingdomApril 6April 5
AustraliaJuly 1June 30
CanadaApril 1March 31
JapanApril 1March 31

India’s financial year runs April 1 to March 31.


How Is a Fiscal Year Different From a Calendar Year?

Calendar YearFiscal Year
Always Jan 1 – Dec 31?YesNo
Used for?General timekeepingFinancial reporting & tax
Same for everyone?YesVaries by org / country
Can span two calendar years?NoYes (e.g., Oct 2025–Sep 2026)

How Companies Choose Their Fiscal Year?

Corporations typically choose a fiscal year that makes operational sense for their business. Some common choices:

  • Retailers often end their fiscal year in January or February – after the holiday shopping season – so Q4 captures peak revenue
  • Tech companies vary widely; many use calendar year but some (like Microsoft) use a July–June fiscal year
  • Agricultural businesses may align with harvest cycles
  • Schools and universities often run July–June to match the academic year

In the US, the IRS allows any 12-month period as a fiscal year, provided it’s consistent from year to year.


FY in Business: Common Uses

You’ll see “FY” used constantly in business contexts:

  • FY Revenue: Total income earned in a fiscal year
  • FY Budget: Money allocated for the fiscal year
  • FY Targets / FY Goals: Annual performance objectives
  • Q1 FY26, Q2 FY26…: Quarters within a fiscal year (each fiscal year has 4 quarters)
  • End of FY / EOFY: The final days of a fiscal year, often a busy period for accounting teams

Quick Reference: FY Terms Glossary

TermMeaning
FYFiscal Year
FY25Fiscal Year 2025
FY26Fiscal Year 2026
Q1–Q4Four quarters within a fiscal year
EOFYEnd of Fiscal Year
Financial YearSame as Fiscal Year (more common outside the US)
YTDYear to Date (from the start of the fiscal year to now)
Prior Year / PYThe previous fiscal year

Key Takeaways

  • FY = Fiscal Year — a 12-month financial reporting period
  • A fiscal year does not have to match the calendar year
  • The start and end dates of a fiscal year vary by country and organization
  • India’s financial year runs April 1 to March 31
  • The US Federal fiscal year runs October 1 to September 30

Understanding fiscal years is essential for reading financial reports, interpreting earnings announcements, planning budgets, and filing taxes correctly – no matter which country or industry you’re working in.

This article is for informational purposes only and should not be considered financial advice. Investing in stocks, cryptocurrencies, or other assets involves risks, including the potential loss of principal. Always conduct your own research or consult a qualified financial advisor before making investment decisions. The author and publisher are not responsible for any financial losses incurred from actions based on this article. While efforts have been made to ensure accuracy, economic data and market conditions can change rapidly. The author and publisher do not guarantee the completeness or accuracy of the information and are not liable for any errors or omissions. Always verify data with primary sources before making decisions.

What do the green and red numbers mean in stocks? – Simple Explanation for Beginners

What do the green and red numbers represent in stock trading?

The first time most people open a stock market app, it doesn’t feel like money at all.

It feels like noise.

Red numbers, green numbers, percentages, values constantly moving… everything changing every second. It almost looks like a control panel instead of something related to investing.

And naturally, the first thought that comes to mind is simple:

What do these numbers actually mean?

The truth is, these numbers are not complicated. They just look complicated because no one explains them in a simple, relatable way.

Once you understand the basic idea behind them, everything starts to feel much clearer.


Understanding the Most Important Concept: Closing Price

Before understanding all the numbers, you need to understand one single concept:

Closing price.

When someone says a stock “closed at ₹100”, it simply means this:

Throughout the day, people are buying and selling that stock. Because of this, the price keeps changing continuously. It might go from ₹98 to ₹101, then to ₹99, then to ₹100, and so on.

At the end of the day, just before the market closes, the last transaction that happens between a buyer and a seller determines the final price.

That final price is called the closing price.

So if a stock “closed at ₹100”, it means the last deal of the day happened at ₹100.

This closing price becomes the most important reference point for the next day.


What do the green and red numbers mean in the stock market?

Now imagine this.

Yesterday, the stock closed at ₹100.

Today, you open your app and see ₹103.

What does that mean?

It simply means the price is ₹3 higher than where it ended yesterday.

That’s it.

The entire system of stock market numbers revolves around comparing the current price with the previous closing price.


Breaking Down Stock Market Numbers

When you look at a stock, you will usually see something like this:

₹103 +3 (+3%)

This may look confusing at first, but it’s actually very simple when broken down.

The first number, ₹103, is the current price. This tells you where the stock is right now.

The second number, +3, is the absolute change. This shows how much the price has moved compared to yesterday’s closing price.

The third number, +3%, is the percentage change. This shows how big that movement is in percentage terms.

All three numbers are just different ways of telling the same story.


Understanding Positive and Negative Changes

Now let’s look at both scenarios clearly.

If yesterday the stock closed at ₹100 and today it is at ₹103, then:

₹103 +3 (+3%)

This means the price has increased by ₹3.

This is usually shown in green.

On the other hand, if yesterday it closed at ₹100 and today it is at ₹97, then:

₹97 -3 (-3%)

This means the price has decreased by ₹3.

This is usually shown in red.

So the logic is simple.

Positive change means the price has gone up.
Negative change means the price has gone down.

Watch this video for a better understanding!


Why Are Some Numbers Green and Some Red?

The colors in the stock market are there to make things easier to understand visually.

If the current price is higher than the previous closing price, it is shown in green. This indicates that the stock is up.

If the current price is lower than the previous closing price, it is shown in red. This indicates that the stock is down.

There is nothing more complicated behind it. It is simply a visual indicator of whether the price is higher or lower compared to the last closing price.


What Do Percentage Changes Really Mean?

A common beginner confusion is this:

If the absolute change is already shown, why do we need percentage?

The answer is simple.

Absolute change alone does not tell you how significant the movement is.

For example, if a stock moves from ₹100 to ₹103, that is a 3% move.

But if a stock moves from ₹1000 to ₹1003, that is only a 0.3% move.

Even though the change is ₹3 in both cases, the impact is very different.

Percentage helps you understand the intensity of the movement, not just the number.


What is Meant by “Points” in the Stock Market in India?

When people talk about the stock market moving in “points”, they are usually referring to an index like Nifty or Sensex.

If someone says the market went up by 100 points, it simply means the index value increased by 100 units.

This is very similar to how individual stock prices move, but instead of a single company, an index represents a group of companies.

So “points” is just another way of expressing numerical movement, especially for indices.


What Does It Mean When the Market Drops 1,000 Points?

You might often hear statements like:

“The market dropped 1,000 points today.”

This does not mean that every stock lost value equally.

It means that a major index, like Sensex or Nifty, has fallen by 1,000 points compared to its previous closing value.

This usually indicates a broad decline in the market, but the actual impact can vary across different stocks.

Some stocks may fall more, some less, and a few might even rise.


Bringing It All Together

At first, stock market numbers look confusing because they are presented all at once.

But in reality, they are just telling one simple story in three ways.

The current price tells you where the stock is right now.

The absolute change tells you how much it has moved compared to the last closing price.

The percentage change tells you how big that movement is.

And all of this is always being compared to one reference point:

Where the price last ended.


Final Thought

Once you understand this, the stock market stops feeling like a complicated system full of random numbers.

It starts feeling like a simple comparison.

Every number you see is just answering one question:

Where is the price now, compared to where it was before?

And once this clicks, the entire screen that once felt confusing starts making sense.

What are Q1, Q2, Q3, and Q4 in the stock market?

In the stock market, Q1, Q2, Q3, and Q4 simply refer to the four quarters of a financial year (fiscal year). Instead of reporting performance for the entire year at once, companies break it into these four parts to show progress step by step. Q1 represents the first three months of the financial year, Q2 covers the next three months, Q3 includes the following three months, and Q4 represents the final three months of the year.

What does it mean when the Dow drops 1,000 points?

It means the Dow Jones Industrial Average is 1,000 points lower than its previous closing level. In simple terms, the combined value of 30 major U.S. stocks has declined compared to the last trading day’s close. This reflects overall market weakness and selling pressure.

What is Meant by “Points” in the Stock Market in India?

When people talk about the stock market moving in ‘points,’ they usually mean the index has moved up or down by a certain number of units. For example, if the market goes up by 100 points, it means the index value has increased by 100

How to do Paper Trading in Upstox? – A Complete Guide for Beginners (2026)

With platforms like Upstox and Sensibull, it becomes easy to practice trading in segments such as Nifty and Bank Nifty options, stock futures and options, currency derivatives like USDINR, and commodities including gold, silver, and crude oil.

Paper trading is one of the best ways to learn trading without risking real money. It allows traders to test strategies in real market conditions and understand how trades behave before using actual capital.

With platforms like Upstox, it is possible to forward test strategies across multiple segments including Nifty, Bank Nifty, and stock futures and options.

How to do Paper Trading in Upstox? – Step-by-Step Tutorial


Can You Do Paper Trading on Upstox on your Computer?

Open the Sensibull website and proceed to login using Upstox credentials.
  • After logging in, go to the Trade section in the upper menu.
  • Locate the Practice Trade/Draft Portfolios option and open it.
Feel The Candlesticks
  • Once opened, it will say that you can’t do paper trading because you have a free plan.
Feel The Candlesticks

In conclusion, no.

Unlike Zerodha, Upstox offers only a free plan that won’t let you do paper trading on a PC.


How to Do Paper Trading on Upstox on your Mobile?

However, Upstox allows you to do paper trading on the Sensibull mobile app – even with a free plan – as long as you log in using your Upstox account.

  • Go to the Play Store or App Store and download the Upstox application.
  • Open the app and create a demat account if it is not already created.
  • After the account becomes active, go back to the Play Store or App Store.
  • Search for Sensibull and download the application.
  • Open the Sensibull app and login using Upstox credentials.
  • After logging in, you will be in the ‘Home’ section.
  • Click on Practice Trade/Draft Portfolios option and start practicing.

Paper trading does not require any real money. The platform provides virtual capital for practice, and all trades are simulated but based on real market data. This helps in understanding market behavior without financial risk.

After setting up, trading can be practiced in segments like Nifty, Bank Nifty, stock options, and futures. Traders can execute trades, such as buying calls and puts or selling options.

It is also possible to test different strategies like straddles and iron condors, observe how option premiums move, and improve risk management and position sizing skills.


Important Considerations

Paper trading does not involve real emotions like fear or greed, so real trading can feel very different. The focus should be on consistency and learning rather than just profits.

It is also important to practice risk management right from the start.


Does Upstox allow paper trading?

No, Upstox does not support paper trading directly. However, you can do paper trading indirectly via Sensibull on your mobile if you have an active Demat account with Upstox.

How do I switch to paper trading with Upstox?

To practice paper trading with Upstox in the Indian financial markets, you must have a Demat account with them. Once your account is active, log in to Sensibull using your Upstox credentials on your mobile; from there, you can practice under the ‘Virtual Trading’ option.