Since traders across India use GIFT Nifty as an early indicator of how the market might open, a frozen chart can instantly create doubt.
You might start questioning whether your internet is acting up, whether your broker’s platform has stopped updating, or whether global markets have suddenly gone silent.
The truth is, when GIFT Nifty appears stuck, there is usually a perfectly logical reason behind it.
Before jumping to conclusions, it helps to understand how GIFT Nifty actually trades, when it pauses, and what external factors influence its movement.
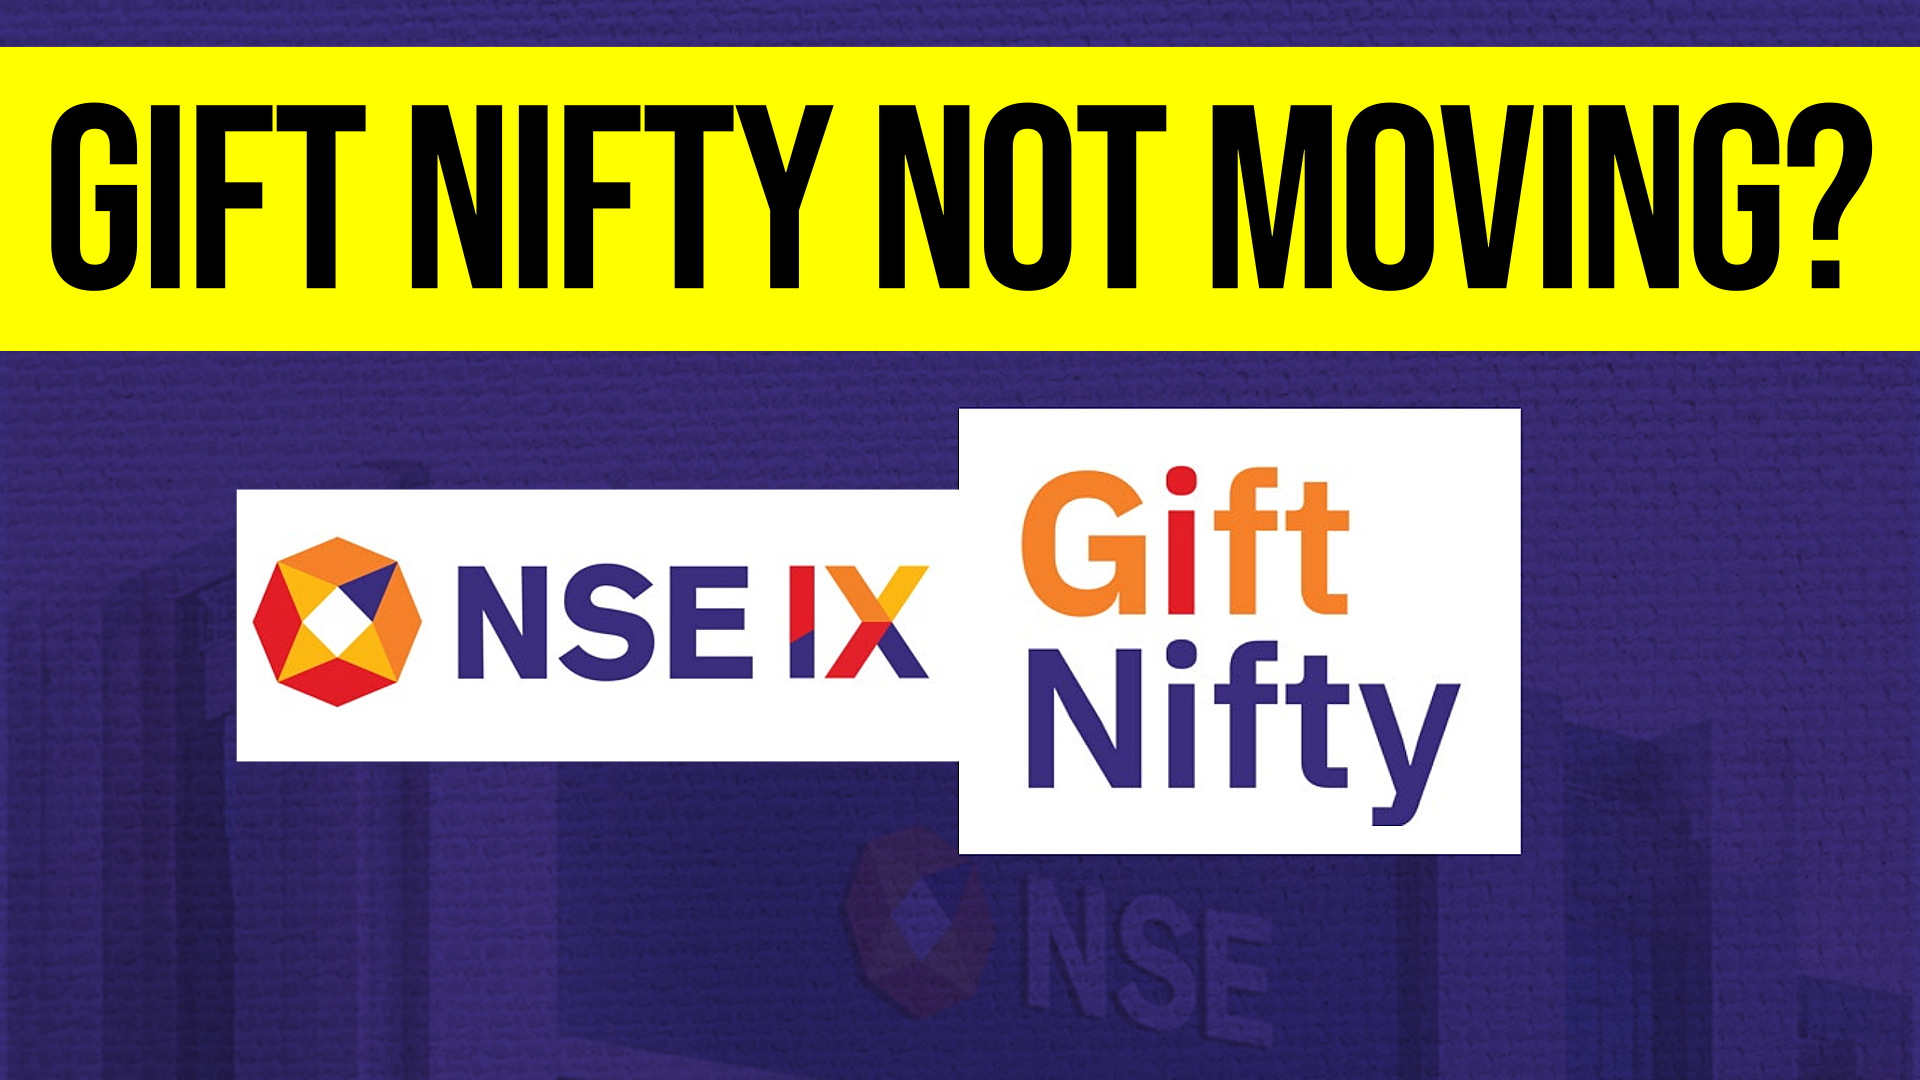
What Is GIFT Nifty and Why Do Traders Watch It?
GIFT Nifty is the international futures contract based on the Nifty 50, traded on the NSE International Exchange located in GIFT City (Gujarat International Finance Tec-City), Gujarat.
It was previously known as SGX Nifty before trading migrated from Singapore to India.
Unlike the regular NSE cash market, which operates only from 9:15 AM to 3:30 PM IST, GIFT Nifty trades for 20 hours and 35 minutes daily across two sessions.
Also Read – Gift Nifty Timings Changed – Check Latest Trading Timings in India (2026)
Because of this extended trading window, it captures overnight movements from Asian, European, and US markets – making it one of the most closely watched indicators for Indian traders.
But despite these long trading hours, there are several periods when GIFT Nifty may appear completely inactive.
Let’s understand why.
1. You May Be Looking During the Scheduled Session Break
One of the biggest surprises for newer traders is discovering that GIFT Nifty does not trade continuously without interruption.
There is a scheduled break between its two daily sessions.

As per the latest official timings, trading typically pauses between 3:40 PM and 4:05 PM IST, allowing the exchange to complete settlement and transition into the next session. During this 25-minute period, no trades occur, which means prices remain unchanged.
Note: You may find outdated information online suggesting a longer 55-minute break. However, according to the current official trading hours, the gap has been standardized to this shorter 25-minute window to provide more active trading time.
While the “Normal Market” for the second session officially resumes at 4:05 PM, the exchange begins a brief Pre-Open period at 3:58 PM. If you check your charts during this window and see no movement, the market is not broken – it is simply in its official transition gap.
This “dead zone” often tricks traders into thinking their charting platform has frozen, when in reality, the exchange itself is temporarily paused.
2. The Overnight Market Closure May Be in Effect
Although GIFT Nifty trades for nearly 21 hours, it does not operate 24 hours a day.
Its second session usually ends exactly at 2:45 AM IST, and the next trading day begins at around 6:30 AM IST. During this 3-hour and 45-minute gap, there is no live trading activity.
If you are checking your charts at 3 AM, 4 AM, or even 5 AM, the price you see is simply the last traded price from the previous session.
Nothing is wrong. The market is closed. Many early-morning traders misinterpret this quiet period as a lack of volatility, when in reality, the trading engine has simply shut down until the next session begins.
3. Global Markets May Be Quiet
This is probably one of the most important reasons that you should know and learn about.
Sometimes GIFT Nifty is technically open, but the chart remains completely flat and shows almost no price action.
This usually happens when global markets enter a catalyst vacuum, typically from 1:30 AM IST onwards.
Note: It is important to remember that GIFT Nifty’s correlation with global markets shifts slightly during Daylight Saving Time (DST). When the US and Europe move their clocks forward or backward, the “catalyst vacuum” or peak volatility periods may shift by one hour for Indian traders. For instance, while the US market usually closes at 2:30 AM IST, this changes to 1:30 AM IST during the summer months. Always keep an eye on international clock changes to accurately predict when GIFT Nifty price action might slow down.
GIFT Nifty gets much of its momentum from global triggers, especially from the US stock market, European indices, central bank commentary, economic data, earnings announcements, oil prices, and geopolitical headlines.
Once Wall Street closes, if no major economic events or breaking news emerge, trading activity often drops sharply. You can witness this after 1:30 AM IST as the US markets close.
Without a fresh trigger, buyers and sellers may both step back, causing GIFT Nifty to move in an extremely narrow range or just STOP.
To a trader staring at the chart, this can look like the market has completely stopped.
In reality, the market is open – but waiting for its next reason to move.
4. It Could Be a Market Holiday
The first and most common reason GIFT Nifty is not moving is simple – the exchange may be closed.
GIFT Nifty trades on the NSE International Exchange, and this exchange follows its own trading calendar.
Many traders assume that if India’s domestic market is open, GIFT Nifty must also be trading. That assumption can create confusion because the international exchange may observe a different holiday schedule depending on exchange regulations or settlement requirements.
Since it is based in GIFT City (an IFSC – International Financial Services Centre), it sometimes remains open on domestic Indian holidays if international markets are active.
If the exchange is closed, prices will remain frozen until the next trading session officially begins.
You should always check the exchange calendar before assuming something is wrong with the market.
5. The Problem Might Be Your Platform, Not the Market
Sometimes the market is moving – but your screen is not.
This happens more often than traders realize.
Broker terminals, third-party trading apps, and even popular charting platforms like TradingView occasionally experience data feed delays, symbol mapping errors, or refresh glitches.
Trader communities have also reported cases where GIFT Nifty values appeared different across brokers, charting platforms, and data providers due to session resets or delayed feeds.
So if your chart looks frozen, the safest move is to verify the price from the official exchange source rather than relying on a single platform.
A frozen chart does not always mean a frozen market.
Sometimes it simply means your data feed is lagging behind reality.
Where Should You Check the Real GIFT Nifty Price?
The best place to verify live prices is the official exchange website. Since the NSE International Exchange is the primary exchange where GIFT Nifty trades, it is the most reliable source for real-time data.
This article is written for informational purposes only. Do not consider it as any kind of investment or trading advice. Investing money in the stock market carries risk, so before making any financial decision, always consult a professional advisor. The author is not a SEBI-registered investment advisor. The author or platform will not be responsible for any profit or loss. This platform, in compliance with the Right to Freedom of Speech and Expression granted under Article 19(1)(a) of the Constitution of India, only functions to further share publicly available company news and filings. Full care has been taken for accuracy, but complete accuracy cannot be guaranteed. For credibility, do make sure to check the original documents issued by the company, the link to which has been provided in the article.
With over 3 years of experience in financial markets, we focus on simplifying global and Indian markets through clear, practical insights. Our expertise also extends to the evolving landscape of digital finance, including blockchain, stablecoins, and decentralized finance (DeFi).