
4 Simple Steps to Start Paper Trading in TradingView in 2025

5 Simple Steps to Start Paper Trading in TradingView in 2025

If you are someone who wants to learn trading without using real money, then paper trading is the perfect choice for you.

TradingView is one of the best platforms available in 2025 for paper trading. It gives you live charts, technical tools, and a demo account to practice trading safely.

In this article, you will learn how to start paper trading in TradingView in just 4 simple steps. We will also cover how you can practice Bitcoin trading in TradingView.

What is Paper Trading?

Paper trading means practicing trading with virtual money. You can buy and sell stocks, cryptocurrencies, or forex without risking your real cash. It works just like real trading, but all the profits and losses are fake.

This is a great way to learn how the market works and test your strategies.

Also Read – What is the difference between ICT and SMC?


Step-by-Step Guide to Start Paper Trading in TradingView

Step 1: Create a Free TradingView Account

To get started, visit tradingview.com and sign up with your email ID.

You can also use your Google, Apple, X or Facebook account to create an account.

Once you verify your email, your free TradingView account will be ready.

TradingView homepage after creating an account

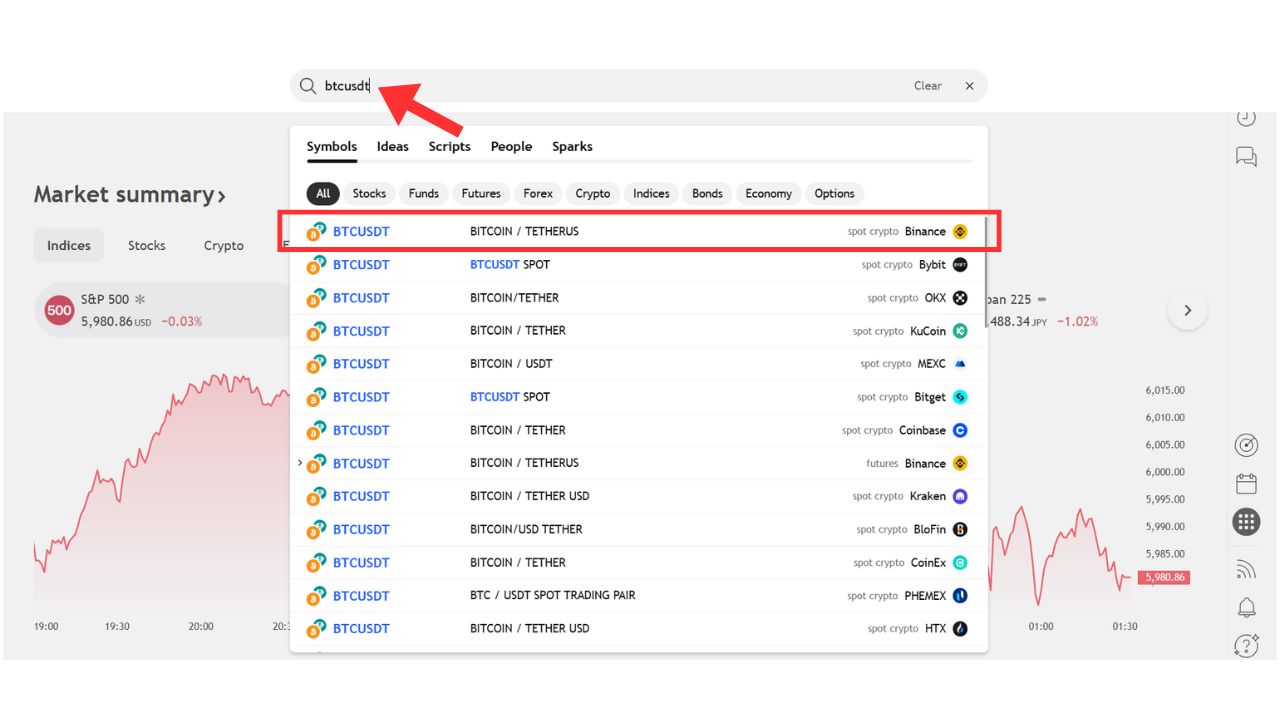
Step 2: Use the search bar to open a chart for the asset you want to trade.

After logging in, go to the search bar at the top of the screen. Type the name or symbol of the stock or cryptocurrency you want to practice trading.

For example, if you want to do paper trading in Bitcoin, type BTCUSDT, select the one from the Binance exchange, and launch the chart.

BTCUSDT Search Result on TradingView

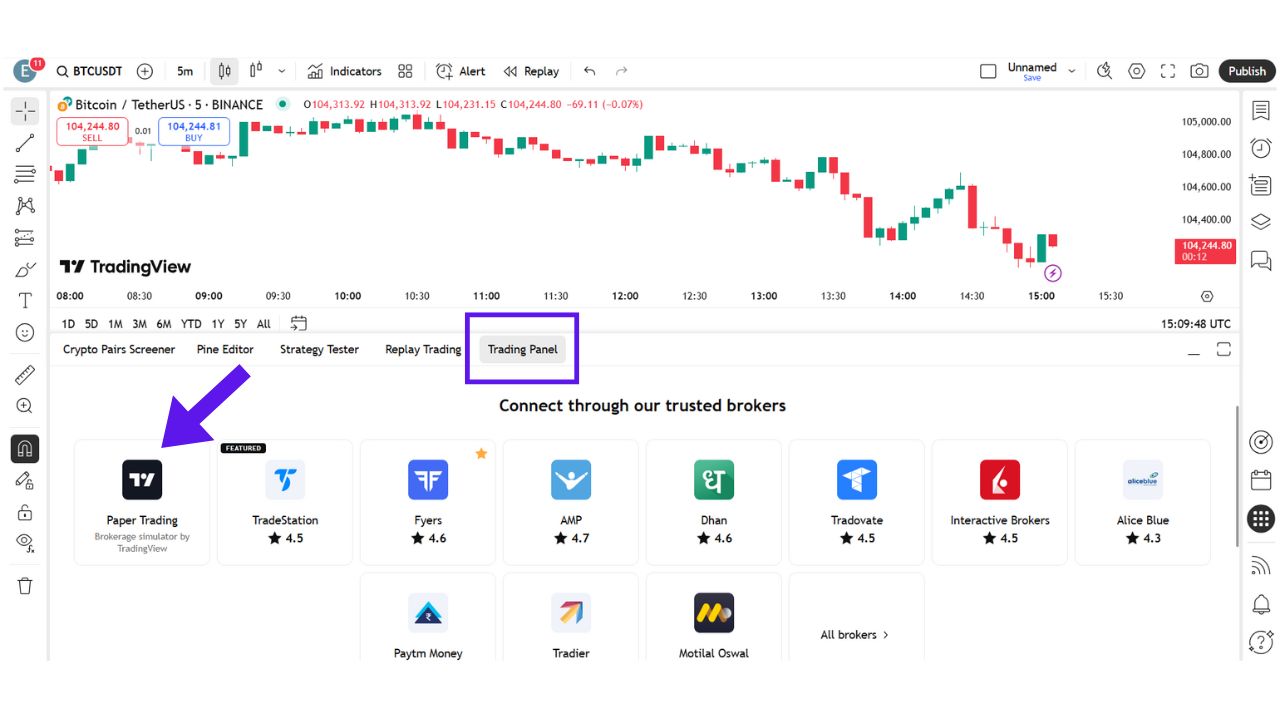
Step 3: Go to the trading panel below and connect to Paper Trading.

Go to the trading panel and connect to Paper Trading.

At the bottom of the chart screen, click on the “Trading Panel” tab.

You will see a few broker options. Find the one that says “Paper Trading – Brokerage simulator by TradingView” and click “Connect.”

Your paper trading account will now be active, and you will receive virtual money to practice with. Normally, TradingView gives $100,000 in fake funds for practice, but you can adjust this amount based on your needs.

Step 4: Place Your First Trade

Once your account is connected, you can place a trade.

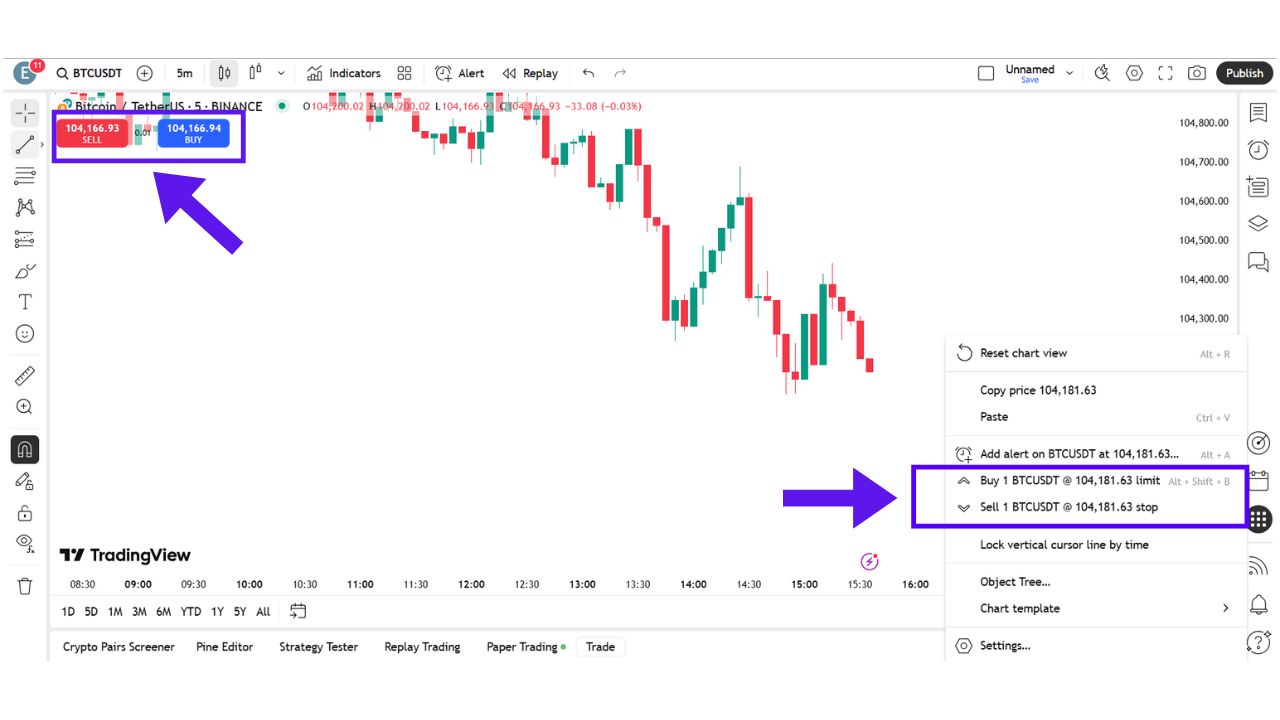
Just right-click on the chart at the price where you want to buy or sell. Choose “Buy” or “Sell,” then adjust the Buy/Sell price to your desired level. You can choose the order type as either a Limit Order or a Stop Order.

After that, click on the Buy or Sell button. Your first trade is now live using virtual money.

You can also use the red and green buttons on the top left corner of the chart for Sell and Buy orders respectively. Adjust the trade parameters within that window and click “Order.”

At the bottom of the screen under “Paper Trading,” you’ll find tabs like “Positions,” “Orders,” and “History.” These tabs show your open trades, profits or losses, balance, and order history.

You can close trades from here as well, and review your past trades to see what worked and what didn’t.

Also Read – Grok 3 for Trading Strategy-A Game Changer for Traders

Please watch the video here if you’d like a visual guide –

Why Paper Trading is Helpful?

TradingView allows you to experience real-time price movements without using real money. You can use all the technical tools available on the platform and test your strategies.

This helps build confidence before you move to live trading. It also helps you understand how orders, stop-loss, and take-profit work in a real market situation.

The Bottom Line

Paper trading is the safest and smartest way to start your trading journey. TradingView makes it super easy for anyone to practice. Whether it is stocks, forex, or cryptocurrencies like Bitcoin, you can test everything without any risk. Just follow the steps explained in this article and you’ll be ready to trade like a pro – with zero risk. Practice regularly and you’ll gain the confidence you need for live trading.

This article is for educational purposes only. Trading in financial markets involves risks. Please learn properly and consult an expert before investing real money.

Is Robinhood Markets Approaching an All-Time High?

Balkrishna Industries Limited – stock latest audited financial results news

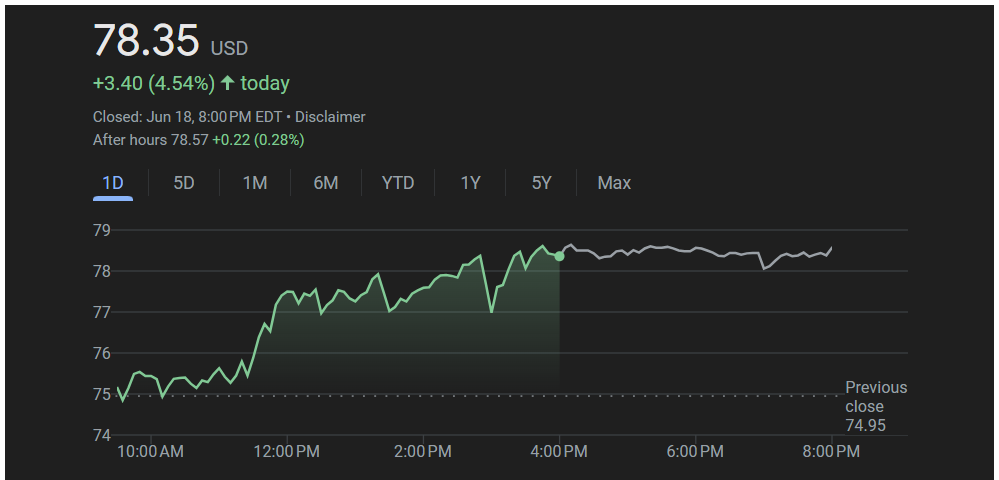
Robinhood Markets Inc. (NASDAQ: HOOD) saw a notable upward move on Tuesday, June 18, 2025, with its stock closing at $78.35, up by $3.40 or 4.54% from the previous session’s close of $74.95.

The day’s range was between $74.54 and $78.74, just shy of its 52-week and all-time high of $78.74. The stock opened the session at $75.17, indicating strong early buying interest.

After-hours trading continued the bullish sentiment, with the stock adding another 0.28% to reach $78.57.

Robinhood Markets Inc. (NASDAQ: HOOD) stock price chart

The rally was further supported by the news that Christopher Payne, a newly appointed director, purchased 26,500 shares of Robinhood. The move, first reported by Barron’s, is being seen as a vote of confidence in the company’s long-term strategy and current valuation.

Technically, the stock has broken through a crucial resistance zone between $76 and $78 with a strong green candle, suggesting bullish momentum. Analysts expect that if this momentum continues, the stock could test the psychological and technical resistance near its all-time high of $85.

On the downside, support is seen between $67 to $65, where prior consolidation occurred.

Also Read – Understanding the Basics of Buying, Selling, and Stop Hunting in Financial Markets

Robinhood has been one of the standout performers of 2025. Here’s how it has fared across various timeframes:

  • 5-day return: +6.56%
  • 1-month return: +30.90%
  • 6-month return: +123.16%
  • Year-to-date return: +103.30%
  • 1-year return: +256.62%
  • All-time return: +106.18%

As of June 20, 2025, Robinhood’s market capitalization stands at $69.142 billion. The company has a trailing twelve-month (TTM) revenue of $3.2601 billion and net income of $1.58 billion. With 882.48 million shares outstanding, the earnings per share (EPS) sits at $1.7501. The stock has a current P/E ratio of 44.90 and a forward P/E of 63.33. The beta is 2.26, indicating higher volatility compared to the broader market.

The next earnings report is expected on August 6, 2025, which could serve as the next major catalyst for the stock.

From a strategic perspective, Robinhood has benefited from increased retail trading activity and interest in alternative investments. Its expansion into crypto trading and future plans for introducing retirement accounts and credit card products are expected to further diversify revenue streams.

In conclusion, Robinhood’s recent breakout and strong price action point toward continued bullish sentiment. The stock is nearing critical resistance, and if it sustains momentum, a new all-time high could be within reach. Investors will be closely watching for further institutional activity and upcoming earnings to gauge long-term growth potential.

This article is for informational purposes only and should not be considered financial advice. Investing in stocks, cryptocurrencies, or other assets involves risks, including the potential loss of principal. Always conduct your own research or consult a qualified financial advisor before making investment decisions. The author and publisher are not responsible for any financial losses incurred from actions based on this article. While efforts have been made to ensure accuracy, economic data and market conditions can change rapidly. The author and publisher do not guarantee the completeness or accuracy of the information and are not liable for any errors or omissions. Always verify data with primary sources before making decisions.

Alphabet Inc. (NASDAQ: GOOG) Shares Dipped 1.83% Despite Stable Tech Sentiment

StubHub’s unfolding legal crisis is a reminder that IPO investing comes with risk and that the details buried in offering documents can make or break investment decisions. Whether the company misled investors will now be determined through multiple investigations and potential class actions.

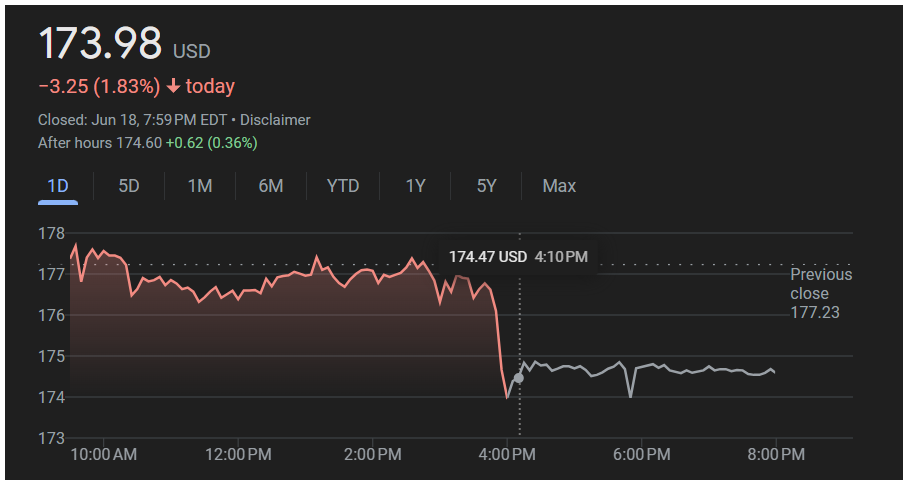
Alphabet Inc. (NASDAQ: GOOG), the parent company of Google, witnessed a slight pullback in its stock price on Tuesday, June 18, 2025. The stock closed at $173.98, down $3.25 or 1.83% from the previous session’s close of $177.23.

The downward move comes after a relatively steady trading session where the stock opened at $177.28 and traded within a narrow range of $172.84 to $177.82. After-hours trading offered a mild recovery as the stock edged up to $174.60, showing a gain of $0.62 or 0.36%.

Alphabet Inc. (NASDAQ: GOOG) price chart

Technical analysts suggest that Alphabet’s stock may dip further during trading on June 19. The stock appears to be approaching a confluence of trendline support between the $170 to $169 price range. This area may act as a critical zone, where buying interest could emerge. A failure to hold above this support level might attract short-term selling, while a bounce from here could provide a favorable technical setup for bullish traders.

As of the latest data, Alphabet holds a market capitalization of $2.11 trillion, reaffirming its position as one of the world’s most valuable technology companies. The stock trades at a trailing twelve-month P/E ratio of 19.71. Alphabet also provides a modest dividend yield of 0.48%, with a recent quarterly dividend of $0.21 per share.

Also Read – CRCL Stock Soars Over 33% as Stablecoin Market Cap Hits $252 Billion After Genius Act Passage

Returns across different timeframes show a mixed picture. The stock is down 1.49% over the past day and 1.62% over the past five trading sessions. Over the past month, Alphabet has gained 5.36%, though it has dropped 6.71% over the last six months. Year to date, the stock is down 9.09%, and over the last 12 months, it has declined 2.16%. However, over a five-year period, the stock has generated a strong return of 139.09%. Since inception, Alphabet has delivered a total return of 6,830%.

On the regulatory front, recent news may have a positive long-term impact. On Friday, June 13, 2025, Mexico’s antitrust authority, Cofeco, officially closed its multi-year antitrust investigation into Alphabet. The announcement, as reported by Insider Monkey, removes a lingering regulatory overhang for the company and may gradually restore investor confidence.

In terms of business strategy, Alphabet continues to focus on artificial intelligence, quantum computing, and cloud infrastructure. The Google Cloud segment has been steadily growing and is expected to be a key contributor in future earnings. YouTube’s monetization performance and the company’s evolving advertising model will also be key areas of focus in the next earnings cycle.

Overall, while the short-term trend shows a minor pullback, Alphabet’s long-term fundamentals remain strong. Market participants will keep a close watch on technical support zones and upcoming earnings announcements to determine the next direction for the stock.

This article is for informational purposes only and should not be considered financial advice. Investing in stocks, cryptocurrencies, or other assets involves risks, including the potential loss of principal. Always conduct your own research or consult a qualified financial advisor before making investment decisions. The author and publisher are not responsible for any financial losses incurred from actions based on this article. While efforts have been made to ensure accuracy, economic data and market conditions can change rapidly. The author and publisher do not guarantee the completeness or accuracy of the information and are not liable for any errors or omissions. Always verify data with primary sources before making decisions.

Visa Inc. Stock Falls Over 4.8% Amid Market Pressure and Sector Concerns

Balkrishna Industries Limited – stock latest audited financial results news

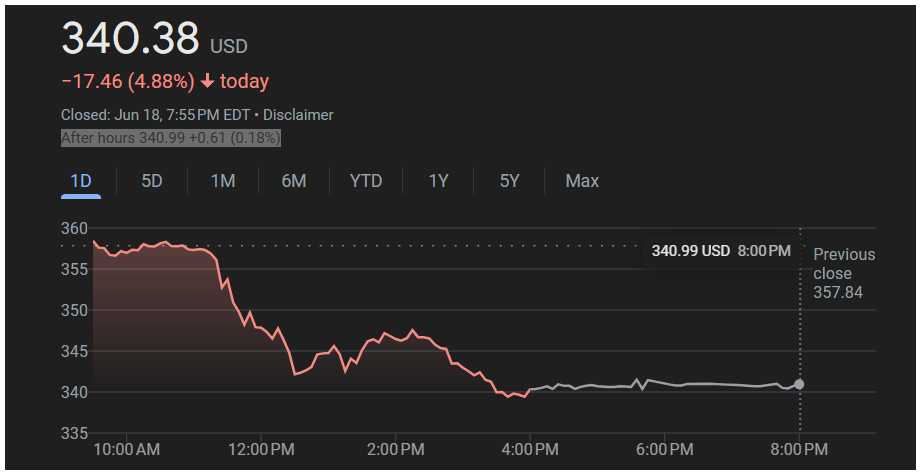
On Tuesday, June 18, 2025, Visa Inc. (NYSE: V) experienced a sharp drop in its share price, closing at $340.38, down by $17.46 or -4.88% from the previous trading day. The drop came despite a relatively stable market backdrop, suggesting possible sector-specific pressures or investor reaction to broader financial trends.

Visa shares opened the session at $357.84 and struggled throughout the day, ultimately failing to hold on to any significant gains. With a trading volume of nearly 15 million shares, the stock faced increased selling pressure compared to its average daily volume. The company’s current market capitalization stands at approximately $664.93 billion.

Visa Inc. stock chart

Before the market opened on Thursday, June 19, 2025, Visa’s stock slightly recovered and was last seen trading at $340.99, up $0.61 or 0.18% in the pre-market session.

As per the latest data from Yahoo Finance, Visa’s price-to-earnings (P/E) ratio stands at 34.24, and the company’s earnings per share (EPS) for the trailing twelve months is 9.94. These metrics reflect the market’s continued confidence in Visa’s profitability and growth prospects.

Financial results for the quarter ended March 31 revealed that the company generated $9.59 billion in revenue and reported a net profit of $4.58 billion. This compares to the previous year’s quarterly results of $8.78 billion in revenue and a net profit of $4.66 billion, indicating year-over-year revenue growth despite a slight dip in net profit.

Investors are paying close attention to consumer spending trends, payment volume growth, and interest rate shifts, which heavily influence the valuation of companies in the financial services sector. Visa, being one of the world’s leading payment technology companies, is not immune to these market dynamics. A shift in consumer behavior, inflationary pressures, or tightening monetary policy could be contributing to the recent dip.

Year-to-date, Visa is still up around 22.96%, reflecting strong gains earlier in the year. However, the recent fall has slightly dented its performance and prompted analysts and traders to reassess near-term expectations.

Some analysts believe this drop may be temporary and see it as a potential buying opportunity, citing Visa’s strong fundamentals, broad global network, and consistent earnings performance. The stock’s 52-week range remains between $252.70 and $428.06, highlighting the substantial rally the stock has seen over the past year.

In recent news, Visa has been expanding its presence in digital payments and cross-border payment systems. The company is also actively exploring partnerships in the crypto and fintech space to remain at the forefront of innovation.

Looking ahead, investors will be watching for Visa’s next earnings report and any management commentary on consumer trends, macroeconomic outlook, and global transaction volumes. Until then, short-term volatility may persist, but the long-term outlook remains constructive for the company given its dominant market position and strong financials.

This article is for informational purposes only and should not be considered financial advice. Investing in stocks, cryptocurrencies, or other assets involves risks, including the potential loss of principal. Always conduct your own research or consult a qualified financial advisor before making investment decisions. The author and publisher are not responsible for any financial losses incurred from actions based on this article. While efforts have been made to ensure accuracy, economic data and market conditions can change rapidly. The author and publisher do not guarantee the completeness or accuracy of the information and are not liable for any errors or omissions. Always verify data with primary sources before making decisions.

Coinbase Soars Over 16% as Crypto Sentiment Improves

Centene Corporation stock latest news

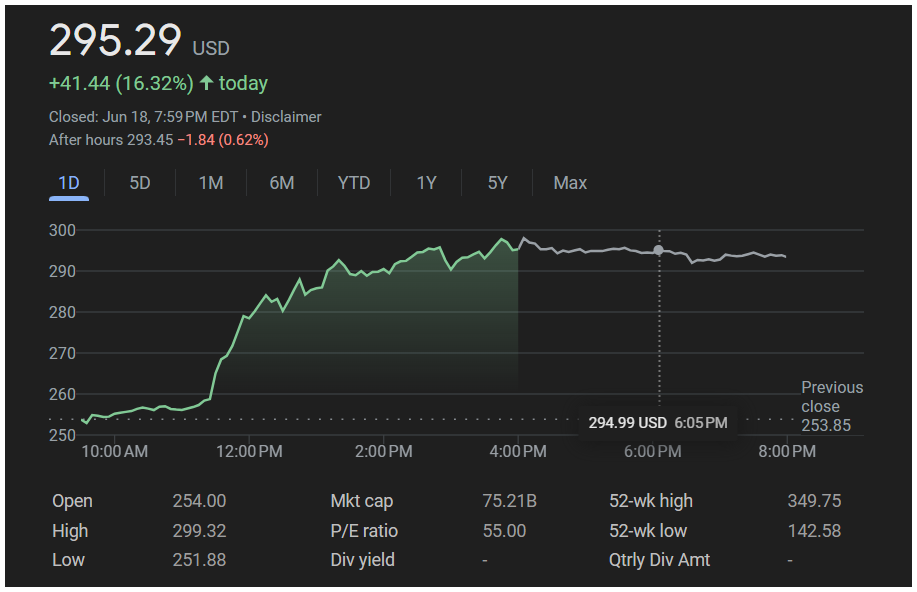
Coinbase Global, Inc. (NASDAQ: COIN) witnessed a strong rally as its stock surged by 16.32%, gaining $41.44 to close at $295.29. The trading volume reached 36.81 million shares, significantly higher than its average, showing rising investor interest.

COIN stock chart

This sudden upward movement came amid a broader uptick in sentiment across the cryptocurrency space.

Investors are beginning to price in a possible comeback in crypto activity driven by upcoming U.S. regulations and institutional demand.

Coinbase’s market capitalization stood at $75.21 billion, making it one of the biggest gainers in the technology and finance segments. Its trailing twelve-month performance is now up by over 25.64%, with analysts starting to revise their target prices upward based on rising trading activity on the platform.

A big driver behind the optimism is the recent surge in user sign-ups and volume, especially after regulatory clarity began emerging around digital asset classification in the U.S. Additionally, the SEC’s softened stance on some crypto-related matters gave retail and institutional investors a reason to be more confident in entering the space.

The short interest on the stock has also declined in recent weeks, suggesting that bearish bets are cooling off. In the latest earnings report, Coinbase had already exceeded revenue expectations, which further cemented investor belief in the stock’s growth trajectory.

Looking ahead, analysts are cautiously optimistic. If crypto adoption continues rising and regulations remain supportive, Coinbase could benefit from sustained volume and increased transaction-based revenue.

Technically, the stock has broken out of a consolidation range and may face minor resistance near the $300 mark. However, strong buying momentum may help it break past that as well. The relative strength index (RSI) suggests the stock is nearing overbought levels, but traders seem more focused on momentum and fundamental catalysts for now.

With the overall mood in crypto turning positive and Coinbase standing at the center of this trend, the company is well-positioned to benefit from any further expansion in the market. Investors should watch upcoming crypto legislation developments and quarterly user activity for further signals on where COIN might head next.

This article is for informational purposes only and should not be considered financial advice. Investing in stocks, cryptocurrencies, or other assets involves risks, including the potential loss of principal. Always conduct your own research or consult a qualified financial advisor before making investment decisions. The author and publisher are not responsible for any financial losses incurred from actions based on this article. While efforts have been made to ensure accuracy, economic data and market conditions can change rapidly. The author and publisher do not guarantee the completeness or accuracy of the information and are not liable for any errors or omissions. Always verify data with primary sources before making decisions.

CRCL Stock Soars Over 33% as Stablecoin Market Cap Hits $252 Billion After Genius Act Passage

The Shipping Corporation of India Limited – stock latest AUDITED FINANCIAL RESULTS news

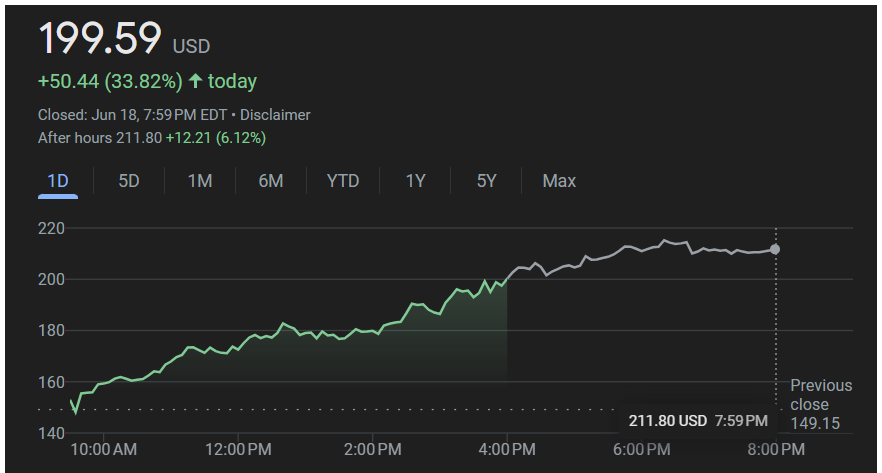
On Wednesday, Circle Internet Group Inc (NYSE: CRCL), the parent company behind the USDC stablecoin, saw its stock skyrocket by 33.82%, closing at $199.59, up $50.44 from the previous close of $149.15. The rally continued into after-hours trading, with the stock hitting $211.80, marking another 6.12% gain and sending bullish signals across the crypto finance sector.

This surge came shortly after the U.S. Senate passed the Genius Act, a new federal framework regulating stablecoins like USDC. The bill is being seen as a landmark victory for the crypto industry, offering long-awaited clarity for institutions and investors interested in dollar-backed digital assets.

Stablecoin Market Cap Hits $252 Billion

The passing of the Genius Act has pushed the total market cap of stablecoins to $252 billion, as investors welcomed the legal clarity and legitimacy the new regulation brings. USDC, Circle’s flagship stablecoin, plays a major role in this market.

With Circle’s direct exposure to this growing ecosystem, the company’s valuation has jumped to $48 billion, reflecting heightened investor confidence.


Stock Performance Snapshot

crcl price chart google
Time PeriodReturn
1 Day+33.82%
5 Days+70.90%
All Time+189.26%

The day’s price action was notable. CRCL opened at $153.22, hit a low of $148.00, and rallied to an intraday high of $200.90 — a new 52-week high. The stock then settled at $199.59 and surged again in after-hours trading.

Company Overview

DetailInfo
NameCircle Internet Group Inc
TickerNYSE: CRCL
Founded2013
FounderJeremy Allaire, Sean Neville
SectorFinancial Technology
IndustryBlockchain & Digital Payments
HeadquartersBoston, Massachusetts, U.S.

Fundamentals

MetricValue
Market Cap$48 Billion
P/E Ratio (TTM)2,494.8802
EPS (TTM)$0.0801
52-Week High$200.90
52-Week Low$64.00

Technical Outlook

On the charts, CRCL stock broke a strong resistance level of $165.60 with a large bullish candle on Tuesday. The momentum continued Wednesday with strong volume and pre-market gap-up to $211.80. This price action confirms a strong uptrend, and unless there is major selling pressure, the rally may continue toward the next resistance zone of $225–$230.

Key support levels now rest at $170 and $165, which may act as buying zones if the stock sees any pullback.


Final Thoughts

CRCL is currently riding a powerful wave of regulatory clarity and investor sentiment, backed by its direct link to the exploding stablecoin market. With USDC adoption likely to grow further, and institutional interest expected to rise, Circle’s stock may continue to gain momentum in the short to medium term.

Investors are now closely watching Circle’s performance ahead of its next earnings date on August 13, 2025, and how it capitalizes on this policy-driven tailwind.


This article is for informational purposes only and should not be considered financial advice. Investing in stocks, cryptocurrencies, or other assets involves risks, including the potential loss of principal. Always conduct your own research or consult a qualified financial advisor before making investment decisions. The author and publisher are not responsible for any financial losses incurred from actions based on this article. While efforts have been made to ensure accuracy, economic data and market conditions can change rapidly. The author and publisher do not guarantee the completeness or accuracy of the information and are not liable for any errors or omissions. Always verify data with primary sources before making decisions.

CRCL Stock Jumps Nearly 16% as Senate Passes Stablecoin Bill

JPMorgan Chase Launches Auto-Callable Notes Tied to Tech and Small-Cap Performance

Shares of Circle Internet Group Inc. (NYSE: CRCL) surged on June 18, 2025, after the U.S. Senate passed a historic bill to regulate stablecoins. CRCL jumped 14.65% to trade at $171.00 by 11:49 a.m. ET, marking a $21.85 gain from its previous close of $149.15. The stock touched an intraday high of $174.82 and a low of $148.00.

This sharp upward move comes as the Senate passed a bill establishing the first federal framework for dollar-backed cryptocurrencies, also known as stablecoins. The crypto industry has been lobbying for clear, favorable regulation for years, and this development is being celebrated as a major breakthrough.

Circle, the issuer of the USDC stablecoin, is one of the biggest players in this space and is expected to benefit significantly from this new legal clarity.

Stock Performance Snapshot

CRCL trading view price chart

CRCL has shown impressive momentum in recent sessions:

  • 1 Day: +15.97%
  • 5 Days: +48.10%
  • All Time: +150.67%

Today’s rally not only puts CRCL near its 52-week high of $174.82, but also adds to the bullish trend that has been forming over the past week. Circle’s market capitalization currently stands at $37.78 billion, reflecting growing investor confidence in the company’s position within the digital asset ecosystem.

Also Read – Circle Internet Financial Stock Price Prediction, Forecast & Target for 2025, 2030, 2040 & 2050

Company Overview

Here is a quick overview of Circle Internet Group Inc.:

DetailInformation
Company NameCircle Internet Group Inc.
TickerCRCL (NYSE)
Founded2013
FounderJeremy Allaire
SectorTechnology
IndustryFinancial Technology / Cryptocurrency
HeadquartersBoston, Massachusetts, United States
Market Cap$37.78 Billion
52-Week High$174.82
52-Week Low$64.00

Why This Matters?

The passage of the stablecoin bill gives the crypto sector, especially regulated players like Circle, the regulatory clarity it has long needed to scale operations in the U.S. and globally. USDC is already one of the largest dollar-backed stablecoins by circulation, and Circle has made strategic moves in recent months to boost adoption by partnering with financial institutions and expanding into new jurisdictions.

Investors are hopeful that this legislation will encourage wider institutional use of stablecoins, boost on-chain dollar usage, and lead to greater acceptance of digital assets by traditional finance. With Circle directly tied to the success of USDC, the company is seen as one of the biggest beneficiaries of this legal shift.

This article is for informational purposes only and should not be considered financial advice. Investing in stocks, cryptocurrencies, or other assets involves risks, including the potential loss of principal. Always conduct your own research or consult a qualified financial advisor before making investment decisions. The author and publisher are not responsible for any financial losses incurred from actions based on this article. While efforts have been made to ensure accuracy, economic data and market conditions can change rapidly. The author and publisher do not guarantee the completeness or accuracy of the information and are not liable for any errors or omissions. Always verify data with primary sources before making decisions.

TMC Stock Soars Over 28% Following Key Board Appointments

Balkrishna Industries Limited – stock latest audited financial results news

On June 18, 2025, shares of The Metals Company (NASDAQ: TMC) surged sharply, gaining 28.58% to close at $7.15, up from the previous day’s close of $5.44. The stock saw a strong uptrend during early market hours and maintained momentum through the trading session, driven by positive sentiment around leadership changes.

The spike in TMC’s share price follows the company’s announcement of two high-profile board appointments. On June 17, 2025, TMC confirmed the addition of Michael Hess and Alex Spiro to its Board of Directors. This move is seen as a strategic step, adding experienced voices to the company’s decision-making process at a time when TMC is navigating rapid growth and preparing for key milestones.

According to the latest market data, TMC’s market capitalization now stands at $2.53 billion. The company reported earnings per share (EPS) of $0.23 on a trailing twelve-month (TTM) basis, and it is scheduled to report its next earnings on August 13, 2025.

Also Read – JPMorgan Dips 0.31% Ahead of Chase Sapphire Reserve Fee Increase

Stock Performance Overview

tmc trading view chart

TMC’s performance over various timeframes shows just how strong the stock’s rally has been in recent months:

  • 5 Days: +61.74%
  • 1 Month: +91.60%
  • 6 Months: +852.74%
  • Year to Date: +510.09%
  • 1 Year: +351.62%
  • All Time: -30.45%

Despite being down 30.45% from its all-time high, the stock has made a remarkable comeback in 2025. In just the last six months, it has skyrocketed by over 850%, fueled by growing interest in deep-sea mining and strategic partnerships.

Market Sentiment and Outlook

Investor sentiment surrounding TMC has improved significantly. The latest board additions are being interpreted as a sign that the company is serious about scaling operations and addressing regulatory, legal, and environmental challenges more effectively.

TMC is also gaining attention in the broader clean energy and EV materials space, given its focus on extracting battery-grade metals from ocean nodules. This unique business model has attracted both institutional and retail interest, especially with the EV boom driving demand for sustainable metal sourcing.

All eyes are now on the upcoming earnings release in August, which will provide further insight into the company’s financial performance and progress on its operational goals. If earnings continue to support the growth narrative, TMC may maintain upward momentum in the coming months.


This article is for informational purposes only and should not be considered financial advice. Investing in stocks, cryptocurrencies, or other assets involves risks, including the potential loss of principal. Always conduct your own research or consult a qualified financial advisor before making investment decisions. The author and publisher are not responsible for any financial losses incurred from actions based on this article. While efforts have been made to ensure accuracy, economic data and market conditions can change rapidly. The author and publisher do not guarantee the completeness or accuracy of the information and are not liable for any errors or omissions. Always verify data with primary sources before making decisions.

Lear Corp Stock Slips Over 2% Following Insider Selling by Director

The Shipping Corporation of India Limited – stock latest AUDITED FINANCIAL RESULTS news

On Tuesday, June 18, 2025, Lear Corporation (NYSE: LEA) experienced a notable decline in its share price, closing at $90.65, down $1.93 or 2.08% from the previous close of $92.58. This dip comes after recent insider activity, which may have influenced short-term investor sentiment.

The insider transaction involved Director Conrad L. Mallett, Jr., who sold 1,187 shares of Lear stock on June 16, 2025, at an average price of $92.86, totaling $110,224.82, as disclosed in a U.S. Securities and Exchange Commission (SEC) filing. After the sale, Mallett retained only 84 shares, valued at approximately $7,800.24. While insider selling can result from various personal financial reasons, it has sparked concern among some investors, especially during a period of price weakness for the stock.

Also Read – Circle Stock Falls 3.5% Amid Market Volatility


Stock Performance Overview

LEA chart Trading View

Lear’s recent stock performance has been under pressure across multiple timeframes. The following breakdown shows its return across different periods:

Time PeriodReturn
5 Days-5.21%
1 Month-3.42%
6 Months-3.41%
Year to Date-4.58%
1 Year-21.64%
5 Years-18.24%
All Time+259.01%

The stock’s 1-year and 5-year losses of 21.64% and 18.24% respectively are significant, driven by macroeconomic pressures and softer revenue. However, its all-time return of +259.01% highlights Lear’s long-term ability to create value for investors.


Major News and Developments

Despite near-term struggles, Lear has delivered positive developments recently. In its Q1 2025 earnings (announced May 6), the company reported:

  • Adjusted EPS of $3.12 per share (vs. analyst estimate of $2.69)
  • Revenue of $5.56 billion, beating consensus by $180 million
  • Continued strength in both Seating and E-Systems segments

CEO Ray Scott noted that operating margins improved despite lower industry-wide vehicle production, reflecting operational discipline.

Analyst sentiment, while mixed, leans positive:

  • Bank of America raised its price target from $110 to $115, maintaining a “Buy” rating
  • JP Morgan increased its target to $120, rating the stock as “Overweight”
  • CFRA upgraded Lear to “Buy” with a $120 price target
  • GuruFocus estimates GF Value at $145.02, suggesting the stock is 53.33% undervalued

However, MarketBeat reports a consensus rating of “Hold” among 14 analysts (1 Sell, 8 Hold, 5 Buy), with an average target of $107.09.

At the Wells Fargo Industrials and Materials Conference (June 11), management expressed confidence in reinstating full-year guidance during the Q2 2025 earnings call (expected August 4). They projected:

  • Q2 revenue of $5.9 billion (above consensus of $5.73 billion)
  • Operating income between $260–$270 million
  • $25 million in stock repurchases planned

However, executives warned that 2027 may be a slow year due to global uncertainties and rising input costs.


Strategic and Insider Moves

Lear is strengthening its position in automotive tech, winning a 2025 Automotive News PACE Award for its Zone Control Module, an advanced vehicle electronics solution. A new China joint venture is expected to add $70 million in 2025 revenue, boosting its E-Systems segment.

Insider activity is mixed. While Mallett’s sale raised eyebrows, Director Rod Lache earlier bought 2,178 shares for $199,940 on March 5, reflecting internal confidence.

  • Insiders own 0.91% of Lear’s stock
  • Institutions hold 97.04%, showing strong backing from funds and investment firms

Market Outlook and Risks

Lear’s focus on electrification and advanced seating systems aligns with trends in the EV space. However, challenges such as:

  • Rising copper prices (hurting E-Systems margins)
  • Potential tariffs on global trade
  • And sluggish industry growth in coming years

…are key concerns flagged by analysts including John Murphy of Bank of America.

Still, Lear’s undervaluation, steady earnings, and strategic roadmap provide hope. If upcoming guidance in Q2 proves strong, it may trigger renewed momentum in the stock, especially for long-term investors.

This article is for informational purposes only and should not be considered financial advice. Investing in stocks, cryptocurrencies, or other assets involves risks, including the potential loss of principal. Always conduct your own research or consult a qualified financial advisor before making investment decisions. The author and publisher are not responsible for any financial losses incurred from actions based on this article. While efforts have been made to ensure accuracy, economic data and market conditions can change rapidly. The author and publisher do not guarantee the completeness or accuracy of the information and are not liable for any errors or omissions. Always verify data with primary sources before making decisions.

JPMorgan Dips 0.31% Ahead of Chase Sapphire Reserve Fee Increase

AMC Networks signs a new contract with Dan McDermott as Q3 earnings show revenue gains and ongoing profitability challenges.

JPMorgan Chase & Co. (NYSE: JPM) shares slipped 0.31% to $269.52 as of the latest trade, amid renewed investor attention sparked by a major update to one of its flagship financial products.

The price movement comes in the backdrop of a 162.87% return over the past five years, making JPMorgan one of the standout performers in the financial sector.

JP Morgan Chase Price Chart Trading View

On Tuesday, the banking giant announced a significant change to its premium credit card, the Chase Sapphire Reserve. Starting June 23, the card’s annual fee will rise sharply from $550 to $795. This move positions the Sapphire Reserve above rival premium cards like the American Express Platinum, which charges a $695 annual fee.

The change is expected to create mixed reactions among customers and investors. While some may be discouraged by the higher upfront cost, others may look forward to potential added benefits, which JPMorgan has hinted will be revealed in detail at the time of the hike.

The timing of the announcement comes during a relatively stable performance phase for JPMorgan stock. Although the daily change was a minor dip, the broader picture remains strong. Over the last year, the stock is up 39.30%, and it has gained 11.87% year-to-date. The all-time performance stands at 2,720%.

JPMorgan Chase & Co. is one of the largest and most influential financial institutions in the world. Headquartered in New York, it offers a wide range of services including investment banking, asset management, commercial banking, and credit cards. The firm’s strong brand reputation, innovative financial products like the Sapphire Reserve, and robust earnings history have helped it maintain a leadership position in the global banking sector.

Key Trading Data

MetricValue
1 Month Return0.76%
6 Month Return16.04%
Year-to-Date Return11.87%
1 Year Return39.30%
5 Year Return162.87%
All-Time Return2,720%

This article is for informational purposes only and should not be considered financial advice. Investing in stocks, cryptocurrencies, or other assets involves risks, including the potential loss of principal. Always conduct your own research or consult a qualified financial advisor before making investment decisions. The author and publisher are not responsible for any financial losses incurred from actions based on this article. While efforts have been made to ensure accuracy, economic data and market conditions can change rapidly. The author and publisher do not guarantee the completeness or accuracy of the information and are not liable for any errors or omissions. Always verify data with primary sources before making decisions.