
RTX Stock Climbs 1.38% in a Day, 5-Year Return Surges Over 118%

JPMorgan Chase Launches Auto-Callable Notes Tied to Tech and Small-Cap Performance

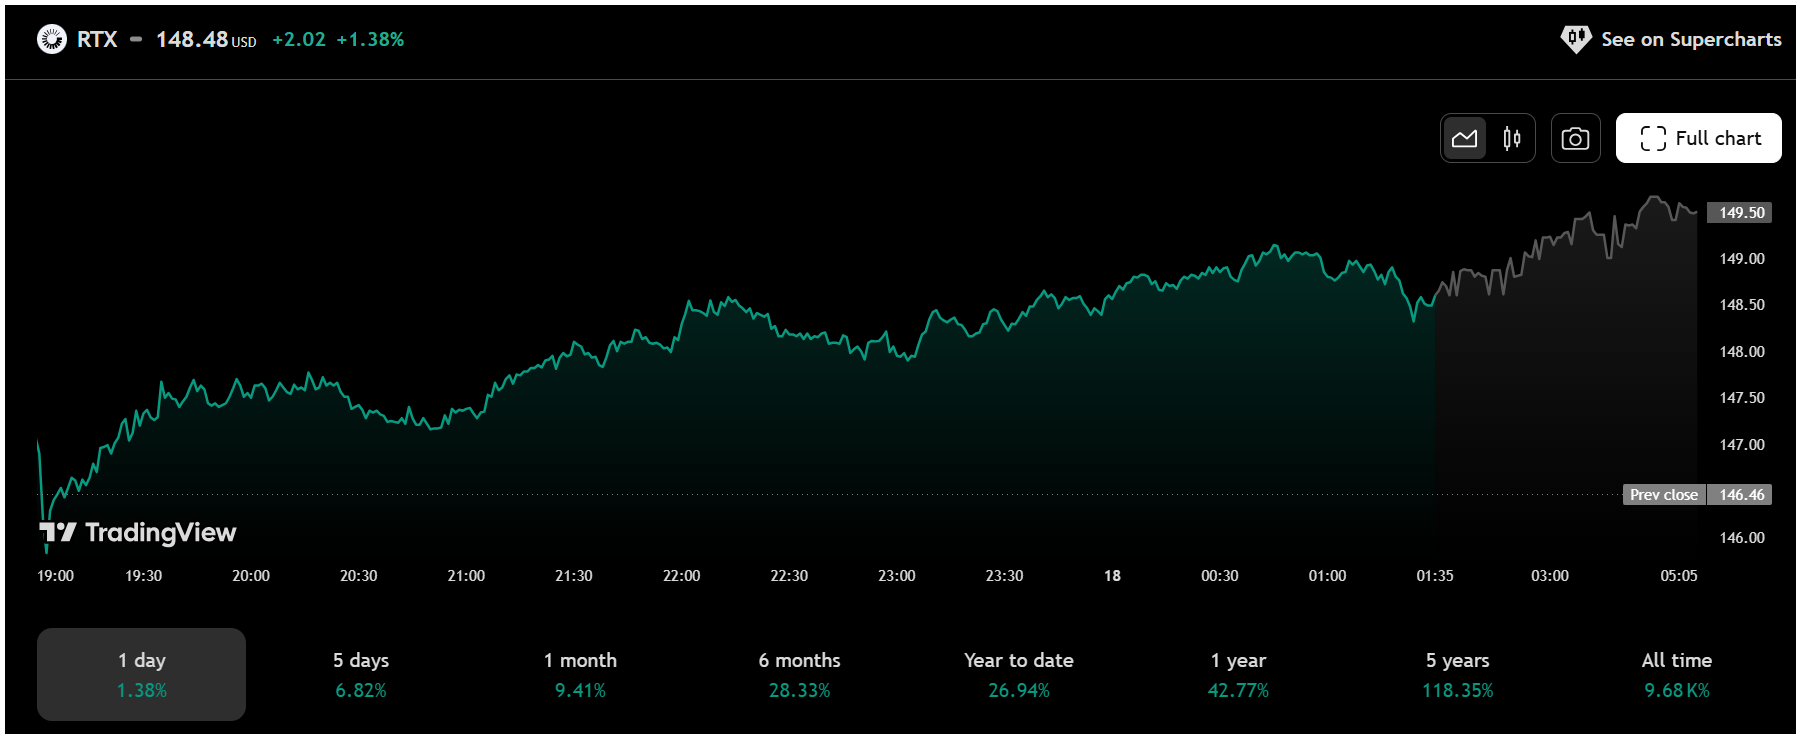
Shares of RTX Corporation (NYSE: RTX) rose by 1.38% to $148.48, adding $2.02 in a single day of trade. While short-term gains grabbed headlines, long-term investors are taking notice of something far more impressive: RTX has delivered a stellar 118.35% return over the past five years.

RTX Stock Performance Trading View

This strong 5-year performance signals consistent value creation in the defense and aerospace sector. From legacy operations under Raytheon Technologies to a refined post-merger strategy under the RTX brand, the company has steadily expanded its business, boosted innovation, and maintained strong earnings despite global uncertainty.

Over the past six months alone, the stock has risen 28.33%, while it has climbed 26.94% year-to-date. In the past one month, RTX has returned 9.41%, with a 6.82% gain in the past five trading sessions. Its one-year return stands at an impressive 42.77%, further reinforcing investor confidence.

RTX Corporation, formerly known as Raytheon Technologies, is a major American aerospace and defense company. Headquartered in Arlington, Virginia, it operates through three main segments: Collins Aerospace, Pratt & Whitney, and Raytheon. The company provides advanced systems and services for commercial and military customers globally. RTX is one of the largest defense contractors in the world, known for producing high-tech missiles, sensors, aircraft engines, and avionics systems.

Analysts say RTX’s long-term uptrend is supported by robust defense contracts, steady cash flows, and rising demand for aerospace and military technology. In addition, a global geopolitical environment that continues to prioritize defense spending has helped drive sentiment around the stock.

Yesterday’s rise is a continuation of its recent bullish pattern, following strong buying momentum seen across the broader sector. If this trend continues, RTX may test new highs over the coming quarters.

However, market watchers recommend keeping an eye on macroeconomic risks, such as interest rate decisions and global tensions, which could affect near-term volatility.

Recent Developments Bolster RTX’s Outlook

RTX Corporation continues to strengthen its position in the defense and aerospace sectors with significant contract wins and strategic advancements. On June 18, 2025, RTX secured a $299.69 million contract modification for missile testing equipment and spares, reinforcing its critical role in U.S. defense programs. Earlier in June, Raytheon, an RTX business, was awarded a $1.1 billion U.S. Navy contract to produce AIM-9X Block II missiles and a $646 million contract for SPY-6 radar production, highlighting sustained demand for its advanced missile and radar systems.

Additionally, RTX’s Collins Aerospace expanded its aircraft electrification capabilities with a new engineering center in the UK and a production line in France, announced on June 9, 2025, aligning with the industry’s push toward sustainable aviation. Pratt & Whitney, another RTX division, secured a contract on June 16, 2025, to supply TJ150 engines for Leidos’ Small Cruise Missile program, further diversifying its propulsion portfolio.

Despite a U.S. Department of Justice mandate requiring Safran to divest its North American actuation business as part of a $1.8 billion acquisition from Collins Aerospace, announced on June 17, 2025, RTX’s diversified backlog of $92 billion as of Q1 2025 supports long-term revenue stability.

Financial Disclaimer: This article is for informational purposes only and should not be considered as financial advice. Investing in the stock market involves risk. Readers are advised to do their own research or consult with a professional before making any investment decisions.

Circle Stock Falls 3.5% Amid Market Volatility

Centene Corporation stock latest news

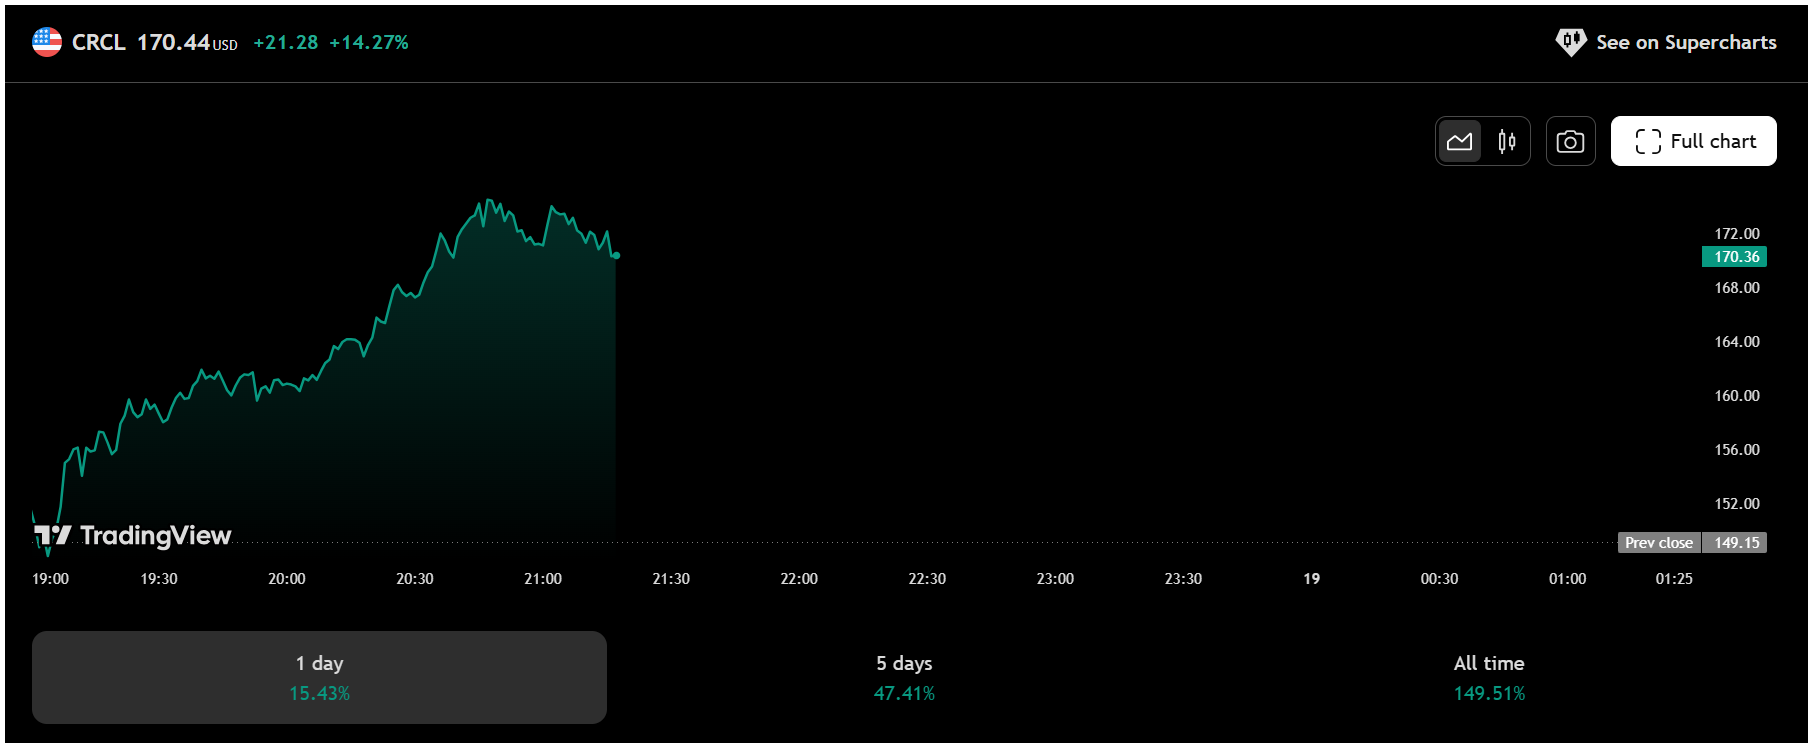
Shares of Circle Internet Group, Inc. (NYSE: CRCL), the company behind the USDC stablecoin, fell by 3.5 percent to close at 145.54 dollars by 3:26 PM ET. This drop comes after a highly volatile week for the newly listed company. Circle’s stock had earlier reached a high of 165.60 dollars on June 16 but settled at 151.06 dollars by the end of that day. The company’s current market valuation stands at around 33.6 billion dollars.

Despite the recent dip, the stock has climbed an impressive 434 percent since its initial public offering on June 5, 2025. The current pullback appears to be a case of investors booking profits following the strong rally, combined with broader market concerns.

Circle’s journey post-IPO has been marked by sharp price swings. On the day of its NYSE debut, June 5, the stock opened at 69 dollars and closed at 83.23 dollars, delivering a 168 percent gain and valuing the company at 18.4 billion dollars. This was followed by continued gains that took the stock to a peak of 165.60 dollars on June 16, boosted by positive sentiment around stablecoins and digital assets. However, today’s 3.5 percent decline is being seen as a natural correction after such a steep and rapid rise.

The broader market mood has also been unstable. US index futures have shown signs of weakness, and rising tensions in the Middle East have contributed to overall investor caution. Such a backdrop often leads to increased volatility in high-growth stocks like Circle.

Adding to investor concerns are the regulatory uncertainties. The US Senate is preparing to vote on a new stablecoin regulation bill that could impact the way Circle operates its USDC product. This development has raised questions about how potential legal changes might affect the company’s growth. Reports of large retail giants like Amazon and Walmart exploring their own stablecoin plans have further intensified concerns about future competition.

Here is a look at the recent price trend of Circle stock:

June 5, 2025 – 83.23 dollars, up 168 percent
June 10, 2025 – 77.06 dollars, down 7.42 percent
June 12, 2025 – 106.54 dollars, down 5.5 percent
June 16, 2025 – 151.06 dollars, up 18.6 percent
June 17, 2025 – 145.54 dollars, down 3.5 percent

Since its IPO, Circle’s stock is still up by 54.64 percent. The company’s financials for Q1 2025 showed a net income of 65 million dollars, mainly earned through interest on reserves backing USDC. The company also reported an operating cash flow of 56 million dollars during the same quarter. Strategic partnerships, including one with BlackRock, have helped Circle strengthen its position in the digital asset space. However, the company’s heavy reliance on interest income means that any cuts in interest rates could hurt its profitability going forward.

Looking ahead, investors will be closely watching the outcome of the Senate’s vote on stablecoin regulation. Any changes in the law could either support Circle’s expansion or limit its operations. The entry of new players in the stablecoin sector could also add pressure. Circle is scheduled to announce its Q2 earnings in August 2025, and those results will be important in assessing the company’s ability to maintain growth in USDC adoption.

In summary, while Circle has delivered strong returns in a short period, the stock is currently facing multiple headwinds, including regulatory risks, market volatility, and increasing competition. Investors are advised to approach with caution and keep an eye on upcoming developments before making any long-term decisions.

Disclaimer: This article is for informational purposes only and should not be considered financial advice. Investing in the stock market involves risk. Please consult a certified financial advisor before making any investment decisions.

Palantir Shares Drop 3.5% Amid Market Volatility and Tariff Concerns

The Shipping Corporation of India Limited – stock latest AUDITED FINANCIAL RESULTS news

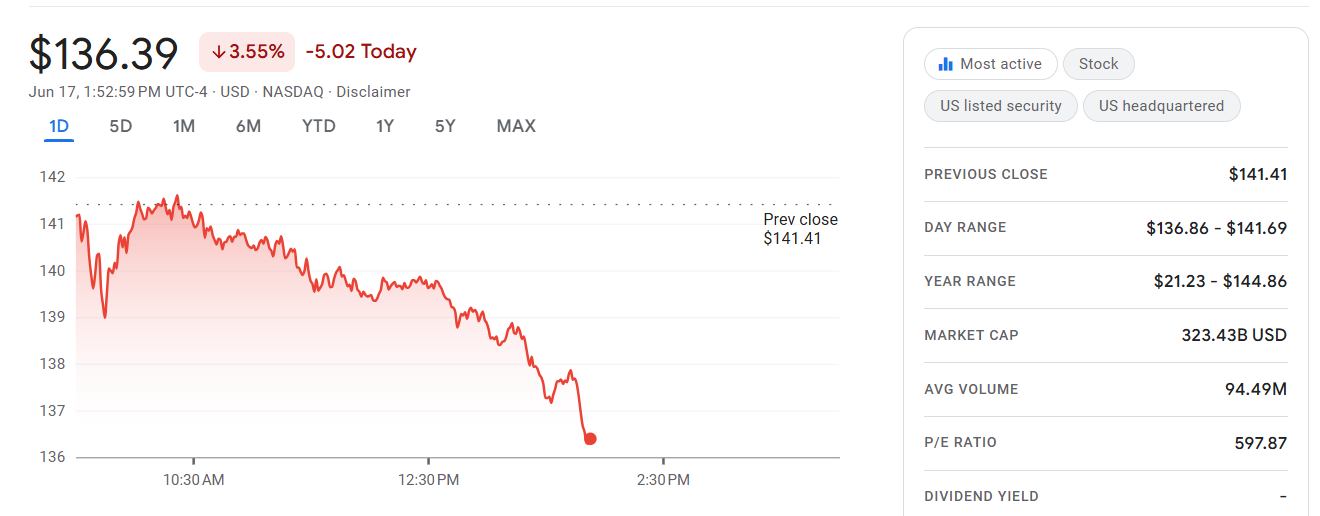
Shares of Palantir Technologies Inc. (NASDAQ: PLTR) faced significant selling pressure today, dropping 3.55% to close at $136.39, down $5.02 from Monday’s close of $141.41, according to Yahoo Finance data. The stock reached an intraday high of $141.69 before slipping to a low of $136.86, reflecting heightened volatility in a cautious broader market. Despite today’s decline, Palantir’s stock remains near its 52-week high of $144.86, showcasing robust investor enthusiasm for the AI and data analytics leader.

palantir Stock chart

An analysis of Palantir’s performance reveals a mixed but impressive trajectory. Over the past five days, PLTR gained 2.1%, and over the past month, it rose 7.8%, per Yahoo Finance, signaling strong short-term momentum. Year-to-date, the stock has surged 77.7%, and its one-year gain stands at a remarkable 392.7%, driven by Palantir’s dominance in AI-driven data solutions. However, today’s dip contrasts with a six-month pullback of -8.4%, highlighting the stock’s volatility amid high investor expectations.

Palantir’s market capitalization of $323.43 billion underscores its prominence in the tech sector. Its price-to-earnings ratio of 597.87 reflects optimism about future growth, though some analysts caution about overvaluation.

According to Bloomberg, Loop Capital raised its price target to $155 on June 13, 2025, citing Palantir’s expanding commercial contracts, while Yahoo Finance reports a median target of $104.27, suggesting potential downside.

The company’s Q1 2025 revenue grew 39% to $883.86 million, exceeding estimates, per its May 5, 2025, 10-Q filing, fueled by its Gotham and Foundry platforms.

Today’s decline may stem from broader market dynamics and company-specific concerns. U.S. index futures fell, and European markets closed lower amid tariff fears. Additionally, insider selling, including CTO Shyam Sankar’s disposal of 405,000 shares on June 10 for $53.49 million, per an SEC Form 4, may have sparked profit-taking.

Despite the day’s dip, Palantir remains a focal point for investors, with its AI leadership and government contracts driving long-term optimism. Traders are eyeing the July 28, 2025, earnings report for updates on commercial growth and tariff impacts. With its stock still up significantly for the year, Palantir’s trajectory suggests resilience, but investors should stay vigilant amid market uncertainties.

This article is for informational purposes only and should not be considered financial advice. Investing in stocks, cryptocurrencies, or other assets involves risks, including the potential loss of principal. Always conduct your own research or consult a qualified financial advisor before making investment decisions. The author and publisher are not responsible for any financial losses incurred from actions based on this article. While efforts have been made to ensure accuracy, economic data and market conditions can change rapidly. The author and publisher do not guarantee the completeness or accuracy of the information and are not liable for any errors or omissions. Always verify data with primary sources before making decisions.

Lockheed Martin Stock Plunged 4% Yesterday: Will the Decline Persist?

Manhattan Bridge Capital authorizes up to 100,000 share repurchase programme to address stock price decline and signal confidence.

(New York, June 17, 2025) – Lockheed Martin Corporation (NYSE: LMT), a leading name in the aerospace and defense sector, is currently experiencing significant stock price volatility. On June 16, 2025, the company’s shares dropped nearly 4%, closing at $467.00. However, by 6:04 AM EDT on June 17 (4:21 PM IST), pre-market trading showed a slight recovery, with the stock rising to $472.00. This shift suggests possible stabilization in the near term.

Key Factors Driving Volatility

1. Geopolitical Tensions

On June 13, LMT stock surged 3.66% to $491.95 following increased tensions in the Middle East after Israel launched strikes against Iran. As a primary supplier of F-35 jets to Israel, Lockheed was expected to benefit from a boost in defense spending. However, the rally reversed on June 16 after Iran indicated a willingness to de-escalate, lowering short-term demand expectations.

2. F-35 Contract Reductions

Investor concerns deepened after news emerged on June 11 that the U.S. Air Force plans to cut its F-35 jet orders for FY 2026 from 48 to 24. This announcement triggered a 6% decline in the stock to $447.96 and may lead to a revenue loss of up to $3.5 billion for Lockheed Martin.

3. Defense Budget Uncertainty

While long-term government contracts like the F-35 program and the U.S. Golden Dome initiative provide a base of revenue stability, ongoing Congressional discussions about future defense spending have created uncertainty, adding pressure to the stock.

4. Macroeconomic Conditions

Rising interest rates and inflation fears continue to challenge the broader defense sector. Even though Lockheed’s forward P/E ratio of 17.49 is below the industry average of 23.2, its stock remains vulnerable to market-wide volatility.

5. Diversified Product Portfolio

Lockheed’s portfolio, which includes PAC-3 missiles, THAAD interceptors, and AI-enabled defense systems, helps mitigate some risk from the F-35 uncertainty. However, short-term price movement remains largely influenced by global headlines and news-driven sentiment.

Despite the turbulence, Lockheed Martin has managed a 4.33% year-to-date return, slightly trailing the broader aerospace and defense sector’s 6.1% gain.


Chart Overview

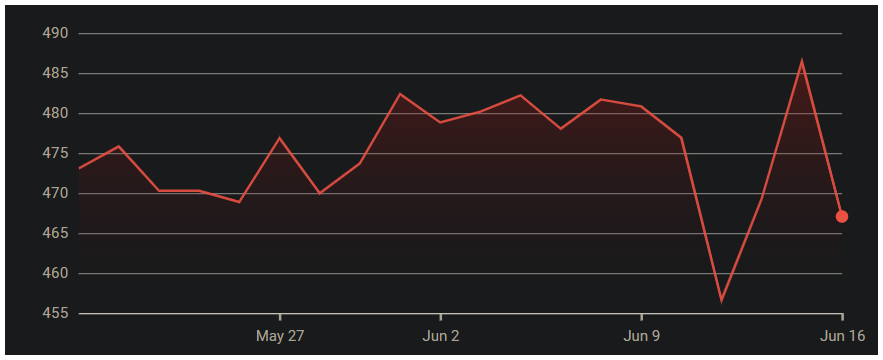
lmt stock monthly chart

A review of the one-month chart shows LMT fluctuating between $457.00 and $491.95 since mid-May. Key price points include:

  • June 4: Peaked at $485.00
  • June 11: Dropped to $457.00 following F-35 news
  • June 13: Rebounded to $491.95 due to geopolitical escalation
  • June 16: Closed at $467.00
  • June 17 (Pre-Market): Slight recovery to $472.00

Over the past year, LMT reached a 52-week high of $618.95 in October 2024 and a low of $418.88. The current price is about 23.7% below its peak.


Technical Outlook

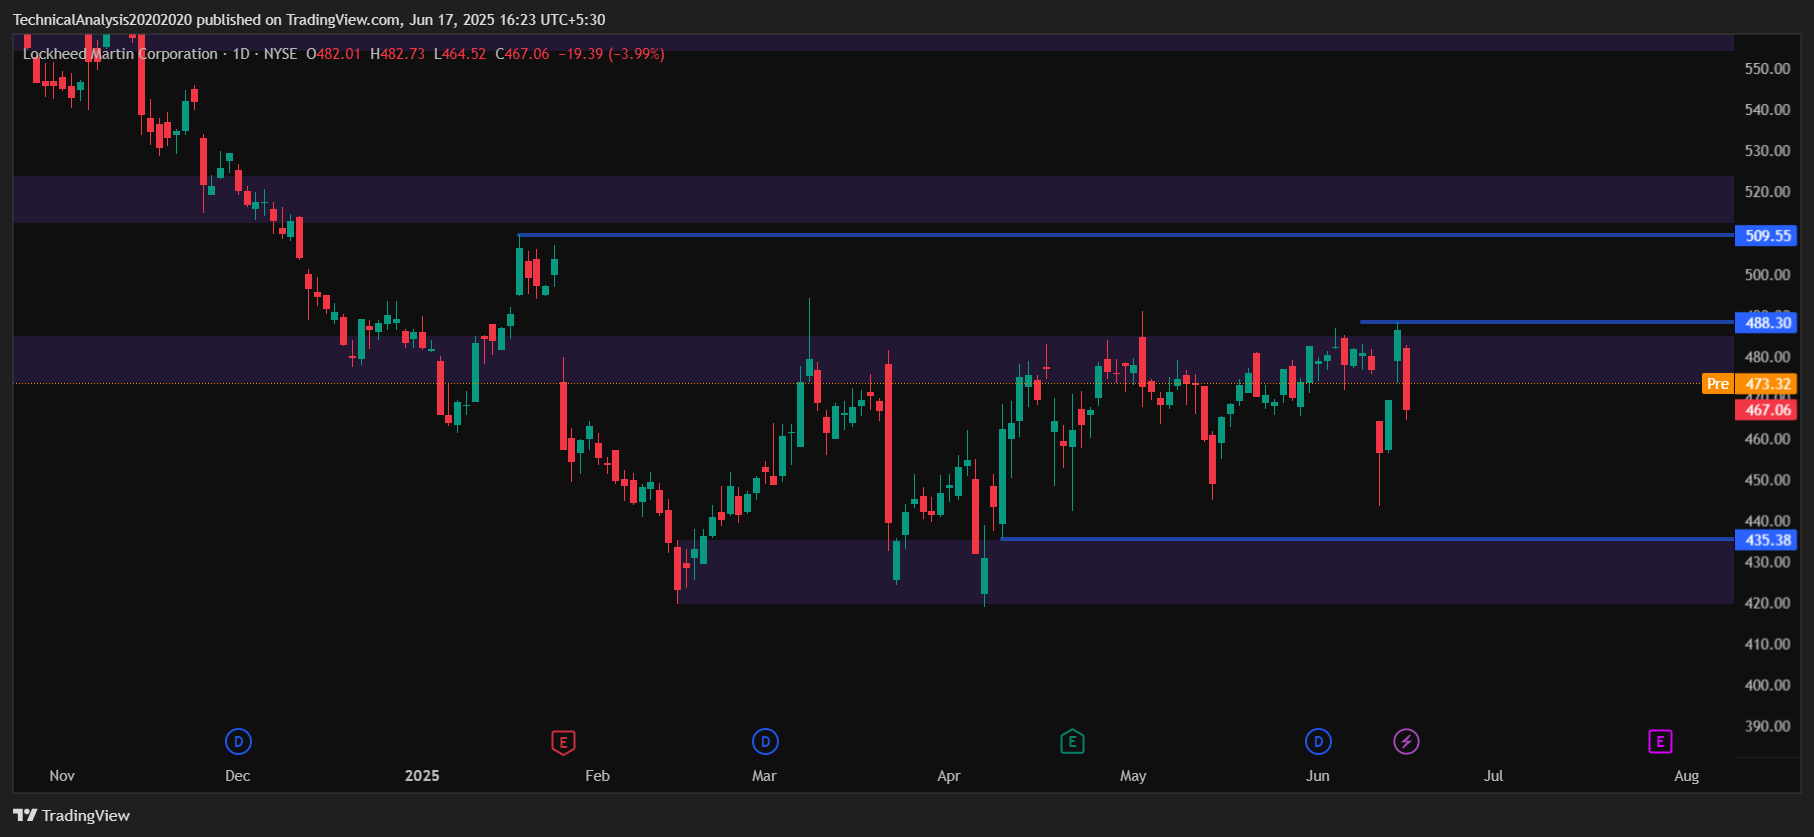
lmt stock tradingview chart

Technical indicators suggest potential for a bullish breakout:

  • Resistance Level: $488.00
  • Breakout Target: If breached, the stock could move toward $509.00
  • Support Zone: Strong buying interest expected between $430.00 and $420.00

What’s Next?

Lockheed Martin’s upcoming earnings call on July 29, 2025, is expected to provide critical updates on contract pipelines and defense funding trends. While the June 17 pre-market recovery hints at a pause in the downtrend, the stock’s direction will likely depend on:

  • Clarification regarding F-35 program cuts
  • U.S. defense budget decisions
  • Further geopolitical developments

As a key player in the global defense industry, LMT will remain in focus for investors tracking market momentum and sector stability.


Frequently Asked Questions (FAQs)

Q1: Why did Lockheed Martin’s stock drop 4% on June 16?
A: The decline followed Iran’s de-escalation signals, reducing expectations for immediate defense spending.

Q2: What technical levels should investors monitor?
A: Resistance is at $488.00 with a breakout target of $509.00. Support lies between $430.00 and $420.00.

Q3: How does the F-35 program affect LMT’s stock?
A: The F-35 is a major revenue driver. Reduced U.S. orders for 2026 caused a sell-off, but long-term contracts still provide revenue stability.

Q4: Are geopolitical events important for LMT’s stock?
A: Yes. Global conflicts, especially in the Middle East, often lead to increased demand for Lockheed’s products.

Q5: What supports Lockheed Martin’s long-term outlook?
A: A strong product portfolio, focus on AI and hypersonic technologies, and leadership in major defense programs.


Financial Disclaimer: This article is for informational and educational purposes only. It does not constitute financial advice or a recommendation to buy, sell, or hold Lockheed Martin (LMT) stock. Investing involves risk. Past performance does not guarantee future results. Please consult a licensed financial advisor before making investment decisions. The author and publisher are not responsible for any financial losses resulting from actions taken based on this content.

Dow Jones and Nasdaq Futures Signal Bullish Gap Open Amid Global Optimism and Geopolitical Risks

StubHub’s unfolding legal crisis is a reminder that IPO investing comes with risk and that the details buried in offering documents can make or break investment decisions. Whether the company misled investors will now be determined through multiple investigations and potential class actions.

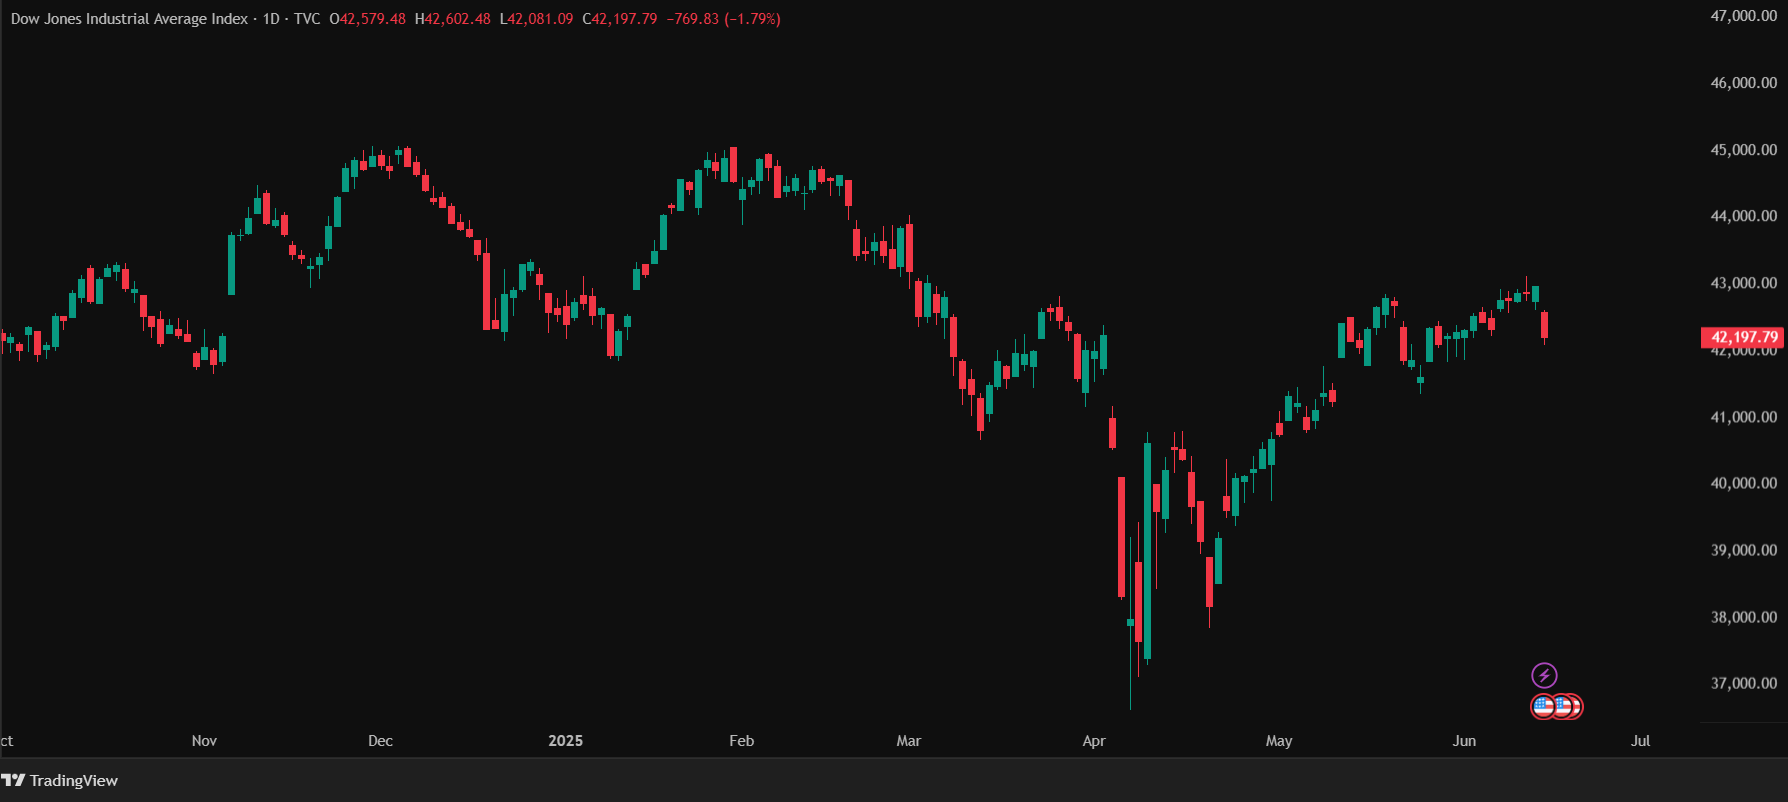
As of Monday, June 16, 2025, at 05:24 AM EDT, U.S. stock market futures are trading on a bullish note, signaling optimism despite ongoing geopolitical tensions. Dow Jones Industrial Average futures are up 135 points (+0.32%) at approximately 42,658.00, and Nasdaq 100 futures have gained 108 points (+0.49%) at around 21,968.75.

European markets, including the FTSE 100, CAC 40, and DAX, are averaging gains of about 0.50%, bolstering global sentiment. If current conditions persist, U.S. markets could see a gap-up open of 0.50% or more, driven by strong futures and European equities, though tempered by rising oil prices, higher U.S. Treasury yields, and Middle East tensions.

Dow Jones and Nasdaq Futures: Poised for a Gap-Up Open

DJIA 30 Trading View Chart - Daily TimeFrame

Last Friday, U.S. markets faced sharp declines after Israel’s airstrikes on Iran, with the Dow Jones Industrial Average dropping 770 points (1.8%) and the Nasdaq Composite falling 1.3%. Futures initially reflected this panic, with Dow futures down 593 points (1.38%) and Nasdaq 100 futures sliding 1.73%. However, Monday’s pre-market trading at 05:24 AM EDT shows a robust recovery, with Dow futures up 135 points and Nasdaq futures gaining 108 points.

The bullish futures movement, coupled with European markets averaging 0.50% gains – FTSE 100, CAC 40, and DAX all up around this level – suggests U.S. markets could open with a gap-up of at least 0.50%. For the Dow, this translates to a potential opening increase of approximately 213 points (based on Friday’s close of 42,197), while the Nasdaq Composite could rise by about 104 points (from 19,406).

European Markets Bolster Global Sentiment

European equities are providing a supportive backdrop for U.S. futures. The FTSE 100, CAC 40, and DAX are each up around 0.50% on Monday, reversing Friday’s declines when the Stoxx Europe 600 fell nearly 1% and the DAX dropped 1.5%. This recovery reflects cautious optimism, possibly driven by hopes of de-escalation in the Middle East or positive economic signals.

If these gains hold, the positive momentum in Europe could amplify the bullish tone in U.S. futures, supporting a gap-up open.

Treasury Yields and Inflation Concerns

U.S. Treasury yields continue to reflect inflation fears. On Friday, the 2-year Treasury yield rose nearly 2 basis points to 3.974%, and the 10-year yield climbed 1 basis point to 4.432%. By Monday, yields were slightly lower at 3.96% for the 2-year and 4.41% for the 10-year, per pre-market data.

The inverse relationship between bond yields and prices underscores investor concerns about rising energy costs fueling inflation.

The Federal Reserve’s upcoming meeting is critical, with markets pricing in a 3.1% chance of a rate cut this week. Higher yields could increase borrowing costs, potentially pressuring equities despite the bullish futures. A hawkish Fed stance might limit the extent of the gap-up open, while a dovish signal could amplify it.

Oil Price Volatility and Geopolitical Risks

Brent crude oil prices, a key market driver, surged 7% on Friday to $74.23 per barrel and rose another 0.5% to $74.60 by Monday, nearing a five-month high. The volatility is tied to fears of supply disruptions through the Strait of Hormuz, which carries 20% of global oil and liquefied natural gas (LNG) flows. A closure – potentially triggered by Iranian retaliation – could push Brent prices toward $90 or higher, per JPMorgan estimates, significantly impacting global markets.

West Texas Intermediate (WTI) crude futures rose 7.6% to $73.20 per barrel on Friday, hitting an intraday high of $77.60, the highest since January. Rising oil prices have reignited U.S. inflation fears, complicating the Fed’s policy outlook. While the bullish futures suggest investors are looking past these risks for now, a sharp oil price spike could derail the gap-up open.

Global Market Dynamics

Global markets show mixed but improving sentiment. Chinese stocks (CSI 300) oscillated, closing down 0.7% on Friday, but Monday’s European gains suggest a broader recovery. Safe-haven assets like gold remain near record highs above $3,400 per ounce, with gold futures up 1.5% to $3,455 on Friday, reflecting lingering anxiety.

The U.S. dollar index is steady at 98.64, down 0.5% after a milder-than-expected U.S. inflation report for May.

Recent U.S.-China trade talks in London offer some optimism, but the Israel-Iran conflict dominates market focus.

Market Outlook: A Bullish Open with Risks

The bullish Dow Jones and Nasdaq futures, up 135 and 108 points respectively, combined with European markets gaining 0.50% on average, point to a likely gap-up open of 0.50% or more for U.S. markets, assuming conditions remain stable. Key factors to watch include:

  • Geopolitical Stability: De-escalation in the Middle East could sustain the bullish momentum, while escalation could trigger a reversal.
  • Federal Reserve Signals: A dovish Fed could amplify the gap-up, while a hawkish stance might cap gains.
  • Oil Prices: Further spikes in Brent or WTI crude could reignite inflation fears, pressuring equities.
  • Global Cues: Sustained European gains and Chinese market stability could reinforce U.S. optimism.

The Bottom Line

Dow Jones and Nasdaq futures are poised for a bullish gap-up open of 0.50% or more, driven by gains of 135 and 108 points respectively and supported by European markets (FTSE 100, CAC, DAX) averaging 0.50% higher. Despite optimism, risks from the Israel-Iran conflict, volatile oil prices, and rising Treasury yields loom large. Investors should monitor Middle East developments, Federal Reserve signals, and global market cues to gauge the sustainability of the rally. A cautious yet opportunistic approach is warranted in this volatile environment.

This article is for informational purposes only and should not be considered financial advice. Investing in stocks, cryptocurrencies, or other assets involves risks, including the potential loss of principal. Always conduct your own research or consult a qualified financial advisor before making investment decisions. The author and publisher are not responsible for any financial losses incurred from actions based on this article. While efforts have been made to ensure accuracy, economic data and market conditions can change rapidly. The author and publisher do not guarantee the completeness or accuracy of the information and are not liable for any errors or omissions. Always verify data with primary sources before making decisions.

6 Must-Know Things About DeFi in 2025

DeFi, or Decentralized Finance, is a system of financial tools and services built on blockchain technology, primarily Ethereum, that operates without traditional banks or middlemen.

Mini Glossary

Blockchain: A decentralized, secure ledger of digital transactions
Smart Contract: Self-executing code that carries out financial operations
Crypto Wallet: A tool for storing and interacting with digital assets
Token: A platform’s native asset used for governance, rewards, or trading
Liquidity Pool: A reserve of tokens used to facilitate decentralized trading

1. DeFi lets you use financial services without needing a traditional bank.

What is Defi in Simple Terms?

The full form of DeFi is Decentralized Finance, which means financial activities are not controlled by any central authority or institution.

DeFi allows you to lend, borrow, trade, or save using blockchain networks, primarily Ethereum. It mimics traditional banking functions but removes central authorities. Instead of a bank managing your money, DeFi platforms rely on smart contracts which are self-executing code that operates transparently and without human intervention.


2. DeFi is built on blockchain, which replaces trust in people with trust in code.

DeFi operates on blockchain which is a decentralized, tamper-proof ledger. Every transaction is recorded publicly and permanently. This eliminates the need for banks or brokers to verify transactions.

Smart contracts run automatically, enabling functions like lending or token swapping with speed and accuracy.

The result is a trustless system, where trust shifts from institutions to transparent, verifiable code which is a key driver behind DeFi’s adoption in 2025.


3. You only need a crypto wallet to access DeFi platforms and services.

To access DeFi, a crypto wallet is essential. This wallet stores your digital assets and connects directly with DeFi platforms like Uniswap, Aave, and Curve.

No KYC, no forms – just your wallet and internet.

But with great power comes great responsibility: If you lose your private key (a unique password-like code), you lose access to your funds permanently. There’s no reset button.


4. DeFi tokens allow you to participate, earn rewards, and share in platform success.

Most DeFi platforms, like Uniswap (UNI), Aave (AAVE), and Compound (COMP), have their own tokens.

A token is a digital asset created on a blockchain, like Ethereum, that acts like a “coin” or “ticket” specific to a platform. Unlike cryptocurrencies like Bitcoin, tokens are built on existing blockchains and serve unique roles within their ecosystem.

These tokens do three main things:

  • Governance: Let you vote on platform changes, like updating rules or fees, giving you a say in how the platform runs.
  • Rewards: Earn interest or fees by staking (locking up) tokens or providing liquidity (lending assets) to the platform.
  • Speculation: Potential to gain from rising token prices if the platform grows in popularity.

For example, holding UNI tokens for Uniswap might let you vote on trading fees, earn a share of those fees, or profit if UNI’s value increases.


5. While DeFi offers high returns, it also involves serious risks.

DeFi offers exciting opportunities for earning high returns through:

  • Staking: Lock your tokens to earn interest.
  • Liquidity Pools: Provide assets to platforms like Uniswap and earn trading fees.
  • Yield Farming: Move assets across platforms to chase the highest returns.

However, these rewards come with significant risks:

  • Smart Contract Bugs: Code flaws can lead to losses.
  • Platform Hacks: Security breaches may compromise funds.
  • Market Volatility: Prices can swing wildly, affecting your investment.
  • Regulatory Crackdowns: Governments may impose strict rules or bans.

6. DeFi platforms are like money LEGOs, allowing you to stack and combine services.

DeFi platforms are like LEGO blocks for money – simple pieces you can stack together. You can use one platform to borrow money and another to trade, all in one go.

As of June 2025, people have put over $150 billion into DeFi. New tech, like Arbitrum, makes DeFi faster and cheaper by fixing Ethereum’s high costs.

This easy-to-use system is turning DeFi from basic tools into a big world of financial possibilities.


The Bottom Line

These six pillars offer a strong foundation – covering 80% of what truly matters in DeFi. It’s a financial system powered by blockchain, governed by communities, accessed through wallets, and designed to be open, permissionless, and transparent.

This article is for informational purposes only and should not be considered financial advice. Investing in stocks, cryptocurrencies, or other assets involves risks, including the potential loss of principal. Always conduct your own research or consult a qualified financial advisor before making investment decisions. The author and publisher are not responsible for any financial losses incurred from actions based on this article. While efforts have been made to ensure accuracy, economic data and market conditions can change rapidly. The author and publisher do not guarantee the completeness or accuracy of the information and are not liable for any errors or omissions. Always verify data with primary sources before making decisions.

8 Important Facts About Stablecoins You Need to Know in 2025

Stablecoins are cryptocurrencies built to hold steady, pegged to assets like the U.S. dollar, euro, gold, or other cryptos.

Stablecoins play an essential role in the cryptocurrency ecosystem. They offer a sense of stability in a space often marked by sharp price swings and also present advantages over traditional fiat currencies. With the global crypto market now valued at more than $3.5 trillion, stablecoins like USD Coin (USDC) are becoming central to everything from payments and decentralized finance (DeFi) to promoting financial inclusion.

This article explores 8 critical aspects of stablecoins. It breaks down their definition, explains why they are needed alongside Bitcoin and fiat currencies like the USD, highlights their benefits, and provides a current list of major stablecoins.

1. What Are Stablecoins, and How Do They Maintain Stability?

Stablecoins are cryptocurrencies designed to keep a consistent value by being tied to traditional assets like the U.S. dollar, the euro, gold, or even other cryptocurrencies. Unlike Bitcoin, which saw a 15% price drop in a recent month according to CoinGecko, stablecoins such as Tether (USDT) and USDC are pegged 1:1 to the U.S. dollar, meaning that 1 USDC is roughly equal to $1. These digital assets blend the benefits of blockchain technology with the reliability of traditional currencies, making them suitable for daily transactions, savings, and DeFi use.

They maintain their stability using different methods. Fiat-backed stablecoins, like USDC, hold reserves in actual U.S. dollars stored in audited bank accounts. Crypto-backed stablecoins, such as DAI, are supported by extra collateral in cryptocurrencies like Ethereum, managed by smart contracts. Then there are algorithmic stablecoins like Ethena USDe, which use automatic supply adjustments to keep their value stable. Together, these mechanisms help stablecoins stand apart from Bitcoin’s unpredictability and fiat’s slower systems.

2. Why Are Stablecoins Necessary When Bitcoin and USD Exist?

Stablecoins fill in the gaps left by both Bitcoin and traditional currencies like the USD. While Bitcoin is a revolutionary asset, its price often swings by 12% to 18% within a single month. This makes it unreliable for everyday purchases. For example, it recently dropped 15% in one month. Stablecoins, like USDC, stay steady at $1, enabling dependable payments. In fact, stablecoins handled $27.6 trillion in transactions last year, surpassing Visa and Mastercard combined, according to Chainalysis.

Bitcoin also falls short in cross-border payments, where transaction fees can spike to $10 or even $50, and confirmation times are slow. USDC, on networks like Solana, processes transfers for less than a cent and in just seconds. In countries like Nigeria and India, where remittances are crucial, usage of stablecoins has surged by 200%, showcasing their value where Bitcoin cannot compete.

When compared to USD, bank transfers can take 1 to 5 days and cost $10 to $40. Stablecoins settle in seconds and cost much less. In regions like Turkey, where the lira dropped 28% in value, access to U.S. dollars is limited. However, people are using stablecoins instead. In Turkey alone, stablecoin activity now makes up 4.5% of the country’s GDP. While banks are only open during set hours, stablecoins work 24/7.

Additionally, U.S. dollars cannot be used in DeFi platforms that offer returns of 5% to 10%, but stablecoins like USDC are at the heart of DeFi’s $2.5 trillion total value locked. Traders also use stablecoins as a safe zone during market downturns to preserve their capital without moving back to fiat. In short, stablecoins go beyond what Bitcoin and USD offer by delivering speed, stability, and ease of use.

3. How Do Stablecoins Differ from Bitcoin and USD?

Each of these—stablecoins, Bitcoin, and USD—plays a unique role in the world of finance. Stablecoins such as USDC keep a steady value of $1 and avoid the 10% to 20% swings seen in Bitcoin, which recently dropped 15% in one month. While Bitcoin, with a market cap of $1.2 trillion, is mainly used as a store of value or speculative asset, and USD is backed by government institutions, stablecoins operate on blockchain and are built for real-world applications like payments and remittances.

Their technical designs also differ. USDC keeps U.S. dollar reserves in audited accounts. DAI uses other cryptocurrencies as collateral. Ethena USDe controls supply through algorithms. Bitcoin’s price is driven by market demand and supply, and USD depends on the central banking system. Transaction costs also set them apart. Bitcoin fees range from $1 to $50 and can take time to confirm. USD transfers via banks can cost $10 to $40 and take days. On the other hand, USDC on Solana settles almost instantly for less than a cent.

Access is another key factor. Traditional banking is required to use USD, which leaves many people out—especially in underserved areas. Stablecoins are available globally, around the clock, with just a smartphone and internet access. They blend Bitcoin’s innovation with the reliability of the dollar, offering something more practical and inclusive.

4. What Types of Stablecoins Are Available?

Stablecoins fall into four major types, each using a different method to keep their value stable. Fiat-backed stablecoins like USDC and USDT are tied to the U.S. dollar or euro and supported by reserves in bank accounts. They’re centralized and reliable for everyday payments and trading.

Crypto-backed stablecoins, such as DAI, are pegged to the dollar but supported by cryptocurrency like Ethereum. These rely on decentralized smart contracts and are popular in DeFi.

Commodity-backed stablecoins are tied to assets like gold or silver. Examples include Tether Gold (XAUt), which appeals to investors who want digital access to physical commodities.

Algorithmic stablecoins like Ethena USDe adjust their supply using software rules rather than backing assets. They carry more risk, as seen in TerraUSD’s $45 billion collapse a few years ago. Still, each type offers unique advantages, from handling remittances to powering decentralized finance.

5. What Is the Current State of the Stablecoin Market?

Today, stablecoins have become a significant part of the cryptocurrency landscape. According to recent data from CoinGecko, they have a combined market cap of $254 billion, making up 7.1% of the total $3.5 trillion crypto market—a 60% increase from the year before.

Tether (USDT) leads the pack with $157.6 billion, followed by USDC at $61 billion. Together, they represent over 90% of the stablecoin market. Growth is especially strong in developing nations, where local currencies struggle and access to U.S. dollars is limited. In Turkey, for instance, stablecoin activity makes up 4.5% of GDP, and Nigeria has seen usage grow by 200%, driven by the depreciation of the local currency.

New U.S. laws like the GENIUS Act are adding credibility to the market by requiring more transparency. USDC benefits from these regulations due to its frequent audits, while USDT faces criticism for a lack of financial clarity. Still, stablecoins are not without issues. Chainalysis reports that they accounted for $24 billion—or 60%—of all crypto-related illicit transactions last year. On X, users note that USDT dominates in Asia, USDC is preferred in the U.S., and banks such as Citi are exploring ways to issue their own stablecoins to address the dollar’s shortcomings.

6. Which Stablecoins Exist in the Market Today?

Around 200 stablecoins are active as June 2025. However, only a handful see widespread use. Below is a categorized list based:

Fiat-Backed Stablecoins (Pegged to fiat currencies, backed by reserves):

  • Tether (USDT): $157.6 billion, USD-pegged, on Ethereum, Solana, Tron; widely used, transparency concerns.
  • USD Coin (USDC): $61 billion, USD-pegged, Circle-issued; audited, U.S.-regulated.
  • Binance USD (BUSD): ~$17 billion, USD-pegged, Binance/Paxos, NYDFS-regulated.
  • Pax Dollar (USDP): USD-pegged, Paxos, audited.
  • TrueUSD (TUSD): USD-pegged, TrustToken, transparent.
  • PayPal USD (PYUSD): USD-pegged, PayPal-issued.
  • First Digital USD (FDUSD): USD-pegged, transaction-focused.
  • Ripple USD (RLUSD): USD-pegged, Ripple-issued, launched 2024.
  • HeLa USD (HLUSD): USD-pegged, HeLa, Australian-backed, DeFi.
  • STASIS EURO (EURS): Euro-pegged, STASIS.
  • Tether EURt (EURt): Euro-pegged, Tether.
  • Tether CNHt (CNHt): Yuan-pegged, Tether, niche.
  • Tether MXNt (MXNt): Peso-pegged, Tether, Latin America.
  • Global Dollar (USDG): USD-pegged, KuCoin-listed.
  • Usual USD (USD0): $1.2 billion, Usual Protocol, Treasury-backed.
  • USDtb: Ethena-issued, BlackRock BUIDL-backed, recent launch.
  • USD1: World Liberty Financial, USD-pegged, emerging (limited data; X posts note Trump affiliation).
  • Anchored USD (AUSD): USD-pegged, DeFi.
  • eUSD: Lybra Finance, USD-pegged, DeFi.
  • Gemini Dollar (GUSD): Gemini-issued, NYDFS-regulated.
  • EURA: Angle Protocol, euro-pegged, DeFi.
  • Celo Dollar (cUSD): Celo blockchain, USD-pegged, mobile-first.
  • Celo Euro (cEUR): Celo, euro-pegged.
  • XSGD: StraitsX, SGD-pegged, Southeast Asia.
  • IDRT: Rupiah Token, IDR-pegged, Indonesia.
  • GYEN: GMO-Z.com, yen-pegged, niche.
  • ZUSD: Z.com, USD-pegged, small.
  • BRLA: BRLA Digital, BRL-pegged, Brazil.
  • AEUR: Anchored Coins, euro-pegged.
  • BGBP: Binance, GBP-pegged, UK.
  • USDK: OKLink, USD-pegged, niche.

Crypto-Backed Stablecoins (USD-pegged, backed by cryptocurrency collateral):

  • Dai (DAI): $5.36 billion, MakerDAO, Ethereum-backed.
  • Liquity USD (LUSD): Liquity, Ethereum-backed.
  • sUSD: Synthetix, crypto-collateralized.
  • Magic Internet Money (MIM): Abracadabra, multi-chain.
  • FRAX: Frax Finance, partially crypto-backed.
  • VAI: Venus Protocol, Binance Smart Chain.
  • USDX: Kava blockchain, DeFi.
  • aUSD: Acala, Polkadot ecosystem.
  • crvUSD: Curve Finance, lending-focused.

Commodity-Backed Stablecoins (Pegged to gold or silver):

  • Tether Gold (XAUt): Tether, 1 token = 1 ounce gold.
  • Pax Gold (PAXG): Paxos, audited gold reserves.
  • Digix Gold (DGX): Digix, gold-pegged, niche.
  • Perth Mint Gold Token (PMGT): Australian mint-backed.
  • AurusGOLD (AWG): Gold-pegged, small.

Algorithmic Stablecoins (Maintained by algorithms, no collateral):

  • Ethena USDe: Ethena, USD-pegged, delta-neutral.
  • Ampleforth (AMPL): Supply-adjusting, not USD-pegged.
  • Frax Share (FXS): Partially algorithmic, FRAX ecosystem.
  • TerraUSD Classic (USTC): Niche, post-2022 collapse.
  • Reserve (RSV): Reserve Protocol, emerging markets.
  • Beanstalk (BEAN): USD-pegged, DeFi.
  • USDD: Tron-based, algorithmic, small.
  • CUSD (Carbon): Algorithmic, eco-focused.

7. Why Are Stablecoins Gaining Widespread Adoption?

The growing popularity of stablecoins can be linked to how effectively they solve problems found in Bitcoin and fiat currencies. Their steady value makes them ideal for transactions and DeFi, unlike Bitcoin, which is too volatile to function as a regular payment method.

Compared to USD, stablecoins cost much less to use—just a fraction of a cent versus $10 to $40 for bank wires—and they settle in seconds rather than days. In DeFi, they are foundational, helping secure $2.5 trillion in total value locked and offering yields of 5% to 10% through platforms like Compound.

In countries like Turkey and Nigeria, where national currencies have lost a lot of value, stablecoins provide a reliable digital option when U.S. dollars are hard to come by. Major players like PayPal and Visa are integrating stablecoins like PYUSD and USDC into their systems, signaling a major shift toward mainstream use.

8. What Are the Challenges and Future Prospects for Stablecoins?

Despite their benefits, stablecoins still face hurdles. Not all issuers provide the same level of transparency. For instance, USDT has been criticized for incomplete audits, while USDC earns trust through regular attestations.

New regulations, such as the GENIUS Act in the U.S. and fresh rules in the EU, could tighten oversight. This may create obstacles that fiat currencies like the USD don’t have to face. There’s also the risk of losing their dollar peg—USDT once fell to 92 cents—and algorithmic models carry even higher risk, as the TerraUSD incident revealed.

Stablecoins are also used in illegal activities due to their stability, accounting for $24 billion in crypto crime last year, according to Chainalysis. That said, their role in digital finance is only growing stronger. With a $254 billion market cap and $27.6 trillion in transactions last year, they have clearly proven their value. Large banks such as JPMorgan and Citi are now exploring how to create their own stablecoins to offer faster and cheaper alternatives to fiat. Meanwhile, DeFi continues to expand, with stablecoins powering key innovations. As inflation and currency issues persist in emerging markets, stablecoins are becoming even more important.

The Bottom Line

Stablecoins like USDC are now an essential part of the cryptocurrency world. They offer the kind of stability, speed, and access that Bitcoin and traditional fiat currencies often fail to provide. With a market cap of $254 billion and nearly 200 options – from giants like USDT to niche coins like XSGD – stablecoins are deeply involved in payments, DeFi, and financial inclusion.

This article is for informational purposes only and should not be considered financial advice. Investing in stocks, cryptocurrencies, or other assets involves risks, including the potential loss of principal. Always conduct your own research or consult a qualified financial advisor before making investment decisions. The author and publisher are not responsible for any financial losses incurred from actions based on this article. While efforts have been made to ensure accuracy, economic data and market conditions can change rapidly. The author and publisher do not guarantee the completeness or accuracy of the information and are not liable for any errors or omissions. Always verify data with primary sources before making decisions.

5 Important RLUSD Facts You Must Know in 2025

RLUSD is a USD-backed stablecoin launched on December 17, 2024, by Standard Custody & Trust Company, a Ripple Labs subsidiary, under NYDFS oversight. Designed for RippleNet payments and DeFi, it competes in the 2025 stablecoin market dominated by USDT and USDC.

What is RLUSD?

RLUSD is a stablecoin launched on December 17, 2024. The coin is regulated under the strict rules of the New York Department of Financial Services (NYDFS), making it one of the more trusted options in the market.

RLUSD is slowly gaining popularity and already has a market cap of $388 million.

While big names like USDT and USDC still lead the stablecoin market, Ripple is trying to stand out by focusing on businesses. It’s doing this through RippleNet, strong regulation, and the ability to work across different blockchains like the XRP Ledger (XRPL) and Ethereum.

Since RLUSD is backed by the US dollar, it’s seen as a stable and safe option for users who want to move between traditional finance and decentralized finance (DeFi).
Also Read – USDC vs. RLUSD vs. USDT – Key Differences and Why They Matter

Here are five important facts you should know about RLUSD:

1. Issued by Ripple Labs’ Subsidiary

Fact: RLUSD is issued by Standard Custody & Trust Company, LLC, a Ripple Labs, Inc. subsidiary regulated by the New York Department of Financial Services (NYDFS).

Significance: This centralized issuance places control over RLUSD’s operations, reserves, and compliance squarely with Ripple Labs. While the NYDFS trust charter ensures regulatory oversight, it contrasts with the decentralized ethos of many crypto projects, raising questions about transparency and single points of failure.

Latest Developments: As of June 2025, Ripple’s advisory board includes high-profile figures such as former FDIC Chair Sheila Bair and former IMF Chief Economist Raghuram Rajan, which enhances RLUSD’s institutional credibility. However, the XRPL’s “clawback” amendment, implemented in January 2025, allows Ripple to freeze or retrieve RLUSD tokens under legal orders. This feature has amplified concerns around centralization, especially among DeFi purists.

2. Fully Backed by USD and Treasuries with Monthly Attestations

Fact: RLUSD is a fiat-collateralized stablecoin, backed 1:1 by USD cash deposits, short-term US Treasury securities, and cash equivalents held by a licensed custodian. Ripple publishes monthly third-party attestation reports by BPM, a reputable accounting firm, to verify reserves.

Transparency: While Ripple’s commitment to NYDFS oversight and monthly audits sets a high standard, RLUSD lacks real-time, on-chain proof of reserves—a feature some competitors like Circle’s USDC are exploring. Ripple is also pursuing global regulatory licenses to enhance user trust.

Significance: The USD and Treasury backing ensures stability, making RLUSD particularly appealing to risk-averse institutions. However, the absence of live reserve verification may deter users who prioritize maximum transparency.

Latest Developments: As of May 2025, RLUSD’s market cap reached $245 million, with 55% ($135 million) on Ethereum and 45% ($110 million) on XRPL. BPM’s attestations confirm full backing, with the latest report in April 2025 showing $240 million in reserves. Ripple also secured a license from the Dubai Financial Services Authority (DFSA) in March 2025, expanding its regulated footprint in the UAE.

3. Native to XRPL with Multi-Chain Expansion

Fact: RLUSD is native to the XRP Ledger but also operates as an ERC-20 token on Ethereum through bridging technology. Ripple plans to expand RLUSD to additional blockchains, with Solana and Hedera under consideration. As of June 2025, only XRPL and Ethereum are active.

Primary Use Cases:

  • RippleNet’s On-Demand Liquidity (ODL): RLUSD provides a stable USD-denominated asset for cross-border payments, reducing reliance on XRP’s volatility in RippleNet corridors (e.g., US-Mexico).
  • XRPL DeFi: Powers lending, borrowing, and liquidity pools on XRPL’s decentralized exchange (DEX).
  • Multi-Chain DeFi: Supports Ethereum-based DeFi protocols, with $180 million in collateral as of May 2025.
  • Trading & Hedging: Offers a stable asset for crypto traders, with pairs like RLUSD/XRP and RLUSD/MXN available on exchanges.

Significance: RLUSD’s value lies in its integration with Ripple’s enterprise payment network and its potential to bridge traditional finance with DeFi. While the stablecoin’s multi-chain ambitions aim to broaden its reach, success will ultimately depend on adoption beyond Ripple’s core ecosystem.

Latest Developments: RLUSD is listed on 12 exchanges, including Uphold, Bitso, Bitstamp, MoonPay, Archax, CoinMENA, Bullish, Mercado Bitcoin, Independent Reserve, Sologenic, Kraken, and OKX. XRPL’s liquidity pool total value locked (TVL) hit $85 million in May 2025, up from $50 million in February. Ethereum DeFi collateral rose to $180 million, thanks to integrations with protocols like Aave. Ripple’s partnership with Axelar for XRPL-EVM sidechain bridging also enhances interoperability.

4. Strengths: Enterprise Focus and Regulatory Edge

Pros:

  • RippleNet Integration: RLUSD streamlines cross-border payments for Ripple’s 300+ financial institution clients. For instance, Santander Bank’s use of RLUSD reduced remittance costs by 70% and processing times from three days to just 20 seconds.
  • Regulatory Compliance: With NYDFS and DFSA licenses, plus monthly attestations, RLUSD stands out as a trusted option amid regulatory scrutiny of stablecoin competitors like USDT. Ripple continues to pursue proactive licensing in jurisdictions such as Singapore.
  • XRPL Liquidity Boost: RLUSD transactions consume XRP for gas fees, boosting demand for XRP. XRPL’s ability to handle 1,500 transactions per second (TPS) at a cost of $0.0002 enhances network efficiency.
  • Brand Credibility: Ripple’s decade-long experience in enterprise blockchain, with partners like Bitstamp and MoonPay, gives RLUSD a strong foundation.

Significance: RLUSD’s enterprise-centric model and strong regulatory backing make it a compelling option for institutions cautious about less-regulated stablecoins. Additionally, its role in boosting XRPL activity could benefit the broader XRP ecosystem.

Latest Developments: RLUSD’s market cap grew 45%, rising from $169.5 million in March to $245 million in May 2025—an indicator of growing enterprise adoption. Partnerships with major market makers like B2C2 and Keyrock help ensure liquidity on exchanges. Ripple’s Q1 2025 report noted a 30% increase in RippleNet ODL transactions using RLUSD, particularly across Asia-Pacific corridors.

5. Challenges: Centralization and Market Dominance

Cons & Debates:

  • Centralization Concerns: Ripple Labs’ control over RLUSD’s issuance, reserves, and clawback feature continues to alienate DeFi users who prioritize decentralization. The risk of a single point of failure also remains a concern.
  • Adoption Hurdles: RLUSD’s $245 million market cap is small compared to USDT’s $145 billion and USDC’s $36 billion. Convincing users to switch may require offering a stronger value proposition beyond RippleNet.
  • Regulatory Uncertainty: Despite approvals from NYDFS and DFSA, RLUSD faces challenges in the EU due to delays in MiCA compliance. The SEC’s May 2024 claim that RLUSD is an unregistered asset, though disputed by Ripple, adds further scrutiny.
  • Dependence on Ripple: RLUSD’s success is closely tied to Ripple Labs’ financial health and regulatory standing. The SEC’s $125 million fine in 2023, though resolved, underscores the risks involved.

Significance: RLUSD must overcome both entrenched competition and concerns about centralization to achieve wider traction. Regulatory challenges, particularly in the EU, could limit its ability to expand globally.

Latest Developments: RLUSD is still unavailable in the EU, though Ripple is targeting MiCA compliance by Q4 2025. Despite ongoing SEC scrutiny, NYDFS oversight provides a regulatory buffer in the U.S. XRPL DeFi’s growth remains modest, with a TVL of $85 million compared to Ethereum’s $100 billion. Ripple’s $10 billion valuation in Q2 2025 supports RLUSD’s backing but also underscores its dependence on the parent company.

Also Read – I Created the Best Bitcoin Guide You’ll Ever Read

The Bottom Line

RLUSD is Ripple Labs’ bold attempt to disrupt the stablecoin market, leveraging RippleNet’s enterprise network and a compliance-first approach. Its USD/Treasury-backed model, NYDFS and DFSA licenses, and $245 million market cap as of May 2025 highlight early success. Integration with RippleNet and XRPL, along with increasing traction in Ethereum-based DeFi, positions RLUSD as a versatile and promising digital asset.

However, major hurdles remain. Centralization concerns, the dominance of USDT and USDC, and regulatory uncertainties—especially in the EU and the U.S.—continue to pose significant challenges.

This article is for informational purposes only and should not be considered financial advice. Investing in stocks, cryptocurrencies, or other assets involves risks, including the potential loss of principal. Always conduct your own research or consult a qualified financial advisor before making investment decisions. The author and publisher are not responsible for any financial losses incurred from actions based on this article. While efforts have been made to ensure accuracy, economic data and market conditions can change rapidly. The author and publisher do not guarantee the completeness or accuracy of the information and are not liable for any errors or omissions. Always verify data with primary sources before making decisions.

2 Reasons Bitcoin is Surging on 09 June 2025

Why is bitcoin rising today?

Bitcoin (BTC) is rising sharply and is now trading at $108,446 at the time of writing.

Its market capitalization has reached $2,155,543,471,788, and two key factors are pushing this rally forward—an institutional purchase and a strong technical breakout.

Here’s a clear look at what’s happening and what it might mean for Bitcoin’s next move.

1. Strategy’s Massive Bitcoin Purchase

Formerly known as MicroStrategy, Strategy is driving this surge by making a bold purchase today.

As shared by Michael Saylor on X, Strategy bought 1,045 BTC on June 9 for $110.2 million, paying an average of $105,426 per coin. This brings their total holdings to 582,000 BTC, which they acquired at an average price of $70,086, with a total value of around $40.79 billion.

Analyst Adam Livingston calls this move a “synthetic halving” because Strategy is buying Bitcoin faster than it’s being mined – 450 BTC are mined daily. This reduces supply and pushes up the price.

The purchase is backed by a $1 billion stock offering, showing strong confidence from Strategy and helping drive the price up.

2. Bitcoin’s Bullish Technical Breakout

Bitcoin’s rally also has strong support from a technical breakout.

The price jumped from $105,000 to $107,687 within a few hours.

bitcoin technical analyis june 2025 trading view

This breakout, backed by high trading volume, indicates a healthy uptrend, which is pulling in more traders and buyers.

Also Read – I Created the Best Bitcoin Guide You’ll Ever Read

Latest Bitcoin Price Movements

At the time of writing this article, Bitcoin is at $108,446, up from $103,994 on June 1. It is still below its June 6 high of $115,230. On June 5, Bitcoin dipped to around $101,000, following Circle’s $4.5 billion IPO and ETF outflows of about $278 million. Despite that, Bitcoin has gained 12.82% in the past week and is up 147.39% over the past year.

Right now, strong support exists between $95,000 and $100,000, while the 50-day EMA acts as a resistance zone.

Bitcoin’s Market Cap and Supply Details

With a $2.15 trillion market cap, Bitcoin is among the world’s top assets. It has a circulating supply of 19.87M BTC, out of a total cap of 21 million BTC. This leaves around 1.3 million BTC still to be mined.

Strategy’s 582,000 BTC equals 2.78% of the entire Bitcoin supply, which gives the company massive influence on market movement.

Next Bitcoin Halving Events

Bitcoin has already gone through four halvings in 2012, 2016, 2020, and 2024. The next one is expected around April 2028, when the block reward will be reduced to 1.5625 BTC. By that point, 97% of Bitcoin’s supply will be in circulation.

After that, only small amounts of BTC will be released until the final halving near 2140, after which no new Bitcoin will be created. Miners will then depend entirely on transaction fees. Experts believe the 2028 halving might be the last one to significantly affect prices. Future price moves will likely depend more on usage and adoption.

What’s Next for Bitcoin?

The current price rally is being fueled by today’s massive BTC purchase from Strategy and a solid technical breakout. While Bitcoin did face a quick dip on June 5, it has rebounded strongly.

Many analysts believe BTC could reach between $150,000 and $250,000 by the end of 2025, but this depends on how macroeconomic trends play out and whether Strategy continues holding or begins to sell if BTC falls below their average purchase price of $70,086.

This article is for informational purposes only and should not be considered financial advice. Investing in stocks, cryptocurrencies, or other assets involves risks, including the potential loss of principal. Always conduct your own research or consult a qualified financial advisor before making investment decisions. The author and publisher are not responsible for any financial losses incurred from actions based on this article. While efforts have been made to ensure accuracy, economic data and market conditions can change rapidly. The author and publisher do not guarantee the completeness or accuracy of the information and are not liable for any errors or omissions. Always verify data with primary sources before making decisions.

XRP Holds at $2.22 – Will ETF News or SEC Clarity Push It Past $2.50?

Will ETF News or SEC Clarity Push XRP Past $2.50?

XRP is staying strong at $2.22, up 3.9% in the last 24 hours. Investors are now waiting for two big events – a possible spot XRP ETF approval and the final decision in Ripple’s long-running SEC case.

With companies like VivoPower investing millions and Ripple’s stablecoin RLUSD gaining attention, many are wondering: Is XRP ready to break past $2.50?

SEC Case – Almost Over?

Ripple’s battle with the SEC has been going on since 2020. But now it looks like things may finally be coming to an end. A key update is expected by June 16.

Back in 2023, Ripple had to pay a $125 million fine – which was a win considering the SEC wanted $2 billion. That decision gave investors more confidence.

But it hasn’t been all good news. A court recently refused to lift a ban on institutional XRP sales on May 15, which caused XRP to drop by 18 percent.

Insiders believe the case could wrap up soon. If that happens, it could push XRP’s price higher.

Big Investors and ETF Hype

There’s a lot of talk about a spot ETF for XRP. Coinpedia reports that Franklin Templeton’s application is under review, with a decision expected by June 17.

Meanwhile, VivoPower’s $121 million XRP investment, backed by a Saudi prince, shows that big institutions are trusting XRP more.

Demand is rising fast. XRP futures trading on platforms like CME and Nasdaq also add more credibility.

But not everything is perfect. CoinShares reported that $28.2 million was pulled out from XRP investment products last week. This shows that some big players are still being cautious.

Technical Analysis of XRP for June 2025

xrp trading view chart 08 june 2025

Right now, XRP is holding steady between $2.22 and $2.26, but it’s still 34 percent lower than its all-time high of $3.40 from January.

Currently, XRP is trading within the $2.00 to $2.50 range, as shown in the purple zone on the chart. It is also forming a declining wedge pattern, which typically signals a potential breakout. However, due to current market uncertainty and the decreasing reliability of chart patterns these days, it’s somewhat difficult to predict which direction the breakout might take.

Additionally, XRP is trading above its key 200-day moving average of $2.07, which is a positive sign. But trading volume is down by 16 percent, and network activity has also decreased—only about 4,400 daily active addresses compared to a peak of 15,800, according to FXStreet.

We believe that if XRP moves above $2.50, it could rally up to $2.82. On the other hand, if it falls below $2.00, it might drop as low as $1.68.

RLUSD – Making XRP More Useful

Ripple’s stablecoin RLUSD is gaining momentum. Dubai’s financial authority has approved it for use in things like cross-border payments and even real estate, says Brave New Coin.

Ripple also works with over 300 major financial institutions – including Santander and the Bhutan central bank. These deals show that XRP is becoming more useful for real-world finance.

Still, XRP faces tough competition from stablecoins like USDC, and its network activity is going down, which could be a concern.

Also Read – USDC vs. RLUSD vs. USDT – Key Differences and Why They Matter

The Bottom Line

XRP is holding strong around $2.22, and all eyes are on the upcoming ETF decision and the final word from the SEC.

If either of these turns out to be positive, we could see a big price jump. But if not, XRP may stay stuck in its current range or even fall.

This article is for informational purposes only and should not be considered financial advice. Investing in stocks, cryptocurrencies, or other assets involves risks, including the potential loss of principal. Always conduct your own research or consult a qualified financial advisor before making investment decisions. The author and publisher are not responsible for any financial losses incurred from actions based on this article. While efforts have been made to ensure accuracy, economic data and market conditions can change rapidly. The author and publisher do not guarantee the completeness or accuracy of the information and are not liable for any errors or omissions. Always verify data with primary sources before making decisions.