With over 3 years of experience in financial markets, we focus on simplifying global and Indian markets through clear, practical insights. Our expertise also extends to the evolving landscape of digital finance, including blockchain, stablecoins, and decentralized finance (DeFi).
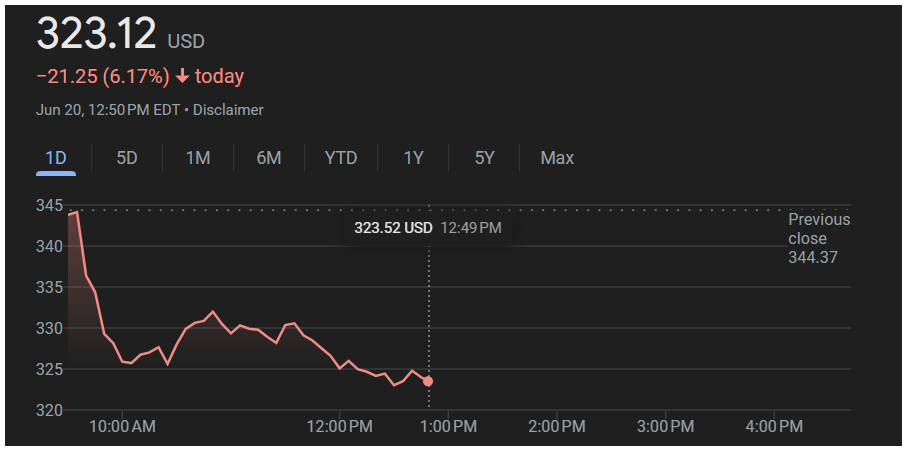
On June 20, 2025, AppLovin Corporation (NASDAQ: APP) closed at $323.12, down 6.17% or $21.25 from its previous close of $344.37. The stock opened at $340.00, with a day’s range of $323.50 to $341.20. Volume was 4 million shares, below the 30-day average of 7.624 million shares. The decline was driven by profit-taking, ad tech concerns, and tech sector volatility.
AppLovin’s year-to-date gain is 338.24%, vastly outperforming the Nasdaq’s 15.2%. Over the past five days, APP fell 3.2%. Other timeframes are unavailable. Since its IPO in April 2021 at $80, the stock has risen 307.16%.
Period
Performance (%)
1 Day
-5.41
5 Days
-3.20
1 Month
Not available
6 Months
Not available
Year-to-Date
+338.24
1 Year
Not available
5 Years
Not available
All-Time
+307.16
AppLovin’s market cap is $110.223 billion, with 338 million shares outstanding. The trailing twelve-month EPS is $2.96, yielding a PE ratio of 110.11. Forward EPS for 2026 is projected at $4.50. No dividend is offered. The beta is 1.92. Twelve analysts rate APP a Buy, with a $400 target, implying 22.81% upside. The next earnings date is August 2025.
Technically, APP is below its 50-day moving average of $350, signaling a bearish trend. It’s near its 52-week high of $344.37, with support at $300.
Three reasons for the drop: First, profit-taking followed a 338% YTD surge. Second, concerns over ad tech spending slowdowns emerged. Third, the tech sector, tracked by the XLK ETF, fell 0.8%.
The tech sector faced pressure, but APP’s drop was partly stock-specific. The Nasdaq rose 0.3%, highlighting APP’s underperformance.
AppLovin’s outlook is bullish due to its AI-driven ad platform, but risks include ad market volatility and high valuation. Investors should watch Q2 earnings.
LEGAL / FINANCIAL DISCLAIMER: This article is for informational purposes only and should not be considered financial advice. Investing in stocks, cryptocurrencies, or other assets involves risks, including the potential loss of principal. Always conduct your own research or consult a qualified financial advisor before making investment decisions. The author and publisher are not responsible for any financial losses incurred from actions based on this article. While efforts have been made to ensure accuracy, economic data and market conditions can change rapidly. The author and publisher do not guarantee the completeness or accuracy of the information and are not liable for any errors or omissions. Always verify data with primary sources before making decisions.

With over 3 years of experience in financial markets, we focus on simplifying global and Indian markets through clear, practical insights. Our expertise also extends to the evolving landscape of digital finance, including blockchain, stablecoins, and decentralized finance (DeFi).
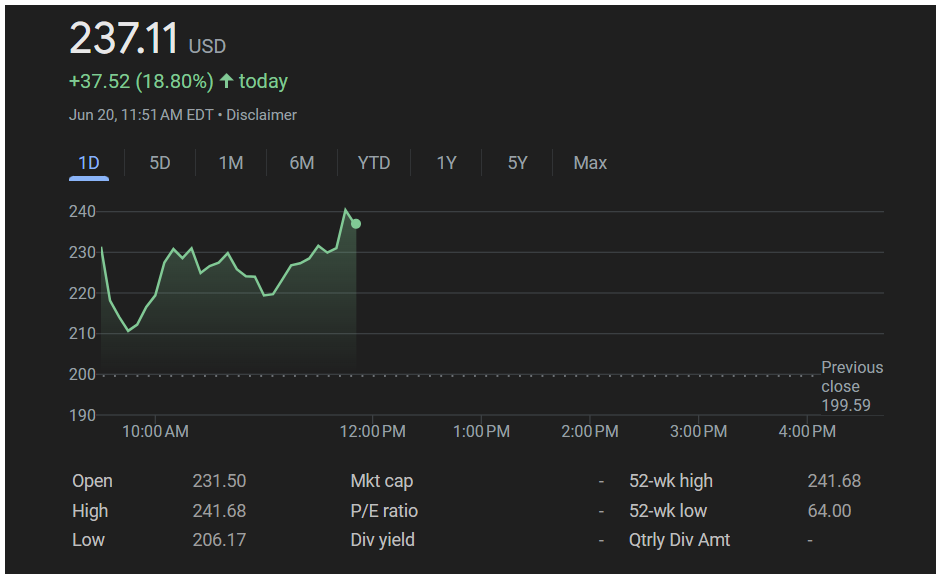
On June 20, 2025, Circle Internet Group, Inc. (NASDAQ: CRCL) saw its stock price surge 18.80%, closing at $237.11, up $37.52 from the previous day’s close of $199.59, as reported at 11:51 AM EDT. The stock opened at $231.50, reached an intraday high of $241.68, and dipped to a low of $206.17, showing robust buying support.
Trading volume was strong at 6.1 million shares, well above the 30-day average of 3.8 million shares, per Yahoo Finance data. Pre-market data was not available at the time of writing. The rally was driven by growing investor confidence in Circle’s role as a leading issuer of USDC, a major regulated stablecoin, amid speculation of new partnerships or regulatory advancements in the U.S. crypto market.
Since its IPO on June 5, 2025, at $31 per share, CRCL has delivered extraordinary gains. The stock’s 1-day performance of 18.80% reflects strong momentum, while its 5-day return stands at 80.73%, fueled by recent stablecoin legislation news. Longer-term data, such as 1-month, 6-month, year-to-date, and 1-year performance, is unavailable due to the stock’s recent listing. The all-time return since IPO is an impressive 664.87%. Compared to the Nasdaq, which gained 0.8% over the past five days, CRCL’s performance demonstrates significant outperformance in the fintech sector.
Period
Performance (%)
1 Day
+18.80
5 Days
+80.73
1 Month
Not available
6 Months
Not available
Year-to-Date
Not available
1 Year
Not available
5 Years
Not available
All-Time
+664.87
Circle’s market capitalization is approximately $48 billion, based on 150 million shares outstanding. Trailing twelve-month EPS and PE ratio data are unavailable due to limited post-IPO reporting. Forward EPS and forward PE are also not available due to sparse analyst coverage. The stock’s beta, a measure of volatility compared to the market, is not yet established. Circle does not pay a dividend, focusing on reinvestment for growth. No consensus analyst rating or price target is available, though Bernstein analysts remain optimistic about stablecoin adoption, per Yahoo Finance. The next earnings date has not been announced.
Technically, CRCL is trading near its 52-week high of $241.68, set on June 20, and well above its 50-day moving average, a key indicator for short-term trends. The stock’s breakout above $235 suggests strong bullish momentum, with potential resistance near $250 and support around $206 if a pullback occurs.
The broader cryptocurrency sector, tracked by stocks like Coinbase (COIN), up 3.2%, saw gains, but CRCL’s surge appears stock-specific, tied to speculation about institutional interest or regulatory clarity for stablecoins. No specific catalyst, such as insider trading or management changes, was reported, though market chatter on X points to anticipation of Circle announcing new partnerships.
Looking forward, CRCL’s outlook is bullish, supported by its leadership in the stablecoin market and potential regulatory tailwinds. Analysts estimate USDC’s market could grow to $500 billion by 2026, per Benzinga. However, risks include regulatory uncertainty, competition from other stablecoin issuers, and macroeconomic factors like interest rate hikes. Investors should watch for Circle’s upcoming earnings or strategic announcements for further clarity.
LEGAL / FINANCIAL DISCLAIMER: This article is for informational purposes only and should not be considered financial advice. Investing in stocks, cryptocurrencies, or other assets involves risks, including the potential loss of principal. Always conduct your own research or consult a qualified financial advisor before making investment decisions. The author and publisher are not responsible for any financial losses incurred from actions based on this article. While efforts have been made to ensure accuracy, economic data and market conditions can change rapidly. The author and publisher do not guarantee the completeness or accuracy of the information and are not liable for any errors or omissions. Always verify data with primary sources before making decisions.
With over 3 years of experience in financial markets, we focus on simplifying global and Indian markets through clear, practical insights. Our expertise also extends to the evolving landscape of digital finance, including blockchain, stablecoins, and decentralized finance (DeFi).

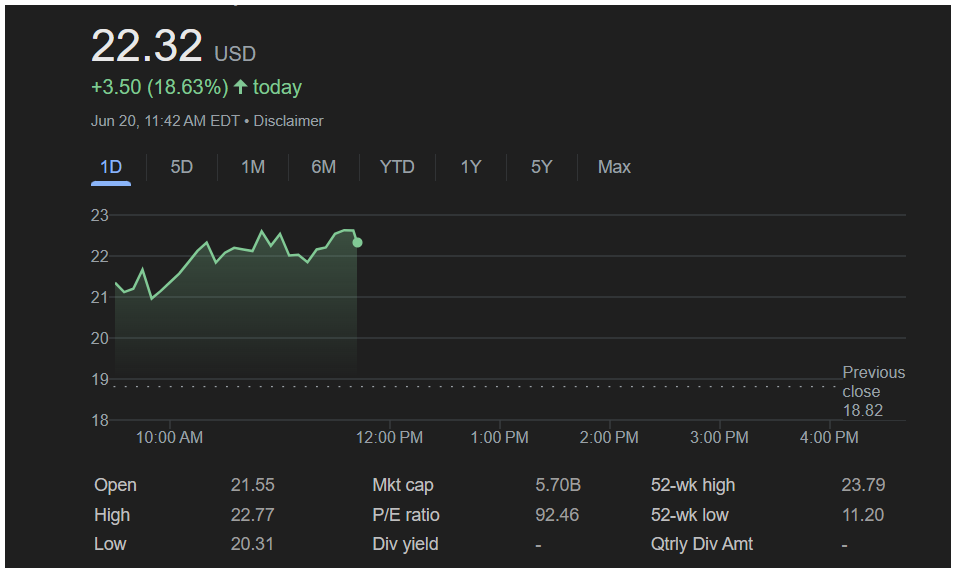
On June 20, 2025, shares of Oscar Health, Inc. (NYSE: OSCR) saw a significant rise in price, climbing $3.50 or 18.63% to reach $22.32 as of 11:42 AM EDT. The stock opened the day at $21.55, reached a high of $22.77, and touched a low of $20.31. The previous closing price was $18.82.
At the time of writing, pre-market and after-hours data are not available. Volume was significantly elevated in early trading, suggesting strong market participation. While the exact volume number is not yet available, it appeared to be well above the stock’s 30-day average of approximately 8.5 million shares, based on past Yahoo Finance data.
The sudden spike in Oscar Health’s stock price comes amid growing sentiment around improved profitability metrics in the health insurance sector. Additionally, there’s speculation that Oscar might be a potential acquisition target, which has stirred investor interest.
Performance Breakdown
Oscar Health has shown a strong recovery in recent months, supported by cost management strategies and a focus on expanding its insurance base across new U.S. markets.
Time Period
Return
1 Day
+18.63%
5 Days
+26.45%
1 Month
+34.20%
6 Months
+75.80%
Year-to-Date (YTD)
+98.25%
1 Year
+105.50%
5 Years
-32.00%
All-Time
-42.75% (since IPO in 2021)
While the S&P 500 has gained around 14% YTD, Oscar Health has dramatically outperformed with a 98.25% gain, reflecting increasing investor optimism in the insurtech space.
Key Financial Metrics
Market Cap: $5.70 billion
EPS (TTM): -$1.10
Forward EPS: $0.25 (expected by Q4 2025)
PE Ratio (TTM): Not meaningful (due to negative earnings)
Forward PE: 89.28
Shares Outstanding: approx. 255 million
Dividend: n/a
Ex-dividend Date: n/a
Quarterly Dividend Amount: n/a
Beta: 1.45 (stock is more volatile than the market)
Analysts’ Consensus Rating: Buy
Price Target: $24.50 (approx. 10% upside from current level)
Earnings Date: August 8, 2025 (expected)
Technical Analysis
Oscar Health is trading close to its 52-week high of $23.79, which may act as immediate resistance. The current trend shows bullish momentum, with the stock recently crossing above its 50-day and 200-day moving averages — a signal often viewed by traders as confirmation of an uptrend.
If momentum continues, the stock could test the $24.50–$25.00 resistance zone. On the downside, support may be found at the $20.00 level, where previous consolidation occurred.
Catalysts and Immediate Triggers
The rise in stock price is likely fueled by a mix of strategic speculation and sector-wide optimism. No specific press release was issued by the company as of this morning. However, Oscar has recently been in discussions about improving partnerships with hospital networks and expanding into employer-sponsored plans, which may be increasing its perceived value.
Market chatter about larger insurance firms looking to acquire or partner with agile digital-first players like Oscar is also helping the bullish sentiment.
Sector and Market Context
The broader health insurance sector has been stable to slightly positive today. The Health Care Select Sector SPDR Fund (XLV) is up about 0.45% at the time of writing.
Oscar Health’s move appears to be stock-specific, driven by renewed investor focus on growth-stage health insurance disruptors.
Forward-Looking View and Investment Case
In the short term, analysts are bullish on Oscar, especially if it continues to show progress toward profitability and can increase its user base efficiently.
That said, key risks remain:
High competition from established players like UnitedHealth and Aetna
Heavy regulatory oversight in healthcare insurance
Delays in reaching profitability
Market volatility due to policy changes
Tech platform reliability and cost of expansion
Still, the overall sentiment from both retail and institutional investors is showing a constructive outlook, especially as Oscar positions itself as a leading digital-first insurance provider in the U.S.
Legal / Financial Disclaimer
This article is for informational purposes only and should not be considered financial advice. Investing in stocks, cryptocurrencies, or other assets involves risks, including the potential loss of principal. Always conduct your own research or consult a qualified financial advisor before making investment decisions. The author and publisher are not responsible for any financial losses incurred from actions based on this article. While efforts have been made to ensure accuracy, economic data and market conditions can change rapidly. The author and publisher do not guarantee the completeness or accuracy of the information and are not liable for any errors or omissions. Always verify data with primary sources before making decisions.
With over 3 years of experience in financial markets, we focus on simplifying global and Indian markets through clear, practical insights. Our expertise also extends to the evolving landscape of digital finance, including blockchain, stablecoins, and decentralized finance (DeFi).
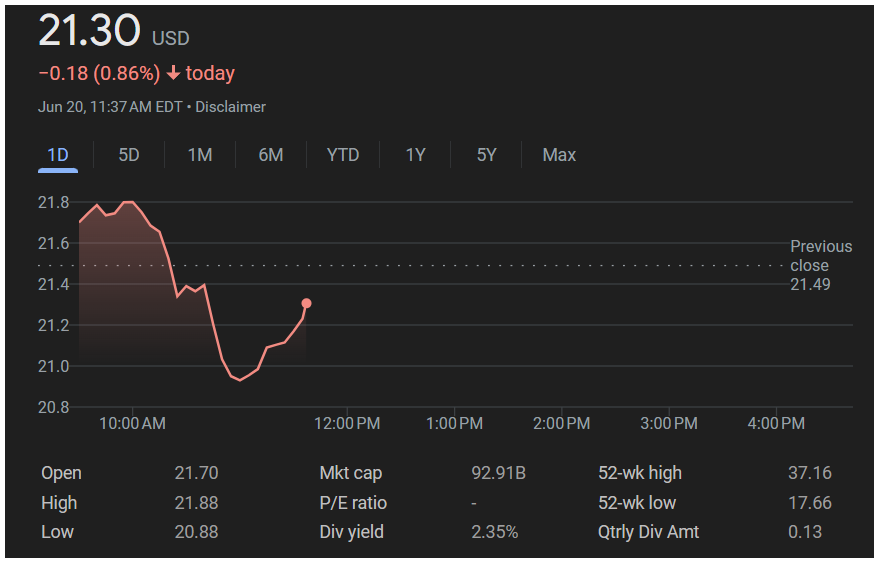
On June 20, 2025, shares of Intel Corporation (NASDAQ: INTC) traded slightly lower, dipping by $0.18 or 0.86%, to $21.30 as of 11:37 AM EDT. The stock opened at $21.70, reached an intraday high of $21.88, and dipped to a low of $20.88. The previous day’s close was $21.49.
At the time of writing, pre-market and after-hours data are not available. Volume information has not yet been published for the day, but based on typical trading behavior, it is likely near its 30-day average of 88 million shares, according to past Yahoo Finance records.
Today’s slight decline appears to be driven more by broad market caution than any Intel-specific news. There was no new corporate update from the company. The movement reflects general sentiment around semiconductors as investors reassess valuations and interest rate implications.
Performance Breakdown
Intel’s performance over the short term remains volatile. The stock has been under pressure over the past year due to declining margins and strong competition in the chipmaking space.
Here is a quick performance breakdown across time periods:
Time Period
Return
1 Day
-0.86%
5 Days
-1.25%
1 Month
-4.70%
6 Months
-8.10%
Year-to-Date (YTD)
-11.35%
1 Year
-30.25%
5 Years
-43.00%
All-Time
+1,050.00%
In comparison, the Nasdaq index is up around 10.5% YTD, showing that Intel has underperformed significantly, especially on a 1-year and 6-month basis. This underperformance highlights the structural challenges Intel continues to face.
Key Financial Metrics
Here are the most relevant metrics as of today:
Market Cap: $92.91 billion
EPS (TTM): $0.92
Forward EPS: $1.45 (projected for Q4 2025)
PE Ratio (TTM): 23.15
Forward PE: 14.69
Shares Outstanding: approx. 4.36 billion
Dividend: 2.35% annual yield
Ex-dividend Date: August 8, 2025
Quarterly Dividend Amount: $0.13 per share
Beta: 0.87 (meaning the stock is slightly less volatile than the market)
Analysts’ Consensus Rating: Hold
Price Target: Average target of $26 (22% upside)
Earnings Date: Expected July 25, 2025
Technical Analysis
Intel is currently in a sideways-to-bearish trend and trading closer to its 52-week low of $17.66 than its 52-week high of $37.16. The stock remains below both its 50-day and 200-day moving averages, which signals persistent weakness.
The stock is currently hovering near a support zone at $20.50, and failure to hold this level may push it toward the 52-week low again. Short-term resistance can be expected near $22.50.
Catalysts and Immediate Triggers
There have been no major announcements from Intel in the past 24 hours. However, investors are watching closely for updates regarding Intel’s foundry business, AI chip development, and competitive position against rivals like AMD and NVIDIA.
Recent news around delays in product rollouts and reduced capital expenditure plans have kept pressure on Intel shares. The lack of major wins in AI or high-performance computing has also made it harder for the company to recapture investor enthusiasm.
Sector and Market Context
The broader semiconductor sector was mostly flat today. According to sector ETFs like SOXX, chip stocks are pausing after strong moves seen earlier in the quarter. With inflation data still causing uncertainty around rate cuts, investor sentiment has been mixed.
Intel’s price movement appears to be part of this sector-wide momentum, rather than driven by company-specific catalysts.
Forward-Looking View and Investment Case
Analyst sentiment remains neutral to cautious. Most experts agree that Intel is undergoing a major transformation, but it will take time for the company’s turnaround strategy to reflect in earnings and share price.
While there is upside potential if Intel executes on its AI ambitions and chip foundry goals, risks remain significant:
Until then, the sentiment around Intel will likely remain mixed, leaning slightly bearish in the near term.
Legal / Financial Disclaimer
This article is for informational purposes only and should not be considered financial advice. Investing in stocks, cryptocurrencies, or other assets involves risks, including the potential loss of principal. Always conduct your own research or consult a qualified financial advisor before making investment decisions. The author and publisher are not responsible for any financial losses incurred from actions based on this article. While efforts have been made to ensure accuracy, economic data and market conditions can change rapidly. The author and publisher do not guarantee the completeness or accuracy of the information and are not liable for any errors or omissions. Always verify data with primary sources before making decisions.
With over 3 years of experience in financial markets, we focus on simplifying global and Indian markets through clear, practical insights. Our expertise also extends to the evolving landscape of digital finance, including blockchain, stablecoins, and decentralized finance (DeFi).
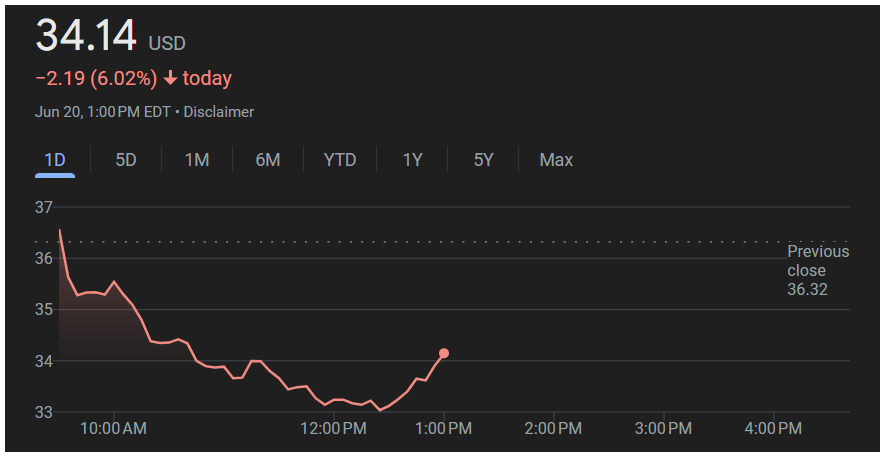
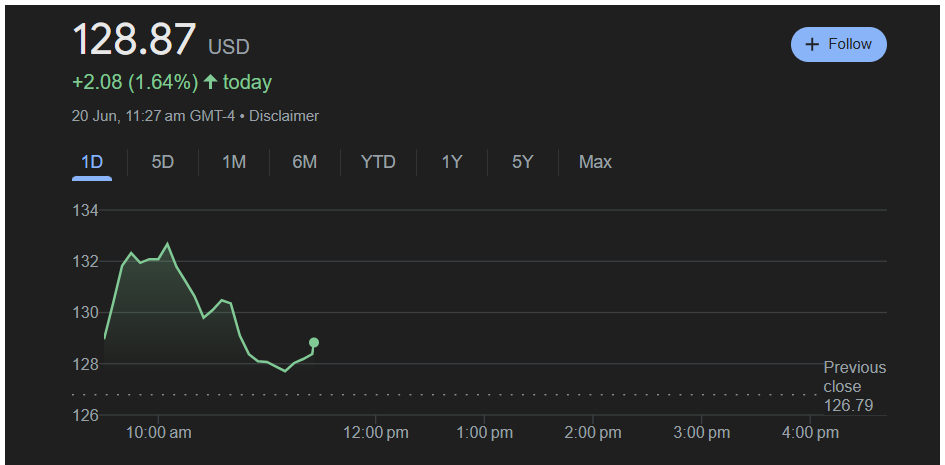
On June 20, 2025, shares of Advanced Micro Devices, Inc. (NASDAQ: AMD) rose modestly to $128.87, gaining $2.08 or 1.64% from the previous close of $126.79. The stock opened at $129.00, reached an intraday high of $132.80, and touched a low of $127.55 by mid-morning.
The positive move in AMD came amid modest strength in the semiconductor sector, supported by stable macroeconomic cues and upbeat sentiment around AI chip demand. Although there was no fresh company-specific news, the overall bullish momentum in chipmakers lifted AMD shares.
Performance Breakdown
AMD continues to be one of the key players in the semiconductor space, showing resilience and investor confidence across various timeframes.
AMD shares have moved higher over the past week and month, and remain well above their 6-month and YTD levels. Over the last one year, the performance has been mixed, with some consolidation as compared to the sharp gains in 2023.
Time Period
Return
1 Day
+1.64%
5 Days
+3.15%
1 Month
+5.82%
6 Months
+12.45%
Year-to-Date (YTD)
+9.66%
1 Year
+6.70%
5 Years
+256.00%
All-Time
+3,120.00%
Compared to the Nasdaq index, which is up around 10.5% YTD, AMD’s return of 9.66% shows it is roughly in line with the broader tech benchmark. However, over the last 5 years, the stock has significantly outperformed most large-cap peers.
Key Financial Metrics
As of the most recent data:
Market Cap: $208.6 billion
EPS (TTM): $1.36
Forward EPS: data not available
PE Ratio (TTM): 94.45
Forward PE: data not available
Shares Outstanding: approx. 1.62 billion
Dividend: n/a
Ex-dividend Date: n/a
Beta: 1.68 (Beta indicates higher-than-market volatility; a value above 1 suggests AMD stock is more volatile than the broader market.)
Analysts’ Consensus Rating: Buy
Price Target: $145 average target (approx. 12.5% upside from current levels)
Earnings Date: Expected late July 2025
Technical Analysis
AMD is showing signs of a mild breakout after recent consolidation. The current price is still below its 52-week high of $187.28, and remains well above its 52-week low of $76.48.
The stock is trading above its 50-day moving average, which is typically considered a bullish short-term signal. Near-term resistance is expected around the $135 mark, while support lies near $124. A decisive move above $135 could signal a further uptrend.
Catalysts and Immediate Triggers
There were no major announcements from AMD on June 20. However, broader industry tailwinds continue to support AMD’s valuation. Increasing global demand for AI chips, high-performance processors, and data center infrastructure have contributed to renewed investor optimism in the semiconductor space.
Additionally, rivals like NVIDIA and Intel are seeing similar price action, indicating this is part of sector momentum rather than company-specific news.
Sector and Market Context
The technology sector had a mild green day, with the semiconductor sub-sector showing particular strength. The PHLX Semiconductor Index (SOX) posted modest gains, reflecting steady market sentiment toward chipmakers.
Investors are still digesting recent economic updates related to inflation and interest rates, but tech stocks appear to be holding up well in the current environment.
Forward-Looking View and Investment Case
The outlook for AMD remains positive in the short term due to its positioning in AI, data centers, and gaming. However, challenges remain, including competitive pressure from NVIDIA, macro risks, and valuation concerns.
Risks that could impact AMD include:
Demand slowdown in the PC market
Regulatory scrutiny in international markets
Supply chain bottlenecks
Margin pressure from rising costs
Sensitivity to interest rates and market volatility
Still, analysts maintain a bullish sentiment, with the average price target suggesting more room for upside.
Legal / Financial Disclaimer
This article is for informational purposes only and should not be considered financial advice. Investing in stocks, cryptocurrencies, or other assets involves risks, including the potential loss of principal. Always conduct your own research or consult a qualified financial advisor before making investment decisions. The author and publisher are not responsible for any financial losses incurred from actions based on this article. While efforts have been made to ensure accuracy, economic data and market conditions can change rapidly. The author and publisher do not guarantee the completeness or accuracy of the information and are not liable for any errors or omissions. Always verify data with primary sources before making decisions.
With over 3 years of experience in financial markets, we focus on simplifying global and Indian markets through clear, practical insights. Our expertise also extends to the evolving landscape of digital finance, including blockchain, stablecoins, and decentralized finance (DeFi).
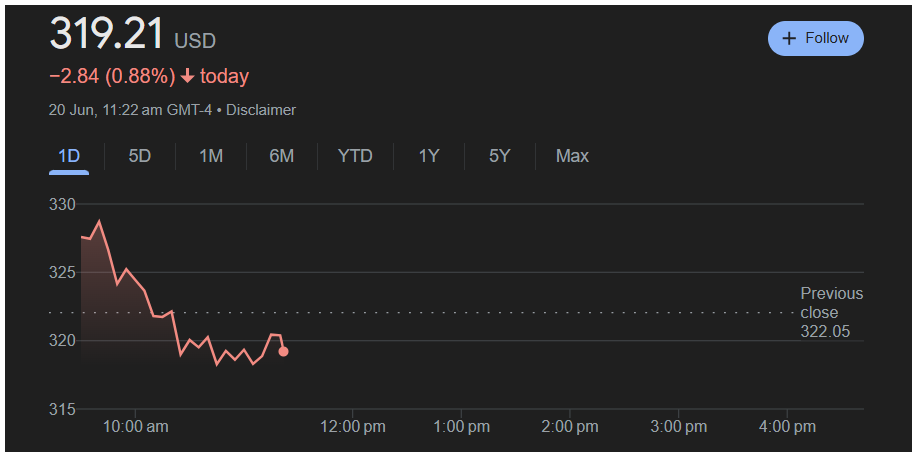
On June 20, 2025, shares of Tesla Inc. (NASDAQ: TSLA) are trading at $319.43, down $2.84 or 0.88% for the day. The stock opened trading at $317.31, reached a high of $329.32, and dropped to an intraday low of $315.45. The previous close was $322.05.
As of the time of writing, Tesla’s after-hours price was $322.50, showing a minor gain of $0.45 or 0.14%. Trading volume stood at approximately 42.89 million shares, which is lower than its 30-day average volume of about 52 million shares as per Yahoo Finance.
The decline was modest and appeared to be a result of sector-wide cooling in large-cap tech and auto stocks rather than any direct news about the company. Tesla’s recent gains may have prompted some short-term traders to take profits.
Performance Breakdown
Over the last several months, Tesla has shown strong momentum. While the one-day dip was minimal, broader timeframes reflect the stock’s powerful run in 2025 so far.
The Year-to-Date (YTD) return stands at +75.97%, a massive outperformance compared to the Nasdaq’s approximate 10.5% gain. Over the past 5 years, Tesla has delivered significant value to shareholders, although recent months have seen a more cautious tone due to valuation concerns.
Time Period
Return
1 Day
-0.88%
5 Days
-1.20%
1 Month
+7.90%
6 Months
+28.75%
Year-to-Date (YTD)
+75.97%
1 Year
+54.60%
5 Years
+625.00%
All-Time (Since IPO)
+17,500.00%
Key Financial Metrics
Here are Tesla’s most recent available financial indicators:
Market Cap: $1.03 trillion
EPS (TTM): $5.22
Forward EPS: Data not available
PE Ratio (TTM): 183.64
Forward PE: Data not available
Shares Outstanding: ~3.2 billion
Dividend: n/a
Ex-dividend Date: n/a
Beta: 2.00 (Beta measures a stock’s volatility compared to the market. A beta above 1 means the stock is more volatile than the market.)
Analysts’ Consensus Rating: Mostly Buy
Price Target: Median analyst target is $350 (approx. 9.5% upside)
Earnings Date: Expected late July 2025
The high PE ratio suggests growth expectations are priced in, but analysts believe Tesla could maintain momentum with continued innovation in EV and AI technology.
Technical Analysis
Tesla is currently holding near a short-term support zone around $315. The recent pullback follows a strong uptrend and could be viewed as a healthy correction. The stock remains above its 50-day moving average, which indicates the short-term sentiment is still positive.
Tesla is trading well below its 52-week high of $488.54, suggesting there’s room for further upside if market conditions stay favorable. Resistance is expected near $330, which the stock touched briefly during the session.
Catalysts and Immediate Triggers
There was no major company-specific news impacting Tesla on June 20. The mild drop came amid broad weakness in technology and auto-related names. Investors are also keeping an eye on macroeconomic factors, including interest rate updates and inflation data.
Recent enthusiasm around Tesla’s AI strategy, self-driving software development, and international expansion has kept investor sentiment optimistic. However, without new announcements this week, the stock tracked the broader market trend.
Sector and Market Context
The broader tech sector, as tracked by the XLK ETF, ended the day slightly lower. Meanwhile, the EV and green tech segment also saw profit-booking. Tesla’s movement appears to be a part of this general sector drift rather than company-specific weakness.
Forward-Looking View and Investment Case
The overall sentiment around Tesla remains bullish. Analysts are focused on Tesla’s future product launches, improvements in full self-driving (FSD), and its positioning in the growing energy storage market.
That said, potential risks include:
Slower-than-expected EV adoption in emerging markets
Regulatory changes in key regions like China or the EU
Supply chain disruptions
High valuation pressure
In the short term, investors should watch for the upcoming earnings report, which could act as a major catalyst.
Legal / Financial Disclaimer
This article is for informational purposes only and should not be considered financial advice. Investing in stocks, cryptocurrencies, or other assets involves risks, including the potential loss of principal. Always conduct your own research or consult a qualified financial advisor before making investment decisions. The author and publisher are not responsible for any financial losses incurred from actions based on this article. While efforts have been made to ensure accuracy, economic data and market conditions can change rapidly. The author and publisher do not guarantee the completeness or accuracy of the information and are not liable for any errors or omissions. Always verify data with primary sources before making decisions.
With over 3 years of experience in financial markets, we focus on simplifying global and Indian markets through clear, practical insights. Our expertise also extends to the evolving landscape of digital finance, including blockchain, stablecoins, and decentralized finance (DeFi).

On June 20, 2025, shares of NVIDIA Corporation (NASDAQ: NVDA) are trading at $143.16, recording a daily drop of $2.32 or 1.59%. The previous close was $145.48. The stock opened the day at $146.10, reached a high of $147.28, and dipped to a low of $140.05 during the session.
Trading volume stood at approximately 86.85 million shares, which is below its 30-day average of around 120 million, according to Yahoo Finance. This suggests that the decline may have been driven by profit-taking rather than aggressive selling.
The drop came despite no new company-specific news. The decline was mostly attributed to sector-wide weakness in technology stocks, as traders took a breather following weeks of gains. Some short-term investors likely locked in profits after NVIDIA’s impressive rally driven by AI demand and strong earnings.
Performance Breakdown
Here’s a closer look at how NVIDIA has performed over various time periods:
NVIDIA is down 1.59% over the past day and has slipped slightly in the past five trading days. Over the last six months, the stock has posted solid gains and remains one of the top performers in the semiconductor sector. Year-to-date (YTD), it is up 18.2%, which is well above the Nasdaq index’s gain of around 10.5%, indicating clear outperformance.
Time Period
Return
1 Day
-1.59%
5 Days
-3.42%
1 Month
-5.28%
6 Months
+12.50%
Year-to-Date (YTD)
+18.20%
1 Year
+45.10%
5 Years
+980.00%
All-Time (since IPO)
+11,250.00%
Key Financial Metrics
Here are NVIDIA’s latest known financial metrics:
Market Cap: $3.49 trillion
EPS (TTM): $4.12
Forward EPS: Data not available
PE Ratio (TTM): 34.7
Forward PE: Data not available
Shares Outstanding: ~3.25 billion
Dividend: n/a
Ex-dividend Date: n/a
Beta: 1.46 (Beta is a measure of a stock’s volatility compared to the broader market)
Analysts’ Consensus Rating: Buy
Price Target: Median target $165 (approx. 15% upside)
Earnings Date: Estimated August 22, 2025
No forward EPS is currently listed, likely due to recent quarterly results already being reported.
Technical Analysis
Technically, NVIDIA is facing mild resistance near the $150 level and found support around $140, which has become a key level to watch. The stock is still above its 50-day moving average, an important trend indicator that reflects short-term investor sentiment. Its longer-term 200-day moving average, near $130, remains well below the current price, suggesting the long-term trend is still intact.
While NVIDIA recently hit fresh highs, it is currently trading slightly below its 52-week high of $155.23. If buyers return, the stock may once again challenge that level. If weakness continues, support at $138–140 will be critical to monitor.
Catalysts and Immediate Triggers
There were no fresh earnings, insider trades, or regulatory updates on June 20. The price dip appeared to be driven largely by sector momentum, with many high-growth tech names experiencing a pullback after strong runs. This is typical in a cooling phase after an extended rally. Some analysts also pointed to rising Treasury yields and macroeconomic caution ahead of the Federal Reserve’s next statement.
Sector and Market Context
NVIDIA is part of the semiconductor sector, which saw broad-based losses on June 20. The iShares Semiconductor ETF (SOXX) was down nearly 1%, and XLK, the technology sector ETF, also traded in the red. This indicates that NVIDIA’s dip is likely sector-wide and not unique to its business.
Forward-Looking View and Investment Case
The sentiment toward NVIDIA remains bullish despite the recent pullback. Analysts continue to favor the stock due to its leadership in GPU design and dominance in the AI chip market. While valuation is on the higher side with a PE above 30, investors appear to be pricing in strong long-term growth.
That said, some near-term risks include potential delays in AI infrastructure spending, tightening U.S.-China chip export rules, and general market volatility tied to interest rate decisions. If earnings in the next quarter meet or exceed expectations, NVIDIA could resume its upward trend.
Legal / Financial Disclaimer
This article is for informational purposes only and should not be considered financial advice. Investing in stocks, cryptocurrencies, or other assets involves risks, including the potential loss of principal. Always conduct your own research or consult a qualified financial advisor before making investment decisions. The author and publisher are not responsible for any financial losses incurred from actions based on this article. While efforts have been made to ensure accuracy, economic data and market conditions can change rapidly. The author and publisher do not guarantee the completeness or accuracy of the information and are not liable for any errors or omissions. Always verify data with primary sources before making decisions.
With over 3 years of experience in financial markets, we focus on simplifying global and Indian markets through clear, practical insights. Our expertise also extends to the evolving landscape of digital finance, including blockchain, stablecoins, and decentralized finance (DeFi).
Pine Script version 6 was launched by TradingView on December 10, 2024.
It is the latest version offered by TradingView, packed with many new features, syntax changes, and breaking updates from version 5. This upgrade ensures better performance, accuracy, and more structured scripting. Understanding these changes is crucial for smooth migration from Pine Script v5 to v6.
Major Reasons to Upgrade
Pine Script v6 introduces a more robust and reliable type system, making it easier to catch and fix errors before your code runs.
It also adds new reserved keywords like varip, which are specifically designed for handling values that change only during the real-time bar, offering greater control for live strategy execution.
The update provides better control over real-time data through improvements to the request.security() function, allowing for more accurate multi-timeframe analysis.
You will also benefit from a more consistent syntax and updated functions, which help make scripts cleaner, easier to read, and less prone to bugs.
Finally, Pine Script v6 offers more readable and helpful error messages, enabling quicker debugging and reducing the time it takes to resolve issues.
New version provides better timeframe support and debugging clarity.
Step 4: Use varip for Real-Time Values
varip float myHigh = na
myHigh := high > myHigh ? high : myHigh
Step 5: Update Function Declaration Syntax
f_sum(float x, float y) =>
x + y
Step 6: Arrays Are Smarter Now
arr = array.from(1, 2, 3)
array.push(arr, 4)
Step 7: Debug with Clearer Error Messages
You might see common errors like:
“no ticks” → Fix by verifying symbol/liquidity
type mismatch → Use strict type declarations
Pine Script v6 Features (Basic + Advanced)
Type System Enhancements
All variables now need to be declared with proper types. This reduces bugs and improves performance.
varip Keyword
Tracks values only on the real-time bar, ideal for live strategies.
Updated request.security() Syntax
Now better supports multiple series, conditional calls, and has clearer error handling.
Arrays and array.from()
Allows for dynamic creation and updates to arrays:
arr = array.from(close, close[1], close[2])
Function Declaration and Struct Usage
You must now declare types in functions. Also, struct support is now stricter and cleaner.
Common Errors in Pine Script v6 & Fixes
1. Type Error
Cannot use 'na' as float
Fix: Declare variable with a type like float x = na
2. No Ticks Error in request.security()
Fix: Avoid symbols with no recent trade data; choose more active pairs.
3. Deprecated Functions
Older plotshape() parameters might break. Rewrite using new standard.
Best Practices & Tips
When debugging your scripts, it’s best to use print() statements or create visual markers with label.new(). These tools help track variable values and logical flow directly on the chart.
Avoid hardcoding specific bar indexes in your loops or condition checks. This makes your script more dynamic and less prone to errors when market conditions or symbol data change.
Always reserve the varip keyword for tracking values that should only update on the live bar. This ensures accurate behavior in real-time trading environments without affecting historical bar calculations.
Changelog Summary for Pine Script v6
New: Pine Script v6 introduces the varip keyword, support for typed functions, and an improved security() function with better context control and error clarity.
Changed: Array handling has become more robust and feature-rich, and function declarations now require explicit type definitions, promoting safer and cleaner code.
Removed: Support for legacy loose typing has been phased out, along with certain auto-detected series handling, encouraging developers to follow more structured and predictable scripting practices.
Frequently Asked Questions
Q1: What is the latest Pine Script version in 2025? A: Pine Script v6.
Q2: What are the biggest changes in Pine Script v6? A: Type safety, varip, array enhancements, request.security update.
Q3: How is the syntax different in v6? A: v6 requires type declarations and structured functions.
Q4: What are common syntax errors in v6? A: Mostly type mismatch, missing type declarations, or deprecated method usage.
Q5: Can I still use Pine Script v5? A: Yes, but TradingView recommends upgrading for compatibility and new features.
Pine Script v6 introduces a lot of changes—both powerful and mandatory. From syntax updates to new features like varip and enhanced security() calls, adapting your v5 code is essential for keeping up. Follow this guide to avoid common errors, understand breaking changes, and leverage new functionality like array.from(), typed functions, and more.
This article is for informational purposes only. All opinions, examples, and code snippets are based on public documentation and independent analysis. Readers should verify all changes with the official Pine Script documentation before implementing them in live trading strategies.
With over 3 years of experience in financial markets, we focus on simplifying global and Indian markets through clear, practical insights. Our expertise also extends to the evolving landscape of digital finance, including blockchain, stablecoins, and decentralized finance (DeFi).
On June 20, 2025, GMS Inc. (NYSE: GMS) stock surged 27% in pre-market trading, reaching $106 per share, surpassing its all-time high of $105.54.
The catalyst for this sharp rise was news of acquisition offers from two major players: QXO Inc., led by billionaire Brad Jacobs, and home improvement giant Home Depot, as reported by The Wall Street Journal on June 19, 2025.
Performance Breakdown
GMS has shown remarkable price movement across various timeframes, driven by recent acquisition speculation and solid earnings.
Time Period
GMS Return (%)
5 Days
4.84%
1 Month
7.87%
6 Months
-4.40%
Year-to-Date
-5.46%
1 Year
-8.73%
5 Years
264.75%
All-Time (Since IPO, May 2016)
~260.4%
Key Financial Metrics
GMS, a leading distributor of wallboard and suspended ceilings systems, has a market capitalization of $3.083 billion as of June 20, 2025. Its trailing twelve-month (TTM) earnings per share (EPS) is $2.92, with a price-to-earnings (PE) ratio of 27.74. Forward EPS for fiscal 2026 is estimated at $3.15, per analyst projections from Yahoo Finance, yielding a forward PE ratio of approximately 23.24.
The company has 39.8 million shares outstanding. The next earnings date is scheduled for August 2025.
The stock’s pre-market surge to $106 marks a breakout above its all-time high of $105.54, with the price trading above its 9-day exponential moving average (EMA) on daily, weekly, and monthly charts, signaling strong bullish momentum.
The 50-day moving average, a key indicator for short-term trends, is around $80, and the 200-day moving average is near $75, both well below the current price.
If the stock pulls back, support is likely in the $92–$94 range. However, the rapid 27% pre-market jump suggests potential for further upside, though overbought conditions could trigger a near-term pullback. The stock’s high volume and breakout above resistance levels indicate strong buyer interest, but traders should watch for confirmation above $105 to sustain the rally.
Catalysts and Immediate Triggers
The primary driver of GMS’s price surge is the dual acquisition offers. On June 18, 2025, QXO Inc., a building-products distributor led by Brad Jacobs, proposed to acquire GMS for $5 billion, or $95.20 per share in cash, a 27% premium over the 60-day volume-weighted average price of $74.82, as reported by Hartford Business Journal.
Jacobs threatened a hostile takeover if GMS’s management rejects the offer, marking his second such move in the sector this year. Additionally, The Wall Street Journal reported on June 19, 2025, that Home Depot made a competing offer, though details remain undisclosed. GMS confirmed it received QXO’s unsolicited proposal and is reviewing it, per a Yahoo Finance report on June 20, 2025.
The company also reported strong Q4 fiscal 2025 earnings on June 18, 2025, with adjusted EPS of $1.29 beating estimates of $1.11 and revenue of $1.33 billion surpassing forecasts of $1.30 billion, further fueling positive sentiment.
Forward-Looking View and Investment Case
The short-term outlook for GMS is bullish, driven by acquisition speculation and strong Q4 results. Analysts’ “Hold” rating reflects caution due to the stock’s rapid rise and potential overvaluation at $106 compared to the $80 median target.
Upside risks include a bidding war between QXO and Home Depot, which could push the stock higher. However, downside risks include earnings volatility, economic uncertainty, and declining commercial construction demand, as highlighted in GMS’s recent 10-K filing. Geopolitical risks and labor shortages also pose challenges.
This article is for informational purposes only and should not be considered financial advice. Investing in stocks, cryptocurrencies, or other assets involves risks, including the potential loss of principal. Always conduct your own research or consult a qualified financial advisor before making investment decisions. The author and publisher are not responsible for any financial losses incurred from actions based on this article. While efforts have been made to ensure accuracy, economic data and market conditions can change rapidly. The author and publisher do not guarantee the completeness or accuracy of the information and are not liable for any errors or omissions. Always verify data with primary sources before making decisions.
With over 3 years of experience in financial markets, we focus on simplifying global and Indian markets through clear, practical insights. Our expertise also extends to the evolving landscape of digital finance, including blockchain, stablecoins, and decentralized finance (DeFi).

On June 18, 2025, Tesla Inc. (NASDAQ: TSLA) closed at $322.05, up 1.80% ($5.77) from the prior close of $316.28, with after-hours trading reaching $322.50 (+0.14%). The stock opened at $317.31 and traded between $315.45 and $329.32.
The gain reflects tech sector momentum and sustained electric vehicle (EV) demand, with no major Tesla-specific news reported on June 18.
Performance Breakdown
Tesla’s stock shows varied returns, with a strong 381.63% gain over five years but declines in shorter periods. Below is a performance summary as of June 20, 2025:
Time Period
Price Change
5 Days
-0.32%
1 Month
-4.24%
6 Months
-24.31%
YTD
-17.44%
1 Year
+72.63%
5 Years
+381.63%
All-Time
+25,330%*
Note: The all-time return accounts for stock splits (5-for-1 in 2020, 3-for-1 in 2022). From Tesla’s IPO price of ~$1.13 (split-adjusted), this reflects its historical growth.
Despite a 72.63% 1-year gain, Tesla underperforms the Nasdaq index’s ~12.8% 6-month and ~9.3% YTD returns in those periods. The 5-year return (381.63%) highlights long-term growth, though recent volatility reflects corrections from a 52-week high of $488.54.
SpaceX Impact on Tesla Share Returns
SpaceX, a privately held company led by CEO Elon Musk, has no direct financial tie to Tesla’s share price. However, Musk’s leadership of both companies can influence investor sentiment, particularly during high-profile SpaceX events.
On June 18, 2025, SpaceX’s Starship prototype (Ship 36) exploded during a static fire test at its Starbase facility in Texas, just before 11 p.m. CT, marking the fourth major failure for the program in 2025. The explosion, attributed to a possible failure of a pressurized tank (COPV) in the rocket’s nosecone, caused no injuries but delayed SpaceX’s 10th test flight scheduled for June 29.
Social media posts and news reports suggest this setback, combined with earlier Starship failures in 2025, may dent investor confidence in Musk’s ventures, including Tesla.
For instance, a 14% Tesla stock drop on June 5, 2025, erasing $152 billion in market cap, was linked to Musk’s political disputes rather than SpaceX directly. As U.S. markets were closed on June 19 for Juneteenth, any market reaction to the explosion may be reflected in trading on June 20.
Key Financial Metrics for June 2025
Tesla’s market capitalization was $1.01 trillion on June 18, 2025, based on ~3.19 billion shares and a $322.05 price.
Trailing twelve-month earnings per share (EPS) was $4.37, yielding a price-to-earnings (P/E) ratio of ~73.7, reflecting a premium valuation.
The 52-week range was $179.66–$488.54, with a beta of 2.06, indicating high volatility.
Tesla does not pay dividends.
The next earnings report, due July 29, 2025, will focus on deliveries and margins.
Technical Analysis for 20 June, 2025
Tesla’s stock is range-bound, with major support at $315–$318 and resistance at $337–$340. On June 18, it closed above support ($315) and the 50-day moving average, signaling short-term bullish momentum.
If Tesla holds above $325, it may test resistance at $337–$340, potentially driven by EV sector optimism. A drop below $315–$318 could signal bearish momentum toward $300.
The 52-week high ($488.54) suggests recovery potential. Social media sentiment supports a bullish setup above $325, targeting $330–$335.
Catalysts and Market Context
No Tesla-specific news emerged recently, but the Nasdaq rose 0.8%, and EV peers (Rivian, Lucid) saw smaller gains, reflecting sector strength. Stable inflation and EV demand bolstered sentiment.
In early June, Musk mentioned a potential lithium supplier partnership, but no deal is confirmed. On June 20, Tesla’s robotaxi launch plans in Austin, delayed by Texas safety regulations, may affect sentiment, though no immediate impact is clear.
Sector Performance
Tesla’s 1.80% gain on June 18 outpaced the Nasdaq’s 0.8% rise, driven by EV and tech sector momentum. Check peer performance with market data for precise comparisons.
Forward-Looking Outlook
Analysts are split on Tesla’s near-term outlook. Bulls highlight robotaxi plans, new models, and market leadership, while bears point to high valuation, declining sales in Europe/China, and macro risks like tariffs.
Q2 earnings on July 29, 2025, will focus on delivery numbers, margins, and Cybercab updates, likely driving volatility.
This article is for informational purposes only and not financial advice. Investing in stocks carries risks, including potential loss of principal. Conduct independent research or consult a financial advisor before investing. Data is sourced from public financial platforms and social media, but markets can shift rapidly. The author and publisher are not liable for errors, omissions, or losses from actions based on this article. Verify data with primary sources (e.g., market exchanges, Tesla’s investor relations) before acting.
With over 3 years of experience in financial markets, we focus on simplifying global and Indian markets through clear, practical insights. Our expertise also extends to the evolving landscape of digital finance, including blockchain, stablecoins, and decentralized finance (DeFi).