Will the Figma (FIG) Rally Continue After a 250% Gain on Debut?

Figma FIG NYSE Debut

Figma Inc. (NYSE: FIG) went public on July 31, 2025, pricing at $33 and raising approximately $1.22 billion by selling around 36.94 million shares. Demand was enormous – oversubscribed about 40×.

The stock opened at $85, hit an intraday high of around $124.63 (nearly +277%), and closed at $115.50, representing a 250% gain and boosting Figma’s market capitalization to roughly $67 billion by day’s end. This sets a new record for U.S. IPOs raising over $500 million.

The stock is trading at $127 in pre-market at the time of writing, up 9.96% from yesterday’s closing price of $115.50.

Financially, Figma’s Q1 2025 revenue was $228.2 million, up 46% year-over-year, with net income of $44.9 million. It reported 13 million monthly active users and claimed usage by ~95% of Fortune 500 companies. At its IPO price, the valuation was $19.3 billion, comparable to the previously proposed $20 billion acquisition by Adobe – an earlier deal terminated due to regulatory concerns in late 2023. Figma received a $1 billion breakup fee from Adobe.


Circle Internet Group (CRCL) IPO: A Crypto Counterpoint

CRCL's USDC

Circle, issuer of the USDC stablecoin, launched its IPO on June 5, 2025, pricing at $31, raising around $1.1 billion, and oversubscribed approximately 25×. It opened near $69, closed the first day at $83.23 (a 168% gain), and hit $123.49 the next day (~300% gain), before trading near $150+ within weeks.

Also Read – The Very First Post You Should Read to Learn Cryptocurrency

Figma’s IPO action is somewhat similar to the CRCL IPO launched in 2025, which also raised over $1 billion and had a strong debut and investor craze. Both IPOs were significantly oversubscribed, reflecting strong market demand during the 2025 tech IPO resurgence.


Adobe’s IPO: Perspective from the 1980s

Adobe Systems went public on August 20, 1986. Its split-adjusted IPO price was around $0.17, closing at $0.22, a modest ~29% gain. In contrast to Figma’s dramatic trajectory, Adobe’s debut was more restrained, reflecting different market dynamics in the 1980s. Adobe eventually grew to a behemoth – $158 billion market cap – through gradual expansion via its software suite.

Adobe’s failed bid to acquire Figma in 2022 highlights the shift: Figma’s standalone valuation post-IPO (~$67 billion) significantly surpasses the scuttled deal value, underscoring the company’s modern strength.


Figma vs. Circle vs. Adobe: Summary Table

MetricFigma (FIG)Circle (CRCL)Adobe (1986)
IPO Price$33$31~$0.17 (split-adjusted)
First-Day % Gain~250% (closed $115.50)~168% (closed $83.23)~29%
Peak Intraday Gain~277%~300%+ (two-day high ~$123)
Capital Raised~$1.22 billion~$1.1 billionSmall, modest float
Oversubscription~40×~25×Nan
Revenue ModelSaaS (Design platform)Stablecoin interest/reservesTraditional software sales

Can Figma’s Rally Persist?

Drivers That Support Continued Momentum
  • Massive demand & tight float: The 40× oversubscription and limited share supply sustained the initial pop.
  • Strong fundamentals: Reliable revenue base, significant MBU growth (~13 M users), and major enterprise penetration (~95 % of Fortune 500) provide a stable foundation.
  • AI powered innovation: Launch of tools like Figma Make, Dev Mode, Figma Sites, and Buzz provide differentiation in AI-enhanced design workflows.
  • IPO market revival: Figma joins a string of successful tech IPOs in 2025, signalling renewed investor appetite.
Risks That Could Trim Gains
  • High valuation: The ~$67 billion cap equates to ~11× next‒twelve-months revenue – premium for SaaS.
  • Lock‑up expiry: Around 180 days post-IPO (~late January 2026), insider sales could increase supply and pressure prices.
  • Competitive dynamics: Adobe’s entrenched position and emerging AI-backed design offerings could challenge growth.
  • Economic headwinds: Macroeconomic risks – tariffs, rising rates, or market volatility—may impact market sentiment.

This article is for informational purposes only and should not be considered financial advice. Investing in stocks, cryptocurrencies, or other assets involves risks, including the potential loss of principal. Always conduct your own research or consult a qualified financial advisor before making investment decisions. The author and publisher are not responsible for any financial losses incurred from actions based on this article. While efforts have been made to ensure accuracy, economic data and market conditions can change rapidly. The author and publisher do not guarantee the completeness or accuracy of the information and are not liable for any errors or omissions. Always verify data with primary sources before making decisions.

4 Possible Reasons Why NEGG Stock Crashed Nearly 20%

The Shipping Corporation of India Limited – stock latest AUDITED FINANCIAL RESULTS news

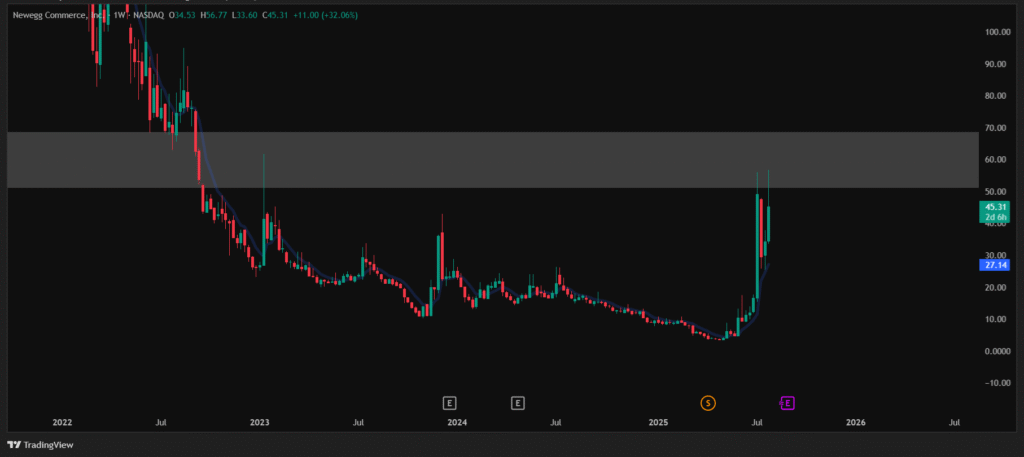
Newegg Commerce Inc. (NEGG) stock shocked retail investors today with a sharp drop of nearly 20%, falling from an opening price of $46.98 to an intraday low of $41.01, before stabilizing slightly. After a powerful rally in recent weeks, this sudden crash has raised many questions in the minds of traders and long-term investors.

Let’s take a closer look at the 4 most likely reasons behind today’s fall:

1. Selling Pressure from the $55 Supply Zone

NEGG latest chart by trading view - support and resistance

One of the most probable technical reasons for NEGG’s sharp fall is strong selling pressure from the supply zone around $55. The stock recently touched a high of $56.77, which falls right into this zone.

Historically, NEGG had formed a crucial support in the $50–$60 range. But after it broke down from this range earlier, the same zone has now turned into a resistance. As the stock retraced back to that level with a parabolic structure, it gave swing traders and short-term holders the perfect chance to sell and exit.

This kind of resistance-based selling is common after vertical rallies, especially in stocks with high volatility like NEGG.


2. Parabolic Rally Followed by Exhaustion

NEGG had been consolidating for a long time, and once it broke out, the movement was nothing short of parabolic. But when stocks rise too fast, they often run out of momentum just as quickly.

This rally lacked consistent volume spikes or major news-based triggers. So, when the price reached overextended levels, exhaustion selling kicked in – driven by both retail and institutional traders trying to book profits before a possible correction.

3. Broader Market and Sector Rotation

The internet retail sector as a whole has seen some weakness recently. Even large-cap players have faced pressure due to mixed earnings and slower e-commerce growth projections.

In such a scenario, speculative or mid-cap retail stocks like NEGG tend to fall faster, especially when overall investor sentiment turns cautious.

Investors are also rotating money into safer sectors such as energy, utilities, or dividend-yielding assets-leaving tech and e-commerce under pressure.


4. No New Fundamental Trigger to Sustain the Rally

While there was buzz around insider buying, and a temporary momentum spike followed it, there’s been no concrete news related to revenue growth, partnerships, or new launches from the company.

That means the recent rally was largely speculation-driven, and when such stocks don’t follow up with strong news or numbers, they often face sharp corrections – just like we saw today.


What Next for NEGG?

Even though the fall was sharp, some traders still believe NEGG could move higher in the coming weeks. But the path may not be easy. Given the past price behavior, expect a bumpy ride with ups and downs along the way.

The stock will likely face strong resistance in the $50–$55 range again, and unless there’s a solid fundamental trigger, the rally might remain limited.

This article is for informational purposes only and should not be considered financial advice. Investing in stocks, cryptocurrencies, or other assets involves risks, including the potential loss of principal. Always conduct your own research or consult a qualified financial advisor before making investment decisions. The author and publisher are not responsible for any financial losses incurred from actions based on this article. While efforts have been made to ensure accuracy, economic data and market conditions can change rapidly. The author and publisher do not guarantee the completeness or accuracy of the information and are not liable for any errors or omissions. Always verify data with primary sources before making decisions.

How does the stock price go up when the company goes up?

Company goes up, stock price goes up - how does that work?

As Jeff Bezos, the founder of Amazon, once said

“The company is not the stock, and the stock is not the company.”

This means that a company’s actual business and its stock price may seem related, but they are not always the same. They are connected, but not equal.

Let’s break this down in simple terms.

IPO vs Stock Market – What’s the Difference?

When a company offers its shares to the public for the first time, it’s called an IPO or Initial Public Offering. This happens in the primary market.

Here, the company directly receives money from investors. In return, investors get ownership in the form of shares. This is how the company raises capital to fund its business.

But once the IPO is over and the company is listed on a stock exchange like NSE, BSE, NASDAQ, or NYSE, any shares you buy are usually from other investors – not the company itself. This buying and selling happens in the secondary market.

So, in the stock market, you are mostly trading ownership with other people, not giving money to the company.


What Makes the Stock Price Go Up or Down?

After the IPO, the company’s stock price is driven by investor demand. This demand depends on how investors feel about the company’s performance and future potential.

If a company is:

  • Making good profits
  • Launching new products
  • Expanding into new markets
  • Managing its operations well

Then more people want to buy its shares, and the stock price usually goes up.

On the other hand, if the company is:

  • Facing losses
  • Losing market share
  • Involved in controversy
  • Or showing weak future prospects

Then investors may sell their shares, and the stock price falls.

This is why a company’s real-world success or failure affects how people value its shares in the market.


Important to Remember

A company’s stock price reaching zero does not always mean the company is bankrupt. It may just mean investors have lost confidence in its future.

Similarly, a stock trading at five hundred rupees or dollars does not always mean the company is truly worth that much. It could be due to hype, speculation, or unrealistic expectations.


A Simple Analogy – Student and Teacher

Think of a company as a student, and the investors as teachers.

Just like teachers give marks based on a student’s performance, investors assign a stock price based on the company’s financial health and future potential.

  • If the company performs well, investors give it a higher “mark” in the form of a rising stock price.
  • If the performance is poor or uncertain, the price drops—just like getting lower marks.

Also Read – Understanding the Basics of Buying, Selling, and Stop Hunting in Financial Markets


This article is for informational purposes only and should not be considered financial advice. Investing in stocks, cryptocurrencies, or other assets involves risks, including the potential loss of principal. Always conduct your own research or consult a qualified financial advisor before making investment decisions. The author and publisher are not responsible for any financial losses incurred from actions based on this article. While efforts have been made to ensure accuracy, economic data and market conditions can change rapidly. The author and publisher do not guarantee the completeness or accuracy of the information and are not liable for any errors or omissions. Always verify data with primary sources before making decisions.

Important Margin-Related Terms in Indian Stock Market That You Must Know

Complete Guide to Margin in the Indian Stock Market – Understand SPAN, Exposure, Initial, Peak, and Other Important Margins in Simple Words

Margin is the money or securities you must deposit to take or hold a position in the stock market, especially in the futures and options (F&O) segment. It is not the full value of the trade, but a fraction of it. This allows traders to use leverage, meaning they can take larger positions using a smaller capital base.

  • Margin is the money you put upfront to take a trade. Think of it as your security deposit.
  • Leverage is the additional buying power that your broker provides based on the margin you maintain. It’s like a loan that lets you control larger trades with less money.

Types of Margins in Indian Capital Markets

1. SPAN Margin (Standard Portfolio Analysis of Risk)

SPAN margin is the minimum margin required to cover expected losses from a one-day move in your position. It is calculated by the exchange using a risk-based system. It varies based on the risk and volatility of each contract.

Example: If you buy 1 lot of NIFTY futures, the SPAN margin may be ₹50,000. This value is not fixed and may change with volatility.

2. Exposure Margin

This is charged over and above SPAN to cover unexpected or extreme market movements. It serves as an additional buffer against market risk.

Example: If the SPAN is ₹50,000 and the exposure margin is ₹30,000, you need ₹80,000 in total to initiate the trade.

3. Total Initial Margin

This is the sum of SPAN Margin and Exposure Margin. You must have this total amount in your account before taking an F&O position.

Formula: Total Initial Margin = SPAN Margin + Exposure Margin

4. Premium Margin (for Options Buyers)

When buying options, you don’t need to maintain SPAN or exposure margin. You only pay the full premium upfront, which is called the premium margin.

Example: If a call option has a premium of ₹200 and the lot size is 50, your premium margin would be ₹10,000.

5. Mark to Market (MTM) Margin

MTM margin represents the daily gain or loss based on the difference between your entry price and the day’s closing price.

This margin is applicable to futures and also to short (sold) options positions. However, options buyers don’t face daily MTM charges, as their maximum loss is limited to the premium paid.

Example: If you buy NIFTY futures at ₹20,000 and it closes at ₹19,950, you lose ₹50 per unit. This loss is debited from your account that day.

6. Additional Margin

SEBI or exchanges may impose additional margins during volatile market conditions or special events. This is a temporary measure but mandatory when applied.

Example: During events like Union Budget or elections, an additional 10% margin may be imposed to curb speculation.

7. Special Margin

This is imposed on specific stocks or segments that show unusual price or volume movements. It aims to control speculative activity or price manipulation in that particular stock.

Example: If a small-cap stock suddenly rises 70–80% in a few sessions without fundamental news, a special margin may be applied.

8. Maintenance Margin

After taking a position, this is the minimum balance that you must maintain in your account. If your margin balance falls below this level, you will get a margin call to deposit more funds.

9. Margin Shortfall

This occurs when you fail to maintain the required margins (initial and MTM). A margin shortfall may lead to penalties, interest charges, or forced closure of your positions by the broker.

10. Delivery Margin

For F&O contracts that result in physical delivery, exchanges may require an extra delivery margin near expiry. This ensures that both buyer and seller are capable of fulfilling the delivery obligation.

11. Peak Margin

Introduced by SEBI in 2021, peak margin is the highest margin requirement at any point during the trading day. Brokers must collect this maximum margin from clients, reducing the ability to offer excessive intraday leverage.

12. Intraday Margin

Earlier, brokers offered high intraday leverage for trades that were squared off within the day. But under SEBI’s peak margin framework, this is now restricted. Brokers can no longer offer excessively low intraday margins unless the client has funded the position sufficiently.

13. VaR Margin (Value at Risk)

This applies to the cash (equity) segment and represents the margin needed to protect against losses in 99% of trading scenarios. Stocks with higher volatility attract higher VaR margins.

14. ELM (Extreme Loss Margin)

Also applicable in the cash segment, ELM covers rare or extreme events that go beyond the VaR calculation. Exchanges collect both VaR and ELM together.

Total margin in the cash segment = VaR Margin + ELM

15. Pledged Margin

If you don’t have enough cash, you can pledge your shares to generate margin. This is called Margin Against Shares (MAS). However, a haircut is applied to the pledged value, meaning you don’t receive 100% of the value as usable margin.

Example: If you pledge ₹1,00,000 worth of shares and the haircut is 20%, you will get ₹80,000 as usable margin.


Summary Table

Type of MarginApplies ToPurpose
SPAN MarginF&OCovers expected daily market risk
Exposure MarginF&OExtra buffer for unexpected moves
Total Initial MarginF&OSPAN + Exposure
Premium MarginOptions BuyerFull premium payment only
MTM MarginFutures, Short OptionsDaily settlement of gains/losses
Additional MarginAllExtra margin in volatile situations
Special MarginAllStock-specific speculative control
Maintenance MarginAllMinimum balance to hold positions
Margin ShortfallAllWhen margin requirement is unmet
Delivery MarginF&OFor physical delivery contracts
Peak MarginAllMax margin during the day
Intraday MarginIntraday TradesShort-term trades (restricted now)
VaR MarginCash SegmentRisk margin based on price movement
ELMCash SegmentExtra buffer for rare price swings
Pledged MarginF&OMargin from pledged shares

This article is for informational purposes only and should not be considered financial advice. Investing in stocks, cryptocurrencies, or other assets involves risks, including the potential loss of principal. Always conduct your own research or consult a qualified financial advisor before making investment decisions. The author and publisher are not responsible for any financial losses incurred from actions based on this article. While efforts have been made to ensure accuracy, economic data and market conditions can change rapidly. The author and publisher do not guarantee the completeness or accuracy of the information and are not liable for any errors or omissions. Always verify data with primary sources before making decisions.

6 Main Methods a Company Can Issue Shares

To grow their operations, expand into new markets, or develop new products, companies often need additional capital. One of the primary ways they raise this capital is by issuing shares. Depending on their financial goals and legal structure, companies have multiple methods available to issue these shares. Each method has its own rules, process, and audience.

This article explains the six main methods through which companies can issue shares, written in simple and clear language.

1. Public Issue (IPO and FPO)

A public issue is the most common and widely recognized method of issuing shares. In this method, the company offers its shares to the general public through a stock exchange.

When a company offers its shares to the public for the first time, it is known as an Initial Public Offering or IPO.

If the company is already listed and decides to issue more shares to raise additional capital, it is called a Follow-on Public Offer or FPO.

Companies choose this route when they want to raise a large amount of capital and get listed on the stock exchange. Public issues are strictly regulated by government bodies like SEBI in India or the SEC in the United States to ensure transparency and investor protection.


2. Private Placement

Private placement is a method where a company issues its shares to a selected group of investors rather than to the general public. These investors may include banks, mutual funds, venture capital firms, or high-net-worth individuals. This method is faster and involves less regulatory compliance than a public issue, making it an attractive option for companies that need quick funding.

In India, the number of investors in a private placement is legally restricted to not more than 200 in a financial year. Companies usually choose this method when they want to raise funds efficiently without the delays and costs associated with public offerings.

For example, MSEI is planning to raise ₹1,000 crore by issuing 500 crore shares through private placement.


3. Rights Issue

In a rights issue, the company offers new shares to its existing shareholders in proportion to the number of shares they already own. This means that if a shareholder owns 100 shares, and the company announces a 1:5 rights issue, they have the right to buy 20 additional shares.

The shares are usually offered at a discounted price to encourage existing shareholders to invest more in the company. This method allows companies to raise additional funds while ensuring that control and ownership remain with the current investors. It is a fair and transparent method to raise capital without diluting existing ownership too much. Many companies prefer this method during expansion or restructuring phases.


4. Bonus Issue

A bonus issue is a method where the company issues additional shares to existing shareholders without charging them anything. These shares are given free of cost and are usually issued from the company’s accumulated reserves or retained earnings. The bonus shares are distributed in a specific ratio, such as one bonus share for every two shares held.

Although no fresh capital is raised through a bonus issue, it serves as a way to reward existing shareholders and increase the total number of shares in the market. This can also improve the stock’s liquidity, making it more attractive to small investors.

For instance, if a company announces a 2:1 bonus issue, shareholders will receive one extra share for every two shares they already hold.


5. ESOP and Sweat Equity

Companies often offer shares to employees and key personnel through methods like the Employee Stock Option Plan (ESOP) or sweat equity. In an ESOP, employees are given the option to purchase shares of the company at a fixed price after a certain period. This serves as a long-term incentive and helps retain talented employees.

Sweat equity refers to shares issued to employees or directors in return for their contribution in the form of skills, expertise, or intellectual property rather than cash. These methods not only build employee loyalty but also align their interests with the company’s long-term growth.

Many startups use ESOPs to attract and motivate top talent when they are unable to offer high salaries.


6. Preferential Allotment

Preferential allotment is a method in which shares are issued to a specific group of individuals or institutions at a pre-agreed price. Unlike private placement, which is limited in number, preferential allotment is often used for strategic purposes such as mergers, acquisitions, or raising capital from known investors.

This method requires approval from shareholders through a special resolution and follows regulatory procedures to ensure transparency. Companies prefer preferential allotment when they want to bring in strategic partners or promoters without going through the lengthy process of a public issue.

For instance, a company might issue shares to a private equity firm as part of a strategic alliance


This article is for informational purposes only and should not be considered financial advice. Investing in stocks, cryptocurrencies, or other assets involves risks, including the potential loss of principal. Always conduct your own research or consult a qualified financial advisor before making investment decisions. The author and publisher are not responsible for any financial losses incurred from actions based on this article. While efforts have been made to ensure accuracy, economic data and market conditions can change rapidly. The author and publisher do not guarantee the completeness or accuracy of the information and are not liable for any errors or omissions. Always verify data with primary sources before making decisions.

When Does No Tax on Overtime Start & How Does It Work?

The “No Tax on Overtime” provision, part of the recently passed One Big Beautiful Bill Act (H.R. 1), is making headlines for its potential to increase take-home pay for millions of American workers. Signed into law by President Trump on July 4, 2025, the bill eliminates federal income tax on overtime earnings and tips for qualifying individuals starting January 1, 2025.

This article explains how the bill works, who qualifies, and what changes workers and employers should expect.

What Is the “No Tax on Overtime” Bill?

The “No Tax on Overtime” proposal grants a federal income tax deduction for overtime pay, targeting non-exempt employees under the Fair Labor Standards Act (FLSA). These workers typically receive time-and-a-half for hours worked beyond 40 in a workweek. The provision is a key part of H.R. 1, also known as the One Big Beautiful Bill, spearheaded by the GOP and endorsed by President Donald Trump.

The bill includes provisions for a deduction of up to $12,500 for single filers and $25,000 for joint filers on eligible overtime income. These deductions apply to tax years 2025 through 2028 and phase out for individuals earning over $150,000 and couples over $300,000 annually.

A separate bill, the Overtime Pay Tax Relief Act of 2025 (H.R. 561), proposed a partial deduction capped at 20% of wages, but it has not passed. Similarly, Senate Bill S. 1046, which proposed a full exemption, was not incorporated into the final version of H.R. 1.

Importantly, while overtime pay becomes exempt from federal income tax, FICA taxes (Social Security and Medicare) still apply.

What Is the “One Big Beautiful Bill”?

Passed by the House on May 22, re-approved on July 3, and cleared by the Senate on July 1, 2025, with Vice President JD Vance casting the deciding vote, the One Big Beautiful Bill Act is a sweeping tax and budget reform law. It delivers several key campaign promises from the 2024 Trump campaign, including:

  • No federal income tax on tips and overtime
  • A deduction for certain Social Security income (not a full exemption)
  • An extension of the 2017 Tax Cuts and Jobs Act provisions
  • Auto loan interest deductibility
  • Adjustments to Medicaid and border security spending

Republican lawmakers, including House Ways and Means Chairman Jason Smith, call it the largest tax cut in U.S. history. However, nonpartisan estimates from the Tax Policy Center and Tax Foundation suggest the total cost could reach $3 to $5 trillion over the next decade, with concerns over the potential deficit impact and inequities in the tax code.

How Will the Bill Affect Your Paycheck?

Eligible workers will begin earning tax-free overtime starting January 1, 2025, but changes in paycheck withholding may not occur immediately. The IRS is expected to update federal withholding tables by 2026. Until then, employees will need to claim the deduction when filing their 2025 tax returns in early 2026.

To illustrate the impact:

A worker earning $20 per hour, who works 10 overtime hours weekly at $30/hour, earns $300 in weekly overtime – or $15,600 annually. At a 22% tax bracket, this worker currently pays around $3,432 in federal income tax on that amount. Under the new law, up to $12,500 of that can be deducted, reducing federal income tax liability by about $2,750, depending on their tax situation.

However, Social Security (6.2%) and Medicare (1.45%) taxes will still apply, reducing net savings somewhat.

Employers are required to separately track and report overtime earnings on W-2 forms. Payroll systems will need updating, and HR departments should prepare to explain these changes to employees. Note that state income taxes will still apply unless states pass their own exemptions (Alabama, for instance, has one expiring in June 2025).

Are Tips Included?

Yes. The no tax on tips provision allows eligible workers to deduct up to $25,000 in tip income per year ($50,000 for joint filers), subject to the same income thresholds and time limits (2025–2028). This applies to:

  • Employees (e.g., restaurant servers, salon workers)
  • Gig workers and independent contractors who receive qualified tips

Again, while tips are exempt from federal income tax, they remain subject to FICA taxes, and the deduction does not apply to non-cash tips or service charges.

Employers must report tips separately on W-2s. Independent contractors must track tips for Form 1099-NEC or 1099-K. Critics argue that this could lead to administrative burdens and even “tip inflation” or classification abuse by businesses.

When Does No Tax on Overtime Start?

The law takes effect for taxable years beginning January 1, 2025, and applies through December 31, 2028, unless extended by Congress.

Although the bill is now signed into law, most workers will only notice the benefit when filing their 2025 tax returns in early 2026. The IRS is expected to issue revised withholding guidance by late 2025 or early 2026.

Employers and payroll providers should begin tracking eligible income streams—overtime and tips—separately to ensure compliance with W-2 reporting standards and support accurate tax filings.

Has the Bill Been Passed?

Yes. The No Tax on Overtime and No Tax on Tips provisions are now law under the One Big Beautiful Bill, signed by President Trump on July 4, 2025. The Senate approved the package by a 51–50 vote on July 1, with the House concurring on July 3. IRS implementation guidance is expected in the coming months.

Frequently Asked Questions (FAQ)

Is overtime currently taxed in the U.S.?

Yes. Before 2025, overtime pay is taxed like regular wages—federal income tax, Social Security, and Medicare apply. Starting in 2025, federal income tax will no longer apply to qualifying overtime income, but FICA taxes remain.

Who qualifies?

Non-exempt workers earning less than $160,000 (or $300,000 for joint filers) with a valid Social Security number qualify. Highly compensated employees and independent contractors are not eligible for the overtime tax break.

Will part-time workers benefit?

Only if they work more than 40 hours in a week and are classified as non-exempt under the FLSA. Most part-timers won’t see significant changes.

What’s in the Overtime Tax Relief?

The bill provides an annual deduction on overtime earnings: $12,500 for individuals, $25,000 for joint filers, phasing out beyond $150,000/$300,000. It does not eliminate all taxes on overtime—payroll taxes still apply.

Do states offer similar exemptions?

Most states do not. Alabama implemented a temporary exemption through June 2025, and others like Connecticut and Delaware are considering similar measures. Federal law does not override state income tax unless states act independently.

Conclusion

The No Tax on Overtime and No Tax on Tips provisions are now officially part of U.S. tax law, promising real benefits for hourly and tipped workers. Although full withholding changes may not show up in paychecks until 2026, the law retroactively applies to all qualifying income from January 1, 2025. Employers and workers alike should prepare now by tracking income accurately and consulting tax professionals to maximize savings.

This article is for informational purposes only and should not be considered financial advice. Investing in stocks, cryptocurrencies, or other assets involves risks, including the potential loss of principal. Always conduct your own research or consult a qualified financial advisor before making investment decisions. The author and publisher are not responsible for any financial losses incurred from actions based on this article. While efforts have been made to ensure accuracy, economic data and market conditions can change rapidly. The author and publisher do not guarantee the completeness or accuracy of the information and are not liable for any errors or omissions. Always verify data with primary sources before making decisions.

2 Reasons Robinhood Stock is Dropping

hood stock latest news

Shares of Robinhood Markets Inc (NASDAQ: HOOD) declined sharply Thursday morning, trading at $94.21, down $3.77 or 3.85% as of 10:24 AM ET. The stock is reversing after a high-profile rally, pressured by fresh doubts and technical resistance.

Robinhood stock latest news

Why Is Robinhood Falling?

OpenAI Denial Hits Tokenized Shares Sentiment

Robinhood shares had initially surged after the company launched tokenized shares for private giants like OpenAI and SpaceX, promoting the products as a way for retail investors to access Silicon Valley startups via blockchain.

However, OpenAI quickly issued a strong statement on X, denying any partnership with Robinhood, clarifying that it had never authorized any transfer of its equity, and explicitly rejecting any endorsement of these offerings. That swift denial rattled market confidence and triggered a rapid reversal from fresh highs.

HOOD: Technical Outlook for July 2025

HOOD candlestick chart by trading view

Robinhood had broken its all-time high of $85 on June 25, closing above it on June 30, and touched $100 for the first time on July 2. This move encouraged profit booking by traders.

Now, price action shows a double-top pattern forming around the $100 mark, which could continue to pressure the stock unless it breaks out decisively above that resistance. If Robinhood fails to hold support near $89.70, the next support area could be in the $74–79 zone, followed by a stronger level between $62–67 if selling deepens.

On the hourly timeframe, the Relative Strength Index (RSI) is near 50, indicating the stock is still far from oversold territory.

Also Read – Everything You Need to Know About the Dollar Index in 2025

Recent Performance Snapshot

The company holds a market capitalization of $82.87 billion with a trailing price-to-earnings ratio of 53.90 and earnings per share of $1.75. Robinhood’s next earnings announcement is expected on July 30, 2025. Year to date, the stock has surged 153.17%, far outperforming the S&P 500’s gain of 6.63%. Over one year, Robinhood is up 312.10% versus the S&P 500’s 13.27%, and its three-year return is an impressive 1,053.18% compared to the broader index’s 63.95%. Over the past five years, Robinhood has gained 148.24%, modestly outpacing the S&P 500’s 100.37%.

This article is for informational purposes only and should not be considered financial advice. Investing in stocks, cryptocurrencies, or other assets involves risks, including the potential loss of principal. Always conduct your own research or consult a qualified financial advisor before making investment decisions. The author and publisher are not responsible for any financial losses incurred from actions based on this article. While efforts have been made to ensure accuracy, economic data and market conditions can change rapidly. The author and publisher do not guarantee the completeness or accuracy of the information and are not liable for any errors or omissions. Always verify data with primary sources before making decisions.

Should You Go for Figma’s IPO? – 8 Things to Consider

Figma, a leading cloud-based collaborative design platform, has filed for an initial public offering (IPO), generating significant excitement among investors.

Figma, the widely used cloud-based collaborative design platform, has officially filed for its highly anticipated initial public offering (IPO), capturing significant attention among technology investors. While this article does not make a buy or sell recommendation, it provides eight critical factors you should weigh before deciding whether Figma’s IPO fits your investment goals.

1. IPO Date, Listing Timeline, and Exchange Details

Figma filed its S-1 registration with the U.S. Securities and Exchange Commission (SEC) on July 1, 2025, confirming plans to list on the New York Stock Exchange under the ticker symbol FIG. Industry analysts suggest the IPO will take place in late summer or early fall 2025, possibly as early as August if the SEC review progresses smoothly.

Trading for FIG shares will occur during normal NYSE hours (9:30 AM–4:00 PM ET), with pre-market (4:00 AM–9:30 AM ET) and after-hours (4:00 PM–8:00 PM ET) trading potentially available through certain brokers.

  • Advantage: The NYSE listing brings high liquidity and investor trust.
  • Risk: SEC approval delays could push the listing into September or beyond.

2. IPO Price, Valuation, and Market Cap

Figma has not yet disclosed the specific IPO share price or offering size in its S-1. However, the company was valued at $12.5 billion during a 2024 private tender transaction. Analysts expect a public valuation in the range of $15 billion to $20 billion, depending on pricing and demand.

Industry sources, including Renaissance Capital, estimate the IPO could raise as much as $1.5 billion, making it one of 2025’s most significant technology IPOs alongside other big names such as CoreWeave. The final market capitalization will be determined by the share price and total shares outstanding, which will be updated closer to the listing date.

  • Advantage: A strong valuation reflects robust investor interest and confidence in the company’s business model.
  • Risk: High valuations carry downside if growth momentum slows post-IPO, potentially leading to share price corrections.

3. How and Where to Buy IPO Shares?

If you wish to participate in Figma’s IPO at the offering price, you will need to work through underwriters such as Morgan Stanley, Goldman Sachs, J.P. Morgan, or Allen & Co. Typically, these allocations are reserved for institutional clients and high-net-worth individuals, though some brokers – for example, Fidelity, Charles Schwab, or Robinhood – might offer limited retail IPO allocations.

For most retail investors, buying will be easier once FIG begins public trading on the NYSE. Like all IPOs, oversubscription is possible, which could mean limited availability for retail investors at the initial price.

  • Advantage: Multiple reputable brokerages may participate, expanding accessibility.
  • Risk: Retail buyers could face allocation challenges or higher prices if demand is very strong on day one.

4. S-1 Filing Details and Financials

Figma’s S-1 filing reveals a company with compelling growth metrics and a sharp turnaround in profitability:

  1. 2024 Revenue: $749 million, a 48% increase from 2023
  2. Q1 2025 Revenue: $228.2 million, a 46% jump year-over-year
  3. Rolling 12-month revenue (as of March 2025): $821 million
  4. Gross Margin: A standout 91%
  5. Q1 2025 Net Income: $44.9 million, compared to $13.5 million the previous year
  6. 2024 Net Loss: $732 million, largely from a one-time stock-based compensation expense
  7. Cash and Equivalents: $1.54 billion
  8. Debt: Minimal, consisting mostly of a revolving credit facility
  9. Enterprise Customers: 78% of Forbes 2000 companies, with over 1,000 clients generating more than $100,000 in annual recurring revenue

According to its filing, IPO proceeds will fund global expansion, research in artificial intelligence, and selective acquisitions.

  • Advantage: Strong revenue growth, improving profitability, and a solid cash reserve.
  • Risk: High stock-based compensation expenses could weigh on future earnings, depending on how aggressively Figma continues to incentivize employees.

5. Business Model and Competitive Advantages

Figma runs on a subscription-based SaaS model, providing design and collaboration tools through the cloud to individuals, businesses, and large enterprises. Unlike traditional desktop software, its browser-based platform allows real-time teamwork.

Competitive advantages include:

  1. 95% adoption rate among Fortune 500 companies
  2. 132% net dollar retention, reflecting upsell success
  3. 76% of Fortune 500 customers use multiple Figma products
  4. 85% of monthly users located internationally
  5. Generative AI tools, including partnerships with Adobe Firefly and third-party AI models

Competition includes: Adobe, Canva, Sketch, and InVision, as well as new players leveraging AI such as Anthropic or tools developed by OpenAI.

  • Advantage: Market leadership with strong lock-in through collaborative features and sticky customers.
  • Risk: Emerging AI-native competitors could challenge Figma’s market share.

6. Leadership and Ownership

Founded in 2012 by Dylan Field and Evan Wallace, Figma remains founder-led, with Field as CEO. He is widely credited with pushing its collaborative-first design model and expanding its AI capabilities.

Major shareholders include:

  1. Index Ventures: 16.8%
  2. Greylock: 15.7%
  3. Kleiner Perkins: 14%
  4. Sequoia Capital: 8.7%

Cumulatively, Figma has raised around $749 million across several funding rounds involving top-tier Silicon Valley investors.

  • Advantage: Visionary founder leadership, with respected and experienced backers.
  • Risk: Heavy dependence on Field’s strategic direction could be a weakness if leadership transitions are needed in the future.

7. Crypto Exposure and USDC Holdings

In an unusual twist for a design company, Figma reported in its S-1 that it holds approximately $69.5 million in Bitcoin ETFs (specifically, the Bitwise Bitcoin ETF) and another $30 million in USDC stablecoins, which it plans to convert to Bitcoin.

Also Read – I Created the Best Bitcoin Guide You’ll Ever Read

While this allocation is small compared to its cash reserves, it signals a forward-looking approach to treasury management, similar to moves by Tesla or Block.

  • Advantage: Diversification of assets could enhance returns over time.
  • Risk: Exposure to cryptocurrency volatility and potential regulatory scrutiny around digital assets.

8. Broader Investment Considerations: Risks, Opportunities, and Sentiment

Opportunities:
  1. Figma has strong revenue growth and world-class gross margins.
  2. A customer base of 13 million monthly active users, with two-thirds outside the design profession, creates future upsell opportunities.
  3. Ongoing investment in AI features positions Figma to adapt to rapidly evolving design workflows.
Risks:
  1. Fierce competition from Adobe, Canva, and newer AI-native design apps
  2. Heavy R&D spending (over $750 million in 2024, largely in stock-based compensation)
  3. Exposure to crypto market swings, though small, could unsettle conservative investors
  4. Lofty valuations could face corrections if macroeconomic or sector-specific headwinds emerge

Market sentiment so far is cautiously optimistic, with pre-IPO commentary on social media platforms like X showing excitement about its 132% net dollar retention, profitability turnaround, and high user stickiness.

Expert analysts at Renaissance Capital have expressed bullish projections for the IPO, while some caution that valuations above $15 billion might be aggressive if the tech sector weakens.

Timing considerations: IPOs often trade with high volatility in the first 30 to 90 days. Some investors prefer to wait for a post-lock-up period (commonly 90–180 days) before initiating a position, as early employees and insiders become eligible to sell.

Conclusion

Figma’s IPO represents one of the most significant SaaS opportunities of 2025, showcasing robust growth, profitability improvements, and dominant market share in the collaborative design space. Its dual focus on AI-driven innovation and a proven subscription business model gives it an enviable position relative to many rivals.

However, the combination of intense competition, a possibly high valuation, and modest but nontrivial crypto exposure should caution even growth-oriented investors.

Ultimately, whether Figma is “worth it” depends on your personal risk tolerance, IPO pricing, and a careful reading of the S-1 and subsequent SEC updates. Monitoring institutional demand, short interest, and broader tech-sector sentiment will also be important in the weeks before the IPO. Investors should consider consulting a qualified financial advisor to match this opportunity with their portfolio objectives.


This article is for informational purposes only and should not be considered financial advice. Investing in stocks, cryptocurrencies, or other assets involves risks, including the potential loss of principal. Always conduct your own research or consult a qualified financial advisor before making investment decisions. The author and publisher are not responsible for any financial losses incurred from actions based on this article. While efforts have been made to ensure accuracy, economic data and market conditions can change rapidly. The author and publisher do not guarantee the completeness or accuracy of the information and are not liable for any errors or omissions. Always verify data with primary sources before making decisions.

Everything You Need to Know About the Dollar Index in 2025

The Dollar Index is a tool to measure the strength of the U.S. dollar against a basket of major world currencies, showing how valuable the dollar is compared to other key global currencies.

The U.S. Dollar Index, known by its ticker DXY, is one of the most important financial benchmarks in the global economy. It functions as a report card for the strength of the U.S. dollar against a carefully selected basket of major world currencies. Whether you are just starting to learn about investing, global trade, or monetary policy, understanding the Dollar Index is crucial.

This article will explain, in clear language, what the DXY is, why it moves, how trade policy and Federal Reserve interest rates affect it, and what it really means when people talk about “buying dollars.”

What is DXY?

The U.S. Dollar Index (DXY) tracks the value of the U.S. dollar relative to six major currencies:

  • Euro (EUR)
  • Japanese yen (JPY)
  • British pound (GBP)
  • Canadian dollar (CAD)
  • Swedish krona (SEK)
  • Swiss franc (CHF)

The euro carries the largest weight in this basket because it represents a significant portion of U.S. trade partners. The index was launched in 1973 with a base value of 100. If the DXY is at 105 today, it means the dollar is five percent stronger than it was in 1973.

In simple terms, the DXY is like a thermometer that measures the strength of the U.S. dollar compared to other globally important currencies.


What Makes the Dollar Index Move?

The DXY moves based on how many people around the world want to hold U.S. dollars. That demand can shift for many reasons:

1. U.S. Interest Rates (Federal Reserve Policy)

When the Federal Reserve raises interest rates, banks, Treasury bonds, and other U.S.-based investments start paying higher returns. That makes the dollar more attractive for global investors. Before they can invest in those higher-return assets, investors need to convert their local currency into dollars, which increases demand for dollars and lifts the Dollar Index.

2. U.S. Economic Data

When economic indicators such as GDP growth, jobs data, or consumer spending look strong, investors expect the Federal Reserve may raise rates further. That again draws money to U.S. assets, pushing up demand for dollars. If the U.S. economy shows weakness, the Fed might lower rates, which could reduce dollar demand and weaken the DXY.

3. Global Uncertainty

In times of conflict, recession, or banking panic, the dollar is often seen as a safe haven. Investors trust the dollar to protect their wealth. When uncertainty rises globally, many people buy dollars, pushing up the DXY.

4. Trade Flows

Trade also affects the Dollar Index. When the U.S. imports goods, it sends dollars abroad. If foreign exporters reinvest those dollars back into the U.S. (for example, by buying U.S. stocks or bonds), demand for the dollar stays high. But if those dollars do not return, it could weaken the dollar over time.


What Does “Buying Dollars” Really Mean?

“Buying dollars” simply means exchanging another currency for U.S. dollars. For instance, a Japanese investor might hold yen but wants to buy U.S. Treasury bonds. Since those bonds are priced in dollars, the investor must trade yen for dollars first.

People buy dollars for several reasons:

  • To invest in U.S. stocks, bonds, or real estate
  • To pay for American goods or services
  • To hold dollars as a safe, stable form of money

The massive global foreign exchange market makes these trades happen every day, totaling more than $7 trillion in daily transactions.


Why Do Higher U.S. Interest Rates Make the Dollar More Attractive?

Let’s look closely at why the Federal Reserve’s rate hikes matter so much.

When the Fed raises interest rates, returns on dollar-denominated investments go up. Global investors compare these higher U.S. returns to what they can get in their home countries. If the U.S. offers higher returns, money flows toward U.S. financial markets.

However, before investing in these assets, foreign investors must buy dollars. That surge in demand pushes the DXY higher.

In short, higher U.S. interest rates mean higher returns on U.S. assets, which attracts foreign investors, who must buy dollars to invest, which increases the dollar’s value.


Why Does the U.S. Government Have to Pay Higher on Bonds When Rates Rise?

Here is another critical link to understand.

The U.S. Treasury raises money by selling bonds. These bonds pay interest, known as the coupon. When the Fed raises interest rates, it raises the entire landscape of interest rates across the economy, including what banks pay depositors and what corporations pay on loans.

If Treasury bonds still offered old, lower yields, no one would buy them because other investments would suddenly pay better returns. To stay competitive, the Treasury must offer higher coupons on newly issued bonds. That is why rising Federal Reserve rates translate directly to higher borrowing costs for the U.S. government.


How Does Trade Policy Affect the Dollar?

Trade policy can influence how many dollars leave the U.S. or come back.

  • If the U.S. sets higher tariffs, Americans may import fewer goods, meaning fewer dollars go abroad. That can help support a stronger dollar.
  • If the U.S. lowers trade barriers and imports more, dollars flow overseas. If those dollars do not return through foreign investment, the dollar could weaken.

Even talk of trade wars, tariffs, or new trade agreements can shift market expectations and move the Dollar Index quickly, because investors try to guess how future dollar flows will change.


Putting It All Together

The U.S. Dollar Index is a powerful snapshot of global trust in the dollar. It responds to:

  1. Federal Reserve interest rate decisions
  2. Economic growth and job data
  3. Global risk events and uncertainty
  4. Trade flows and trade policy

When the DXY rises, it means the dollar is gaining strength against other major currencies, making imports cheaper for Americans but potentially making U.S. exports more expensive. When the DXY falls, the dollar is weaker, which might help U.S. exporters but could increase import costs.

Higher U.S. interest rates tend to support the dollar because investors worldwide look for the best returns, and U.S. assets look more attractive. But those higher rates also force the government to pay higher interest on its bonds, raising borrowing costs. Trade policy can shift this delicate balance by influencing how many dollars circulate around the globe.

In the end, the Dollar Index is a mirror of how desirable the dollar is in the eyes of global investors, traders, and governments. It shows how confident the world is in the stability and profitability of holding dollars.

This article is for informational purposes only and should not be considered financial advice. Investing in stocks, bonds, cryptocurrencies, or other assets involves risks, including the potential loss of principal. Always conduct your own research or consult a qualified financial advisor before making investment decisions. The author and publisher are not responsible for any financial losses incurred from actions based on this article. While efforts have been made to ensure accuracy, economic data and market conditions can change rapidly. The author and publisher do not guarantee the completeness or accuracy of the information and are not liable for any errors or omissions. Always verify data with primary sources before making decisions.

First Circle, Now Ripple Applies for OCC Charter

Circle, the issuer of the USDC stablecoin, kicked off a transformative trend by applying for a national banking charter from the U.S. Office of the Comptroller of the Currency (OCC) on June 30, 2025.

Now, Ripple, the privately held company behind the RLUSD stablecoin, has followed suit with its own OCC application on July 2, 2025. These moves signal a seismic shift in the crypto industry’s push to integrate with traditional finance, leveraging a crypto-friendly regulatory climate under the Trump administration to gain federal oversight.

Circle’s bid aims to establish First National Digital Currency Bank, N.A., allowing direct custody of its $61.5 billion USDC reserves, reducing dependence on third-party banks like BNY Mellon. Ripple’s application, paired with oversight from the New York Department of Financial Services, seeks to enhance trust in RLUSD and expand its XRP Ledger’s institutional use. Both companies are capitalizing on the OCC’s recent crypto custody rule, which permits banks to manage digital assets without prior approval, paving the way for broader services like institutional crypto custody.

The timing aligns with growing legislative momentum, including the proposed GENIUS Act for stablecoin regulation, which could further legitimize crypto in mainstream finance. Yet, challenges like regulatory scrutiny and market volatility loom. As Circle and Ripple, the latter still a private entity, pursue banking charters, their efforts could redefine the convergence of decentralized finance and regulated banking, setting a new standard for the crypto industry’s evolution.

This article is for informational purposes only and should not be considered financial advice. Investing in stocks, cryptocurrencies, or other assets involves risks, including the potential loss of principal. Always conduct your own research or consult a qualified financial advisor before making investment decisions. The author and publisher are not responsible for any financial losses incurred from actions based on this article. While efforts have been made to ensure accuracy, economic data and market conditions can change rapidly. The author and publisher do not guarantee the completeness or accuracy of the information and are not liable for any errors or omissions. Always verify data with primary sources before making decisions.