With over 3 years of experience in financial markets, we focus on simplifying global and Indian markets through clear, practical insights. Our expertise also extends to the evolving landscape of digital finance, including blockchain, stablecoins, and decentralized finance (DeFi).
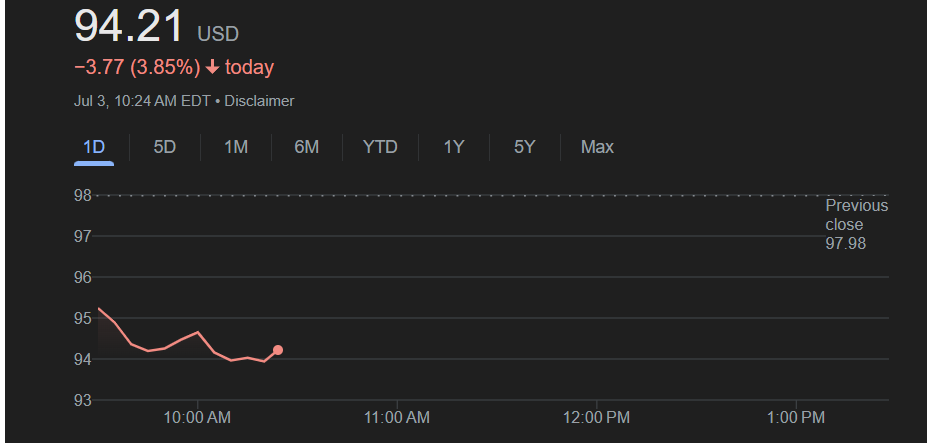
Shares of Robinhood Markets Inc (NASDAQ: HOOD) declined sharply Thursday morning, trading at $94.21, down $3.77 or 3.85% as of 10:24 AM ET. The stock is reversing after a high-profile rally, pressured by fresh doubts and technical resistance.
Why Is Robinhood Falling?
OpenAI Denial Hits Tokenized Shares Sentiment
Robinhood shares had initially surged after the company launched tokenized shares for private giants like OpenAI and SpaceX, promoting the products as a way for retail investors to access Silicon Valley startups via blockchain.
However, OpenAI quickly issued a strong statement on X, denying any partnership with Robinhood, clarifying that it had never authorized any transfer of its equity, and explicitly rejecting any endorsement of these offerings. That swift denial rattled market confidence and triggered a rapid reversal from fresh highs.
HOOD: Technical Outlook for July 2025
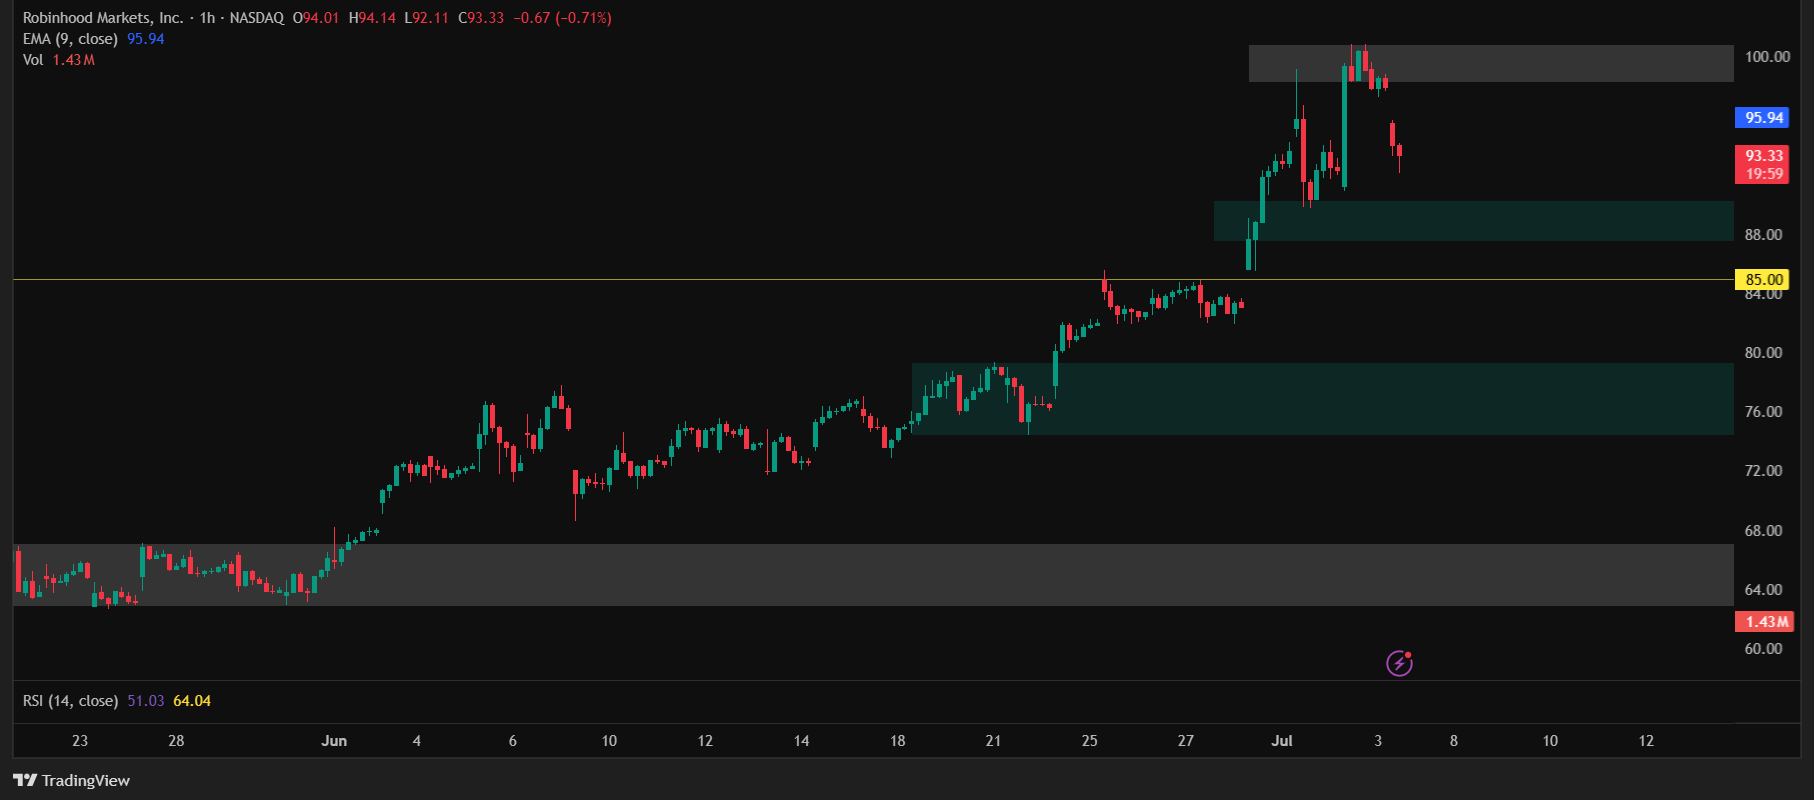
Robinhood had broken its all-time high of $85 on June 25, closing above it on June 30, and touched $100 for the first time on July 2. This move encouraged profit booking by traders.
Now, price action shows a double-top pattern forming around the $100 mark, which could continue to pressure the stock unless it breaks out decisively above that resistance. If Robinhood fails to hold support near $89.70, the next support area could be in the $74–79 zone, followed by a stronger level between $62–67 if selling deepens.
On the hourly timeframe, the Relative Strength Index (RSI) is near 50, indicating the stock is still far from oversold territory.
The company holds a market capitalization of $82.87 billion with a trailing price-to-earnings ratio of 53.90 and earnings per share of $1.75. Robinhood’s next earnings announcement is expected on July 30, 2025. Year to date, the stock has surged 153.17%, far outperforming the S&P 500’s gain of 6.63%. Over one year, Robinhood is up 312.10% versus the S&P 500’s 13.27%, and its three-year return is an impressive 1,053.18% compared to the broader index’s 63.95%. Over the past five years, Robinhood has gained 148.24%, modestly outpacing the S&P 500’s 100.37%.
This article is for informational purposes only and should not be considered financial advice. Investing in stocks, cryptocurrencies, or other assets involves risks, including the potential loss of principal. Always conduct your own research or consult a qualified financial advisor before making investment decisions. The author and publisher are not responsible for any financial losses incurred from actions based on this article. While efforts have been made to ensure accuracy, economic data and market conditions can change rapidly. The author and publisher do not guarantee the completeness or accuracy of the information and are not liable for any errors or omissions. Always verify data with primary sources before making decisions.
With over 3 years of experience in financial markets, we focus on simplifying global and Indian markets through clear, practical insights. Our expertise also extends to the evolving landscape of digital finance, including blockchain, stablecoins, and decentralized finance (DeFi).
Figma, the widely used cloud-based collaborative design platform, has officially filed for its highly anticipated initial public offering (IPO), capturing significant attention among technology investors. While this article does not make a buy or sell recommendation, it provides eight critical factors you should weigh before deciding whether Figma’s IPO fits your investment goals.
1. IPO Date, Listing Timeline, and Exchange Details
Figma filed its S-1 registration with the U.S. Securities and Exchange Commission (SEC) on July 1, 2025, confirming plans to list on the New York Stock Exchange under the ticker symbol FIG. Industry analysts suggest the IPO will take place in late summer or early fall 2025, possibly as early as August if the SEC review progresses smoothly.
Trading for FIG shares will occur during normal NYSE hours (9:30 AM–4:00 PM ET), with pre-market (4:00 AM–9:30 AM ET) and after-hours (4:00 PM–8:00 PM ET) trading potentially available through certain brokers.
Advantage: The NYSE listing brings high liquidity and investor trust.
Risk: SEC approval delays could push the listing into September or beyond.
2. IPO Price, Valuation, and Market Cap
Figma has not yet disclosed the specific IPO share price or offering size in its S-1. However, the company was valued at $12.5 billion during a 2024 private tender transaction. Analysts expect a public valuation in the range of $15 billion to $20 billion, depending on pricing and demand.
Industry sources, including Renaissance Capital, estimate the IPO could raise as much as $1.5 billion, making it one of 2025’s most significant technology IPOs alongside other big names such as CoreWeave. The final market capitalization will be determined by the share price and total shares outstanding, which will be updated closer to the listing date.
Advantage: A strong valuation reflects robust investor interest and confidence in the company’s business model.
Risk: High valuations carry downside if growth momentum slows post-IPO, potentially leading to share price corrections.
3. How and Where to Buy IPO Shares?
If you wish to participate in Figma’s IPO at the offering price, you will need to work through underwriters such as Morgan Stanley, Goldman Sachs, J.P. Morgan, or Allen & Co. Typically, these allocations are reserved for institutional clients and high-net-worth individuals, though some brokers – for example, Fidelity, Charles Schwab, or Robinhood – might offer limited retail IPO allocations.
For most retail investors, buying will be easier once FIG begins public trading on the NYSE. Like all IPOs, oversubscription is possible, which could mean limited availability for retail investors at the initial price.
Advantage: Multiple reputable brokerages may participate, expanding accessibility.
Risk: Retail buyers could face allocation challenges or higher prices if demand is very strong on day one.
4. S-1 Filing Details and Financials
Figma’s S-1 filing reveals a company with compelling growth metrics and a sharp turnaround in profitability:
2024 Revenue: $749 million, a 48% increase from 2023
Q1 2025 Revenue: $228.2 million, a 46% jump year-over-year
Rolling 12-month revenue (as of March 2025): $821 million
Gross Margin: A standout 91%
Q1 2025 Net Income: $44.9 million, compared to $13.5 million the previous year
2024 Net Loss: $732 million, largely from a one-time stock-based compensation expense
Cash and Equivalents: $1.54 billion
Debt: Minimal, consisting mostly of a revolving credit facility
Enterprise Customers: 78% of Forbes 2000 companies, with over 1,000 clients generating more than $100,000 in annual recurring revenue
According to its filing, IPO proceeds will fund global expansion, research in artificial intelligence, and selective acquisitions.
Advantage: Strong revenue growth, improving profitability, and a solid cash reserve.
Risk: High stock-based compensation expenses could weigh on future earnings, depending on how aggressively Figma continues to incentivize employees.
5. Business Model and Competitive Advantages
Figma runs on a subscription-based SaaS model, providing design and collaboration tools through the cloud to individuals, businesses, and large enterprises. Unlike traditional desktop software, its browser-based platform allows real-time teamwork.
Competitive advantages include:
95% adoption rate among Fortune 500 companies
132% net dollar retention, reflecting upsell success
76% of Fortune 500 customers use multiple Figma products
85% of monthly users located internationally
Generative AI tools, including partnerships with Adobe Firefly and third-party AI models
Competition includes: Adobe, Canva, Sketch, and InVision, as well as new players leveraging AI such as Anthropic or tools developed by OpenAI.
Advantage: Market leadership with strong lock-in through collaborative features and sticky customers.
Risk: Emerging AI-native competitors could challenge Figma’s market share.
6. Leadership and Ownership
Founded in 2012 by Dylan Field and Evan Wallace, Figma remains founder-led, with Field as CEO. He is widely credited with pushing its collaborative-first design model and expanding its AI capabilities.
Major shareholders include:
Index Ventures: 16.8%
Greylock: 15.7%
Kleiner Perkins: 14%
Sequoia Capital: 8.7%
Cumulatively, Figma has raised around $749 million across several funding rounds involving top-tier Silicon Valley investors.
Advantage: Visionary founder leadership, with respected and experienced backers.
Risk: Heavy dependence on Field’s strategic direction could be a weakness if leadership transitions are needed in the future.
7. Crypto Exposure and USDC Holdings
In an unusual twist for a design company, Figma reported in its S-1 that it holds approximately $69.5 million in Bitcoin ETFs (specifically, the Bitwise Bitcoin ETF) and another $30 million in USDC stablecoins, which it plans to convert to Bitcoin.
While this allocation is small compared to its cash reserves, it signals a forward-looking approach to treasury management, similar to moves by Tesla or Block.
Advantage: Diversification of assets could enhance returns over time.
Risk: Exposure to cryptocurrency volatility and potential regulatory scrutiny around digital assets.
8. Broader Investment Considerations: Risks, Opportunities, and Sentiment
Opportunities:
Figma has strong revenue growth and world-class gross margins.
A customer base of 13 million monthly active users, with two-thirds outside the design profession, creates future upsell opportunities.
Ongoing investment in AI features positions Figma to adapt to rapidly evolving design workflows.
Risks:
Fierce competition from Adobe, Canva, and newer AI-native design apps
Heavy R&D spending (over $750 million in 2024, largely in stock-based compensation)
Exposure to crypto market swings, though small, could unsettle conservative investors
Lofty valuations could face corrections if macroeconomic or sector-specific headwinds emerge
Market sentiment so far is cautiously optimistic, with pre-IPO commentary on social media platforms like X showing excitement about its 132% net dollar retention, profitability turnaround, and high user stickiness.
Expert analysts at Renaissance Capital have expressed bullish projections for the IPO, while some caution that valuations above $15 billion might be aggressive if the tech sector weakens.
Timing considerations: IPOs often trade with high volatility in the first 30 to 90 days. Some investors prefer to wait for a post-lock-up period (commonly 90–180 days) before initiating a position, as early employees and insiders become eligible to sell.
Conclusion
Figma’s IPO represents one of the most significant SaaS opportunities of 2025, showcasing robust growth, profitability improvements, and dominant market share in the collaborative design space. Its dual focus on AI-driven innovation and a proven subscription business model gives it an enviable position relative to many rivals.
However, the combination of intense competition, a possibly high valuation, and modest but nontrivial crypto exposure should caution even growth-oriented investors.
Ultimately, whether Figma is “worth it” depends on your personal risk tolerance, IPO pricing, and a careful reading of the S-1 and subsequent SEC updates. Monitoring institutional demand, short interest, and broader tech-sector sentiment will also be important in the weeks before the IPO. Investors should consider consulting a qualified financial advisor to match this opportunity with their portfolio objectives.
This article is for informational purposes only and should not be considered financial advice. Investing in stocks, cryptocurrencies, or other assets involves risks, including the potential loss of principal. Always conduct your own research or consult a qualified financial advisor before making investment decisions. The author and publisher are not responsible for any financial losses incurred from actions based on this article. While efforts have been made to ensure accuracy, economic data and market conditions can change rapidly. The author and publisher do not guarantee the completeness or accuracy of the information and are not liable for any errors or omissions. Always verify data with primary sources before making decisions.
With over 3 years of experience in financial markets, we focus on simplifying global and Indian markets through clear, practical insights. Our expertise also extends to the evolving landscape of digital finance, including blockchain, stablecoins, and decentralized finance (DeFi).
The U.S. Dollar Index, known by its ticker DXY, is one of the most important financial benchmarks in the global economy. It functions as a report card for the strength of the U.S. dollar against a carefully selected basket of major world currencies. Whether you are just starting to learn about investing, global trade, or monetary policy, understanding the Dollar Index is crucial.
This article will explain, in clear language, what the DXY is, why it moves, how trade policy and Federal Reserve interest rates affect it, and what it really means when people talk about “buying dollars.”
Table of Contents
What is DXY?
The U.S. Dollar Index (DXY) tracks the value of the U.S. dollar relative to six major currencies:
Euro (EUR)
Japanese yen (JPY)
British pound (GBP)
Canadian dollar (CAD)
Swedish krona (SEK)
Swiss franc (CHF)
The euro carries the largest weight in this basket because it represents a significant portion of U.S. trade partners. The index was launched in 1973 with a base value of 100. If the DXY is at 105 today, it means the dollar is five percent stronger than it was in 1973.
In simple terms, the DXY is like a thermometer that measures the strength of the U.S. dollar compared to other globally important currencies.
What Makes the Dollar Index Move?
The DXY moves based on how many people around the world want to hold U.S. dollars. That demand can shift for many reasons:
1. U.S. Interest Rates (Federal Reserve Policy)
When the Federal Reserve raises interest rates, banks, Treasury bonds, and other U.S.-based investments start paying higher returns. That makes the dollar more attractive for global investors. Before they can invest in those higher-return assets, investors need to convert their local currency into dollars, which increases demand for dollars and lifts the Dollar Index.
2. U.S. Economic Data
When economic indicators such as GDP growth, jobs data, or consumer spending look strong, investors expect the Federal Reserve may raise rates further. That again draws money to U.S. assets, pushing up demand for dollars. If the U.S. economy shows weakness, the Fed might lower rates, which could reduce dollar demand and weaken the DXY.
3. Global Uncertainty
In times of conflict, recession, or banking panic, the dollar is often seen as a safe haven. Investors trust the dollar to protect their wealth. When uncertainty rises globally, many people buy dollars, pushing up the DXY.
4. Trade Flows
Trade also affects the Dollar Index. When the U.S. imports goods, it sends dollars abroad. If foreign exporters reinvest those dollars back into the U.S. (for example, by buying U.S. stocks or bonds), demand for the dollar stays high. But if those dollars do not return, it could weaken the dollar over time.
What Does “Buying Dollars” Really Mean?
“Buying dollars” simply means exchanging another currency for U.S. dollars. For instance, a Japanese investor might hold yen but wants to buy U.S. Treasury bonds. Since those bonds are priced in dollars, the investor must trade yen for dollars first.
People buy dollars for several reasons:
To invest in U.S. stocks, bonds, or real estate
To pay for American goods or services
To hold dollars as a safe, stable form of money
The massive global foreign exchange market makes these trades happen every day, totaling more than $7 trillion in daily transactions.
Why Do Higher U.S. Interest Rates Make the Dollar More Attractive?
Let’s look closely at why the Federal Reserve’s rate hikes matter so much.
When the Fed raises interest rates, returns on dollar-denominated investments go up. Global investors compare these higher U.S. returns to what they can get in their home countries. If the U.S. offers higher returns, money flows toward U.S. financial markets.
However, before investing in these assets, foreign investors must buy dollars. That surge in demand pushes the DXY higher.
In short, higher U.S. interest rates mean higher returns on U.S. assets, which attracts foreign investors, who must buy dollars to invest, which increases the dollar’s value.
Why Does the U.S. Government Have to Pay Higher on Bonds When Rates Rise?
Here is another critical link to understand.
The U.S. Treasury raises money by selling bonds. These bonds pay interest, known as the coupon. When the Fed raises interest rates, it raises the entire landscape of interest rates across the economy, including what banks pay depositors and what corporations pay on loans.
If Treasury bonds still offered old, lower yields, no one would buy them because other investments would suddenly pay better returns. To stay competitive, the Treasury must offer higher coupons on newly issued bonds. That is why rising Federal Reserve rates translate directly to higher borrowing costs for the U.S. government.
How Does Trade Policy Affect the Dollar?
Trade policy can influence how many dollars leave the U.S. or come back.
If the U.S. sets higher tariffs, Americans may import fewer goods, meaning fewer dollars go abroad. That can help support a stronger dollar.
If the U.S. lowers trade barriers and imports more, dollars flow overseas. If those dollars do not return through foreign investment, the dollar could weaken.
Even talk of trade wars, tariffs, or new trade agreements can shift market expectations and move the Dollar Index quickly, because investors try to guess how future dollar flows will change.
Putting It All Together
The U.S. Dollar Index is a powerful snapshot of global trust in the dollar. It responds to:
Federal Reserve interest rate decisions
Economic growth and job data
Global risk events and uncertainty
Trade flows and trade policy
When the DXY rises, it means the dollar is gaining strength against other major currencies, making imports cheaper for Americans but potentially making U.S. exports more expensive. When the DXY falls, the dollar is weaker, which might help U.S. exporters but could increase import costs.
Higher U.S. interest rates tend to support the dollar because investors worldwide look for the best returns, and U.S. assets look more attractive. But those higher rates also force the government to pay higher interest on its bonds, raising borrowing costs. Trade policy can shift this delicate balance by influencing how many dollars circulate around the globe.
In the end, the Dollar Index is a mirror of how desirable the dollar is in the eyes of global investors, traders, and governments. It shows how confident the world is in the stability and profitability of holding dollars.
This article is for informational purposes only and should not be considered financial advice. Investing in stocks, bonds, cryptocurrencies, or other assets involves risks, including the potential loss of principal. Always conduct your own research or consult a qualified financial advisor before making investment decisions. The author and publisher are not responsible for any financial losses incurred from actions based on this article. While efforts have been made to ensure accuracy, economic data and market conditions can change rapidly. The author and publisher do not guarantee the completeness or accuracy of the information and are not liable for any errors or omissions. Always verify data with primary sources before making decisions.
With over 3 years of experience in financial markets, we focus on simplifying global and Indian markets through clear, practical insights. Our expertise also extends to the evolving landscape of digital finance, including blockchain, stablecoins, and decentralized finance (DeFi).
Circle, the issuer of the USDC stablecoin, kicked off a transformative trend by applying for a national banking charter from the U.S. Office of the Comptroller of the Currency (OCC) on June 30, 2025.
Now, Ripple, the privately held company behind the RLUSD stablecoin, has followed suit with its own OCC application on July 2, 2025. These moves signal a seismic shift in the crypto industry’s push to integrate with traditional finance, leveraging a crypto-friendly regulatory climate under the Trump administration to gain federal oversight.
Circle’s bid aims to establish First National Digital Currency Bank, N.A., allowing direct custody of its $61.5 billion USDC reserves, reducing dependence on third-party banks like BNY Mellon. Ripple’s application, paired with oversight from the New York Department of Financial Services, seeks to enhance trust in RLUSD and expand its XRP Ledger’s institutional use. Both companies are capitalizing on the OCC’s recent crypto custody rule, which permits banks to manage digital assets without prior approval, paving the way for broader services like institutional crypto custody.
The timing aligns with growing legislative momentum, including the proposed GENIUS Act for stablecoin regulation, which could further legitimize crypto in mainstream finance. Yet, challenges like regulatory scrutiny and market volatility loom. As Circle and Ripple, the latter still a private entity, pursue banking charters, their efforts could redefine the convergence of decentralized finance and regulated banking, setting a new standard for the crypto industry’s evolution.
This article is for informational purposes only and should not be considered financial advice. Investing in stocks, cryptocurrencies, or other assets involves risks, including the potential loss of principal. Always conduct your own research or consult a qualified financial advisor before making investment decisions. The author and publisher are not responsible for any financial losses incurred from actions based on this article. While efforts have been made to ensure accuracy, economic data and market conditions can change rapidly. The author and publisher do not guarantee the completeness or accuracy of the information and are not liable for any errors or omissions. Always verify data with primary sources before making decisions.
With over 3 years of experience in financial markets, we focus on simplifying global and Indian markets through clear, practical insights. Our expertise also extends to the evolving landscape of digital finance, including blockchain, stablecoins, and decentralized finance (DeFi).
Centene Corporation (NYSE: CNC) shares collapsed nearly 39% in the latest trading day, falling $22.36 to close at $34.29.
Here are four key reasons driving this dramatic sell-off.
1. Weak Earnings Guidance
Centene sharply reduced its profit outlook for the rest of the year, citing rising costs that will weigh on earnings. This warning rattled investors who had already been concerned about the healthcare insurer’s future growth potential
2. Higher Medical Utilization Costs
There has been a spike in elective and preventative care claims as patients return to procedures delayed during the pandemic. Centene’s large membership base in government-sponsored plans is more exposed to these pressures, as reimbursements are relatively inflexible.
3. Regulatory Uncertainty
The Centers for Medicare & Medicaid Services (CMS) is actively reviewing reimbursement rates, which could result in lower margins for Medicaid contracts. This regulatory overhang is fueling further investor unease about Centene’s near-term earnings.
4. Sector-Wide Managed Care Fears
The entire managed care sector has faced headwinds from rising medical costs and increased scrutiny on profits. Centene’s higher exposure to public health programs makes it especially vulnerable, triggering a wave of panic-selling across its shares.
Trading volume in Centene stock spiked to more than 43 million shares, far above its typical levels, reflecting broad investor fear. With a market cap dropping to around $17 billion, the company’s valuation has been severely cut as confidence erodes.
Analysts have downgraded their price targets in response to the guidance cut, with warnings that cost pressures could persist through the year. Management has promised to reprice contracts and renegotiate state agreements, but investors seem unconvinced these efforts will ease the pain quickly enough.
For long-term investors, Centene’s scale and focus on public programs remain potential strengths, but near-term challenges appear considerable. Until CMS finalizes its reimbursement reviews and cost trends stabilize, volatility in CNC shares may continue.
Company Overview
Field
Details
Founded In
1984
Founder
Elizabeth “Betty” Brinn
IPO Year
2001
Ticker Symbol
CNC
Stock Exchange
NYSE
Sector
Healthcare
Industry
Managed Healthcare
Specialisation
Government-sponsored health insurance plans
This article is for informational purposes only and should not be considered financial advice. Investing in stocks, cryptocurrencies, or other assets involves risks, including the potential loss of principal. Always conduct your own research or consult a qualified financial advisor before making investment decisions. The author and publisher are not responsible for any financial losses incurred from actions based on this article. While efforts have been made to ensure accuracy, economic data and market conditions can change rapidly. The author and publisher do not guarantee the completeness or accuracy of the information and are not liable for any errors or omissions. Always verify data with primary sources before making decisions.
With over 3 years of experience in financial markets, we focus on simplifying global and Indian markets through clear, practical insights. Our expertise also extends to the evolving landscape of digital finance, including blockchain, stablecoins, and decentralized finance (DeFi).
New York || 4:54 p.m. ET – Circle Internet Group, Inc. (NYSE: CRCL), the issuer behind the world’s second-largest stablecoin USDC, announced the upcoming launch of Circle Gateway, a major crosschain breakthrough for stablecoin transfers. CRCL stock closed Tuesday at $192.53, gaining $11.50 or 6.3% on the session, supported by renewed investor optimism around Circle’s innovation roadmap and the recent passage of the GENIUS Act.
Solving the Multichain Challenge
The blockchain ecosystem has long been fragmented across networks like Ethereum, Solana, and Avalanche. Users holding USDC on one chain often face delays and added costs to move funds to another, relying on bridges or third-party liquidity providers. These hurdles slow stablecoin adoption and complicate operations for exchanges, payment processors, and institutions.
Circle Gateway, announced on July 1, 2025, aims to eliminate this fragmentation by introducing a unified USDC balance through a non-custodial smart contract. This structure will allow users to instantly access their USDC across multiple blockchains, removing the need for manual bridging or rebalancing liquidity.
Circle Gateway’s approach is designed for simplicity and efficiency:
Users deposit USDC into a non-custodial smart contract
A single balance is created, instantly accessible on supported chains
Transfers can happen in real time, without bridges or third-party intermediaries
The company plans to roll out the new service on testnets for Avalanche, Base, and Ethereum later this month, with additional blockchain integrations expected in the future.
CRCL Stock Momentum Remains Strong
CRCL shares have surged since Circle’s June 5, 2025 IPO, which was priced at $31 and closed its first trading day at $83.23, up 168%. On Tuesday, July 1, 2025, the stock closed at $192.53 after hitting an intraday high of $194.32 and a low of $171.50, with trading volume exceeding 30.9 million shares. The market capitalization stands around $69 billion, reflecting sustained confidence in Circle’s stablecoin leadership, partnerships, and regulatory focus.
Broader Vision for Stablecoins
Founded in 2013, Circle is committed to making digital dollars as easy and reliable as email. USDC, with a circulating supply around $61.4 billion, is the second-largest stablecoin globally. Circle also offers EURC, a euro-backed stablecoin, and USYC, a tokenized money market fund (not available in the United States).
The company operates the Circle Payments Network, supports crosschain protocols, and holds key regulatory licenses, including approval from the New York Department of Financial Services and the Bermuda Monetary Authority. These compliance measures, paired with monthly attestations from a Big Four auditor, reinforce user trust and institutional confidence.
Conclusion
Circle Gateway marks an important step forward for chain-agnostic stablecoin transfers, providing seamless, instant USDC access across multiple blockchains. As Circle begins its testnet rollout this month, developers, businesses, and investors will be watching closely to see how this technology may transform the future of digital finance.
This article is for informational purposes only and should not be considered financial advice. Investing in stocks, cryptocurrencies, or other assets involves risks, including the potential loss of principal. Always conduct your own research or consult a qualified financial advisor before making investment decisions. The author and publisher are not responsible for any financial losses incurred from actions based on this article. While efforts have been made to ensure accuracy, economic data and market conditions can change rapidly. The author and publisher do not guarantee the completeness or accuracy of the information and are not liable for any errors or omissions. Always verify data with primary sources before making decisions.
With over 3 years of experience in financial markets, we focus on simplifying global and Indian markets through clear, practical insights. Our expertise also extends to the evolving landscape of digital finance, including blockchain, stablecoins, and decentralized finance (DeFi).
Electricity is a unique commodity: it cannot be stored easily, it flows according to the laws of physics, and its production and delivery are subject to constant balancing and complex grid conditions.
Because of these unique features, prices in the electricity market can be extremely volatile. Even short-term spikes can dramatically impact the cost of power for industrial users, distribution companies, or generators.
Unlike most other commodities, no one truly “owns” electricity after it is injected into the grid. Instead, qualified participants get the right to inject or withdraw electricity, subject to grid codes and balancing rules. This structure makes hedging strategies even more critical to manage unpredictable price movements.
Why Hedge with Electricity Derivatives?
Hedging through electricity derivatives is essentially a risk management strategy. These financial contracts including futures, forwards, options, and swaps – allow participants to lock in power prices for a future period, reducing exposure to short-term market volatility.
Key reasons to hedge include:
Price certainty: Protects budgets from sudden spikes in power prices.
Cash flow stability: Smoothens power purchase costs or sales revenues over time.
Market competition: Supports competitive pricing for customers without risking margin erosion.
Planning confidence: Enables long-term operational and investment planning.
For example, an industrial unit expecting to use 10 MW of electricity could buy a futures contract at ₹2500/MWh. If spot prices later rise to ₹5000/MWh, the futures contract saves the buyer from paying that higher rate.
How Hedging Works in Practice?
Here are common hedging tools:
Forwards: Bilateral agreements to buy/sell electricity at a specified price in the future. In India, these are often seen as long-term Power Purchase Agreements (PPAs).
Futures: Standardized contracts traded on exchanges like MCX or NSE, typically cash-settled. These provide liquidity and price transparency but have fixed specifications.
Options: Work like insurance – you pay a premium for the right, but not the obligation, to buy or sell at a fixed price.
Swaps: Agreements to exchange floating spot market prices for fixed prices over a given period, giving predictable cash flows.
Practical examples, such as a generator selling futures contracts to lock in their generation price, or an industrial buyer using options to protect against price surges while keeping the potential to benefit from lower spot prices.
Consequences of Not Hedging
The consequences of ignoring hedging are real and can be severe. Without risk management:
Companies might face sharp spikes in electricity bills during peak seasons or unplanned demand surges.
Profit margins could collapse if costs rise but sales prices stay fixed.
In case of high price volatility, cash flows can become erratic, making it difficult to meet financial obligations or maintain stable operations.
Competitors with hedging strategies may gain an advantage by offering more predictable prices to their customers.
For example, a data center operating under a fixed-price contract might suddenly see power bills increase by 50% in a heat wave. If the data center cannot pass those costs to clients, its margins could be wiped out.
This article is for informational purposes only and should not be considered financial advice. Investing in derivatives, stocks, commodities, or other assets involves risk, including the potential loss of principal. Always do your own research or consult a qualified financial advisor before making investment decisions. The author and publisher are not responsible for any financial losses incurred from actions based on this article. While efforts have been made to ensure accuracy, market conditions can change rapidly. Always verify data with primary sources before making decisions.
With over 3 years of experience in financial markets, we focus on simplifying global and Indian markets through clear, practical insights. Our expertise also extends to the evolving landscape of digital finance, including blockchain, stablecoins, and decentralized finance (DeFi).
India’s electricity derivatives market is set for a major milestone with the confirmed launch of electricity futures on the National Stock Exchange (NSE) starting July 11, 2025, as officially announced by NSE along with a dedicated Liquidity Enhancement Scheme (LES) to attract active participation.Meanwhile, the Multi Commodity Exchange (MCX), having already received SEBI approval earlier in June 2025, is preparing to introduce its own electricity futures contracts, though its exact launch dates remain unclear, with market sources hinting at a rollout later in 2025.
What Are Electricity Futures?
Electricity futures are standardized, cash‑settled contracts in which buyers and sellers agree today on the price of a specified quantity of electricity for delivery at a future date, though no physical transfer actually occurs.
In India, settlement references the Indian Energy Exchange’s Day‑Ahead Market (DAM) price, with the difference paid or received in cash at expiry.
For example, a distribution company might buy an electricity futures contract at ₹3.50 per kilowatt‑hour in anticipation of peak summer demand, where spot prices could rise to ₹5.00/kWh. When the contract expires, if the DAM price reaches ₹5.00, the distribution company receives the difference, helping offset higher procurement costs.
In USA, NYMEX electricity futures operate similarly, using hub prices like PJM or NYISO to manage financial risk across wholesale electricity markets.
What Are Electricity Options?
Electricity options are financial derivatives that grant the buyer the right, but not the obligation, to enter into an electricity futures contract at a set strike price by a specified expiry date. Options help participants manage extreme price swings while controlling downside exposure.
For instance, a generator concerned about falling power prices could buy a put option at ₹4.00/kWh to guarantee a minimum selling price. If the DAM drops to ₹3.00/kWh, the generator exercises the put, protecting its revenues. If spot prices stay higher, the generator can let the option expire without obligation.
The NYMEX market offers options on electricity futures with multiple strike prices and associated premiums, supporting active hedging in a highly volatile commodity. India’s strong participation in equity options, such as Nifty options on NSE, shows similar potential if electricity options are eventually launched.
What Is Electricity Open Interest?
Open interest measures the total number of outstanding futures or options contracts that remain active and unclosed. It is a critical measure of market depth and liquidity.
For example, if one trader buys 20 futures contracts while another sells 20, open interest is 20. If 10 of these positions are later closed, open interest reduces to 10. High open interest typically signals strong participation and better price discovery.
In the U.S., NYMEX electricity markets consistently show high open interest, building confidence in robust, efficient derivatives trading — a target India will hope to replicate.
Confirmed Developments: Electricity Futures
India has officially confirmed electricity futures trading on NSE to begin on July 11, 2025, supported by a Liquidity Enhancement Scheme to deepen market participation and ensure smooth rollout. These contracts will be financially settled, referencing the IEX DAM or, in future, a unified index if Market-Based Economic Dispatch (MBED) is introduced.
Participants in these contracts include distribution companies seeking to fix future costs, power generators aiming to stabilize revenues, large industrial consumers needing predictable pricing, and retail traders, who make up a significant portion of India’s derivatives activity.
MCX, which secured SEBI approval in June 2025, is also preparing to launch its electricity futures contracts, though no confirmed date has been announced. Industry sources expect MCX’s launch to follow later in 2025. These futures contracts create a solid starting point for deeper risk management tools in India’s growing electricity sector.
Speculative: Electricity Options and Option Chain
While electricity futures are confirmed and about to begin trading, electricity options remain speculative.
Regulatory boundaries between SEBI, which regulates financial derivatives, and the Central Electricity Regulatory Commission (CERC), which oversees physical electricity markets, also need to be clearly defined. In addition, India’s spot electricity trading must further mature with stable price discovery before a robust options market can succeed.
By comparison, the NYMEX electricity options market has thrived thanks to a deeply liquid underlying futures market and decades of reliable hub-based spot pricing. India could follow a similar roadmap if these hurdles are systematically addressed over time.
Hypothetical Scenario: NSE and MCX Electricity Option Chain
If SEBI gives the green light to electricity options in the future, India’s exchanges could adopt a familiar structure based on existing equity derivatives.
Options would likely be European style, cash‑settled at expiry, and sized at 1 MWh per contract, with settlement referencing IEX DAM prices around ₹3.50/kWh.
A hypothetical option chain might offer strike prices ranging from ₹2.50 to ₹4.50, with ₹0.25 increments near the current market price and wider steps at the tails. Premiums would reflect India’s historically high volatility in the power sector. As in the NYMEX market, in‑the‑money options would command higher premiums while out‑of‑the‑money contracts would see lower premiums.
An illustrative option chain could look like this:
Call Premium
Call OI
Call Volume
Strike Price (₹/kWh)
Put Premium
Put OI
Put Volume
1.05
600
80
2.50
0.02
500
60
0.80
800
100
2.75
0.03
600
70
0.55
1,200
150
3.00
0.05
800
100
0.35
1,500
200
3.25
0.10
1,000
120
0.20
2,000
300
3.50
0.20
1,800
250
0.10
1,600
180
3.75
0.35
1,200
140
0.05
1,000
100
4.00
0.55
900
80
0.03
700
70
4.25
0.80
600
60
0.02
500
50
4.50
1.05
400
40
Such a structure would help manage both upward spikes from peak demand and downward moves from renewable oversupply, while concentrating liquidity at at‑the‑money strikes for efficiency.
Challenges and Preparation
The path to a functional electricity derivatives market in India faces several challenges. Futures markets will need time to build sufficient liquidity, without which options cannot function reliably. Coordination between SEBI and CERC will be vital to avoid regulatory conflicts. High price volatility in electricity will also require robust margining and risk controls, as applied in NYMEX electricity options.
Official Electricity Option Chain Links
As electricity options are not yet launched in India, official option chain links for NSE and MCX are currently unavailable. Once these options are approved and launched, this article will be updated with official exchange links.
Exchange
Link
NSE
To be updated very soon
MCX
To be updated very soon
This article is for informational purposes only and should not be considered financial advice. Investing in stocks, cryptocurrencies, or other assets involves risks, including the potential loss of principal. Always conduct your own research or consult a qualified financial advisor before making investment decisions. The author and publisher are not responsible for any financial losses incurred from actions based on this article. While efforts have been made to ensure accuracy, economic data and market conditions can change rapidly. The author and publisher do not guarantee the completeness or accuracy of the information and are not liable for any errors or omissions. Always verify data with primary sources before making decisions.
With over 3 years of experience in financial markets, we focus on simplifying global and Indian markets through clear, practical insights. Our expertise also extends to the evolving landscape of digital finance, including blockchain, stablecoins, and decentralized finance (DeFi).
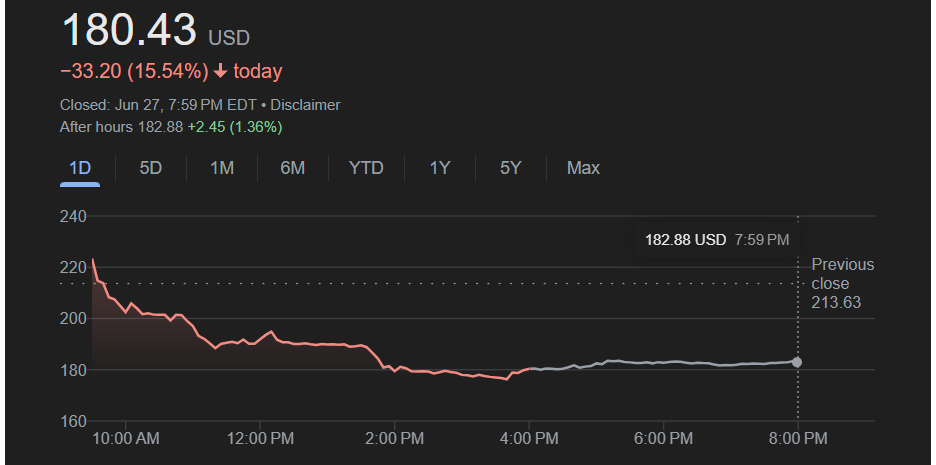
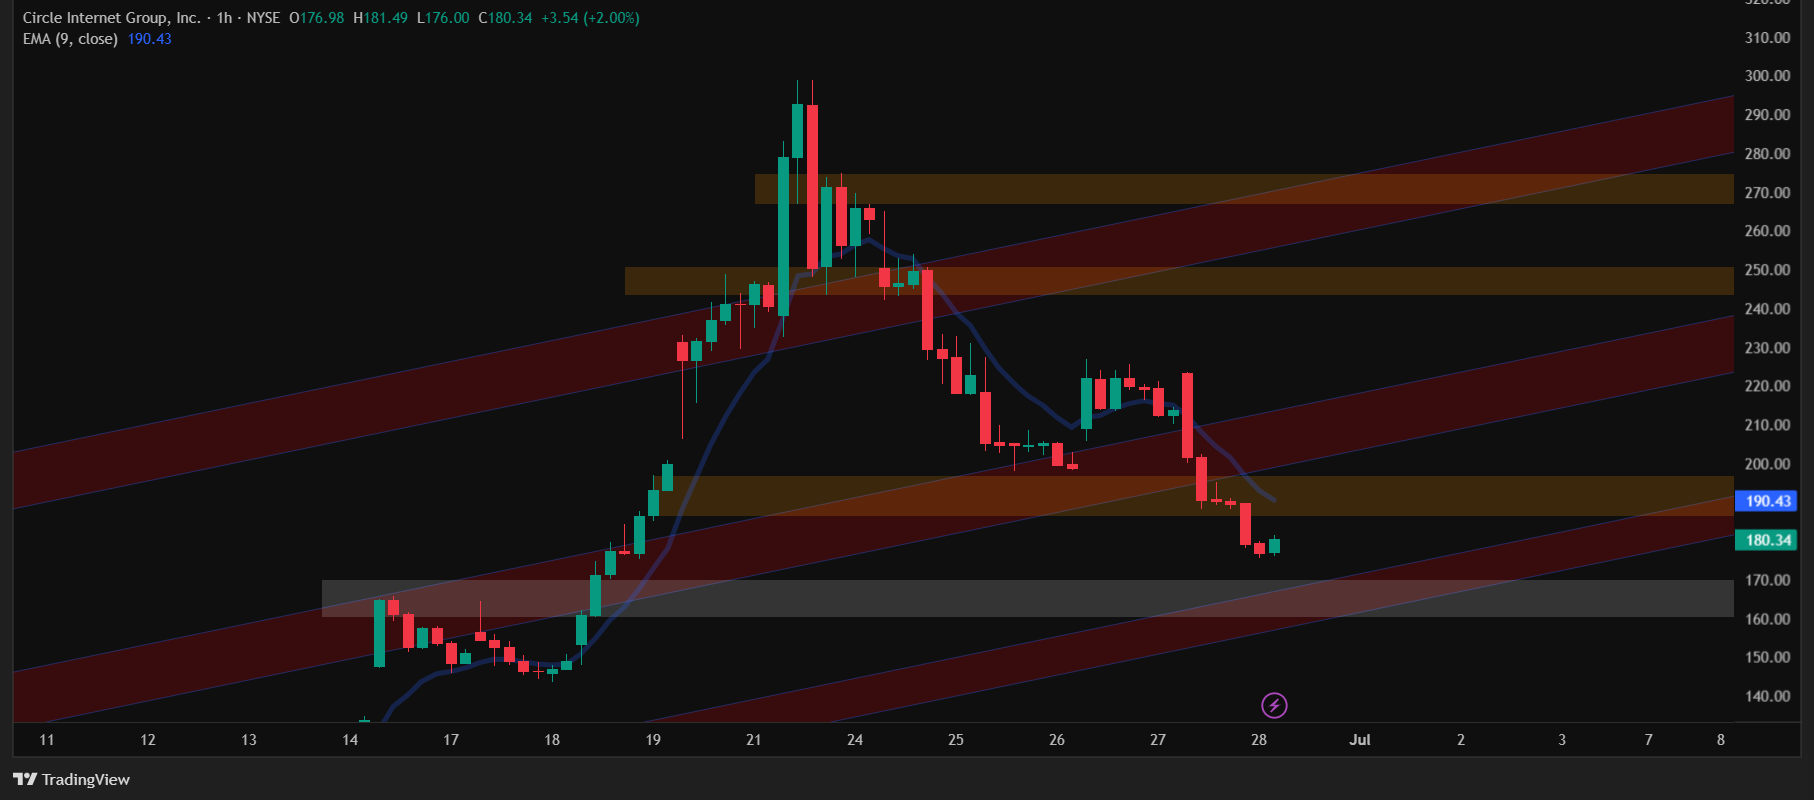
Since touching an all-time high of $298.99 on Monday after announcing a major partnership with Fiserv, the stock has seen relentless selling pressure. CRCL attempted a modest rebound of 7.56% on Thursday but could not sustain the momentum, breaking down again Friday to finish near session lows.
Friday’s trading opened at $223.65 and reached an early high at the same level before collapsing to an intraday low of $175.60. After-hours prices recovered slightly to $182.88, up 1.36%, but market confidence remains weak. The company’s market capitalization has shrunk to $40.15 billion from its Monday peak of roughly $67 billion, wiping out nearly $27 billion in value in just five trading days.
According to Yahoo Finance, Circle’s valuation metrics remain stretched despite the correction. Its trailing P/E ratio stands at 2,070, with a forward P/E of 128.21, and a lofty price-to-book ratio of 53.90. These numbers underline investor concerns about overheating.
Since its IPO price of $31, CRCL has still delivered a staggering return of approximately 481% even at $180.43, reflecting the scale of the prior rally.
Technical Outlook for Monday
CRCL’s price chart is showing concerning weakness. The stock decisively broke through its first parallel channel support in the 190–200 zone, which had served as a critical technical level earlier in the week.
With Friday’s deep close, CRCL is now trading inside a second parallel channel, bounded by 170–160 as crucial support. If this lower channel fails to hold, the next significant levels could be much deeper.
Short-term resistance is likely to emerge near 190, coinciding with the broken prior support, while the upper band of the current channel around 205–210 will serve as a major resistance level on any meaningful bounce.
How Much Will It Fall?
Given the severe weekly drop of nearly 25% and a 39.65% collapse from Monday’s all-time high, sentiment is highly fragile. If CRCL cannot hold above the 170–160 channel support early next week, the decline could accelerate toward 150 or lower in a washout phase.
At the same time, the Relative Strength Index is hovering around 35 on the hourly timeframe, approaching oversold territory. That could temporarily slow the decline.
For now, the chart suggests a bearish bias with the potential to retest the 170–160 zone.
Valuation Still in Question
Circle’s valuation metrics are extremely rich compared to traditional fintech peers. A trailing P/E above 2,000, forward P/E over 128, and price-to-book ratio of nearly 54 put its fundamentals under intense scrutiny. Combined with a collapse in technical structure and critical comments from the Bank for International Settlements (BIS) questioning the long-term viability of stablecoins, CRCL’s profile has shifted from high-flying to highly vulnerable in a matter of days.
As of now, Circle’s massive run from its $31 IPO to $298.99 on Monday, a 864% gain at the top, is experiencing a harsh reality check. Even after falling to $180.43, the stock retains an approximate 481% return from IPO, underscoring just how inflated the price had become.
This article is for informational purposes only and should not be considered financial advice. Investing in stocks, cryptocurrencies, or other assets involves risks, including the potential loss of principal. Always conduct your own research or consult a qualified financial advisor before making investment decisions. The author and publisher are not responsible for any financial losses incurred from actions based on this article. While efforts have been made to ensure accuracy, economic data and market conditions can change rapidly. The author and publisher do not guarantee the completeness or accuracy of the information and are not liable for any errors or omissions. Always verify data with primary sources before making decisions.
With over 3 years of experience in financial markets, we focus on simplifying global and Indian markets through clear, practical insights. Our expertise also extends to the evolving landscape of digital finance, including blockchain, stablecoins, and decentralized finance (DeFi).
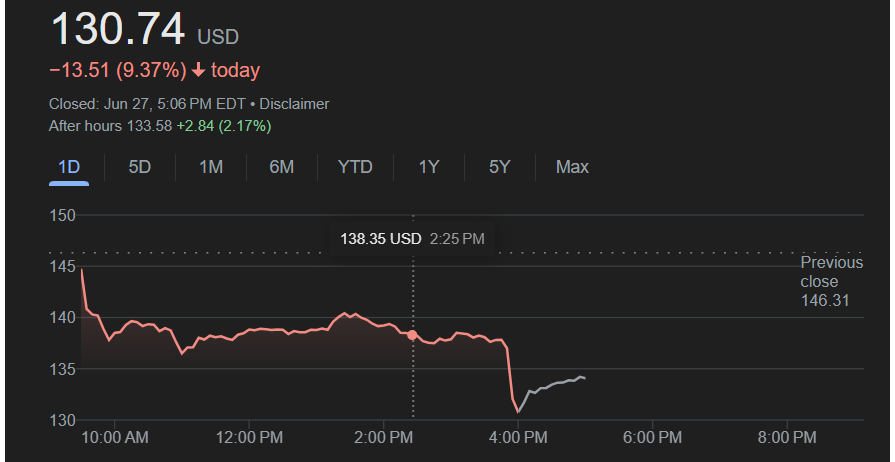
Shares of Palantir Technologies Inc. (NYSE: PLTR) closed sharply lower on Friday, tumbling 9.37% to $130.74 as investors absorbed a wave of selling pressure. The market cap has plunged to $308,534,946,784 as selling pressure intensified.
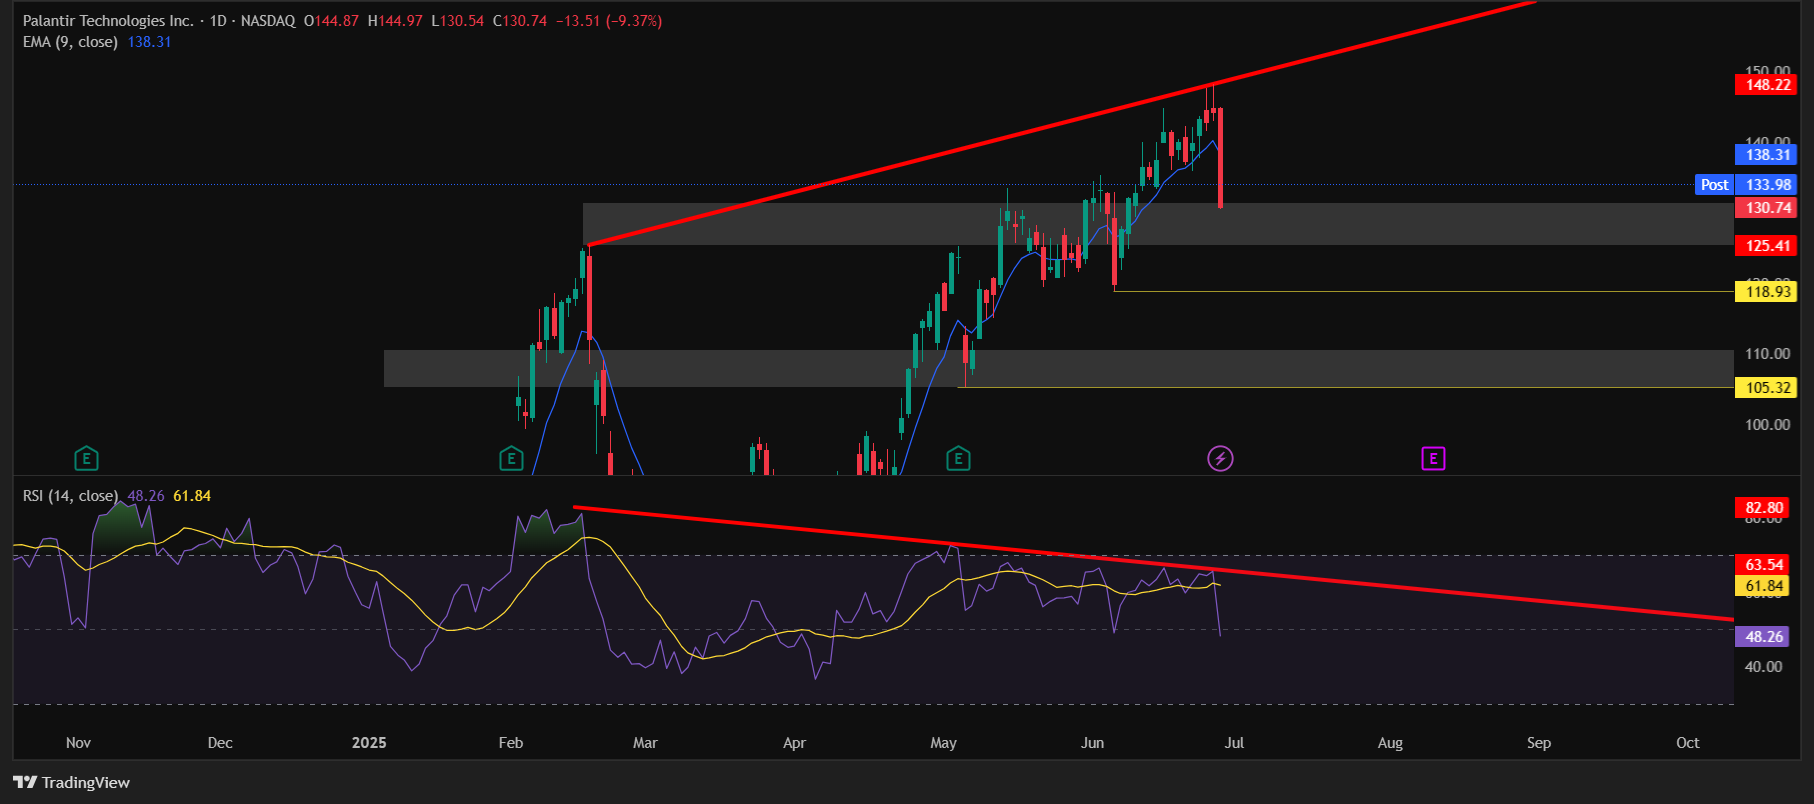
The stock, which has rallied over 124% from its April swing low, has now pulled back nearly 12% from its all-time high of $148.22.
Why is Palantir going down?
Here are three key reasons driving this drop:
1. Unsustainable Valuations
Palantir is trading at a sky-high price-to-earnings (P/E) ratio of 570.94, based on trailing twelve-month earnings per share of $0.23. Such valuations are hard to justify even for a growth-oriented technology company, especially after an extended rally. Many investors see this P/E as unsustainable, raising concerns that Palantir could be priced far beyond its fundamentals.
2. Profit Booking After a Powerful Rally
The stock surged 124.16% from its April low of $66.12, reaching a record high of $148.22 earlier this month.
However, RSI had already been diverging since February, warning of a potential pullback.
Traders expecting a deeper correction were initially caught off guard as institutional players continued buying to absorb liquidity. Once broader market participants regained confidence and resumed buying, larger players offloaded their positions at higher prices to maximize liquidity, driving Friday’s sharp decline.
Technically, the stock has broken below its daily 9-day exponential moving average and is testing support in the $125–$130 range, with its weekly 9 EMA also nearby.
A short-term bounce could occur here, but the broader structure suggests a potential move toward the $105–$100 zone, which aligns with the monthly 9 EMA and a key psychological round number.
3. Risks Surrounding Department of Defense Contracts
Investors are also wary of risks tied to Palantir’s government business. The U.S. Department of Defense recently published its fiscal year 2026 budget request, which, after accounting for inflation, is slightly smaller than the previous cycle. Since Palantir depends on significant government and defense contracts, any perceived reduction in defense spending could negatively affect future revenue growth.
Palantir Technologies Inc. (NYSE: PLTR) has delivered impressive gains for investors over the past year, surging 442.49% and climbing 71.57% year-to-date as of the latest close.
This article is for informational purposes only and should not be considered financial advice. Investing in stocks, cryptocurrencies, or other assets involves risks, including the potential loss of principal. Always conduct your own research or consult a qualified financial advisor before making investment decisions. The author and publisher are not responsible for any financial losses incurred from actions based on this article. While efforts have been made to ensure accuracy, economic data and market conditions can change rapidly. The author and publisher do not guarantee the completeness or accuracy of the information and are not liable for any errors or omissions. Always verify data with primary sources before making decisions.
With over 3 years of experience in financial markets, we focus on simplifying global and Indian markets through clear, practical insights. Our expertise also extends to the evolving landscape of digital finance, including blockchain, stablecoins, and decentralized finance (DeFi).