
The Job Market – A Pillar of U.S. Economic Strength

The U.S. labor market shows the balance between employers hiring and people looking for jobs. It reflects employment levels, wages, and economic health, with key reports like Nonfarm Payrolls and unemployment data guiding businesses, policymakers, and investors.

The job market, also known as the labor market, is one of the most important foundations of any economy.

In the United States, it is often described as a pillar of economic strength because the ability of people to find jobs and earn wages fuels spending, investment, and overall growth. Their spending has long been the engine behind the world’s largest economy, making the health of the labor market a critical measure of U.S. prosperity.

The job market is not a physical place but a way of describing how employers looking for workers interact with people seeking employment. It represents the balance between the demand for labor and the supply of workers in an economy.

  • When more jobs are available, the labor market is described as strong or tight.
  • When unemployment rises and hiring slows, the market is said to be weakening.

This simple interaction is closely tied to other economic indicators, especially the unemployment rate.


How the Job Market Works?

The mechanics of the labor market are similar to other markets.

Workers provide the supply, while employers represent the demand.

Wages function as the “price” that balances the two sides. If employers need more workers than are available, wages tend to rise. If there are more workers available than jobs, wage growth slows and hiring weakens.

This constant adjustment explains why the job market is both a measure of current conditions and a signal of where the economy may be headed.


The Role of the Bureau of Labor Statistics (BLS)

In the United States, the Bureau of Labor Statistics is the main government agency that tracks and reports on the job market.

Each month, it publishes the Employment Situation Report, which is widely followed by businesses, policymakers, and financial markets.

This report is based on two surveys.

The first, called the Household Survey or Current Population Survey, provides the unemployment rate and other measures such as labor force participation.

The second, called the Establishment Survey or Current Employment Statistics, counts payroll jobs and shows how many jobs were added or lost in different industries. Together, these surveys give the most complete picture of how the American labor market is performing.

The unemployment rate in particular is one of the most recognized figures. It measures the percentage of people in the labor force who do not have a job but are actively seeking one. Because it reflects slack or tightness in the labor market, the unemployment rate plays a central role in judging economic health.


Strong vs. Weak Job Market

A strong job market occurs when unemployment is low, many jobs are available, and wages are rising. This creates a positive cycle where higher wages increase spending, supporting businesses and economic growth.

A weak job market happens when unemployment rises, fewer jobs are available, and wage growth slows. In this situation, workers have less bargaining power, and businesses may be more cautious about hiring or investing.


The Job Market, Inflation, and the Federal Reserve

The U.S. labor market is closely tied to inflation and interest rate policy.

A tight job market often leads to higher wages, which can push up prices across the economy. To prevent inflation from rising too quickly, the Federal Reserve may raise or hold interest rates, cooling demand.

Conversely, a weakening job market, where unemployment rises and wage growth slows, usually reduces inflation pressure. This gives the Fed more room to cut rates in order to support growth and stabilize employment.


Key Indicators of the Job Market

The condition of the labor market is measured through several important indicators.

  • The unemployment rate remains the most visible measure of slack or tightness.
  • Nonfarm payrolls, which track how many jobs are created or lost each month, provide a direct sense of hiring momentum.
  • Job openings, tracked through the JOLTS report, show how many positions employers are trying to fill and how competitive the market is.
  • Wage growth signals the bargaining power of workers and potential inflation risks.
  • Finally, the labor force participation rate reveals how many people are actively engaged in the labor market, either by working or by seeking employment.

Why the Job Market Matters?

The job market has far-reaching effects.

For businesses, labor market conditions guide decisions about hiring, wages, and investment.

For policymakers, job data influences decisions about interest rates and fiscal policies.

For workers and households, it affects career opportunities, wage prospects, and financial security. Because consumer spending is the largest driver of the U.S. economy, the labor market’s health directly shapes the strength of economic growth.

This article is for informational purposes only and should not be considered financial advice. Investing in stocks, cryptocurrencies, or other assets involves risks, including the potential loss of principal. Always conduct your own research or consult a qualified financial advisor before making investment decisions. The author and publisher are not responsible for any financial losses incurred from actions based on this article. While efforts have been made to ensure accuracy, economic data and market conditions can change rapidly. The author and publisher do not guarantee the completeness or accuracy of the information and are not liable for any errors or omissions. Always verify data with primary sources before making decisions.

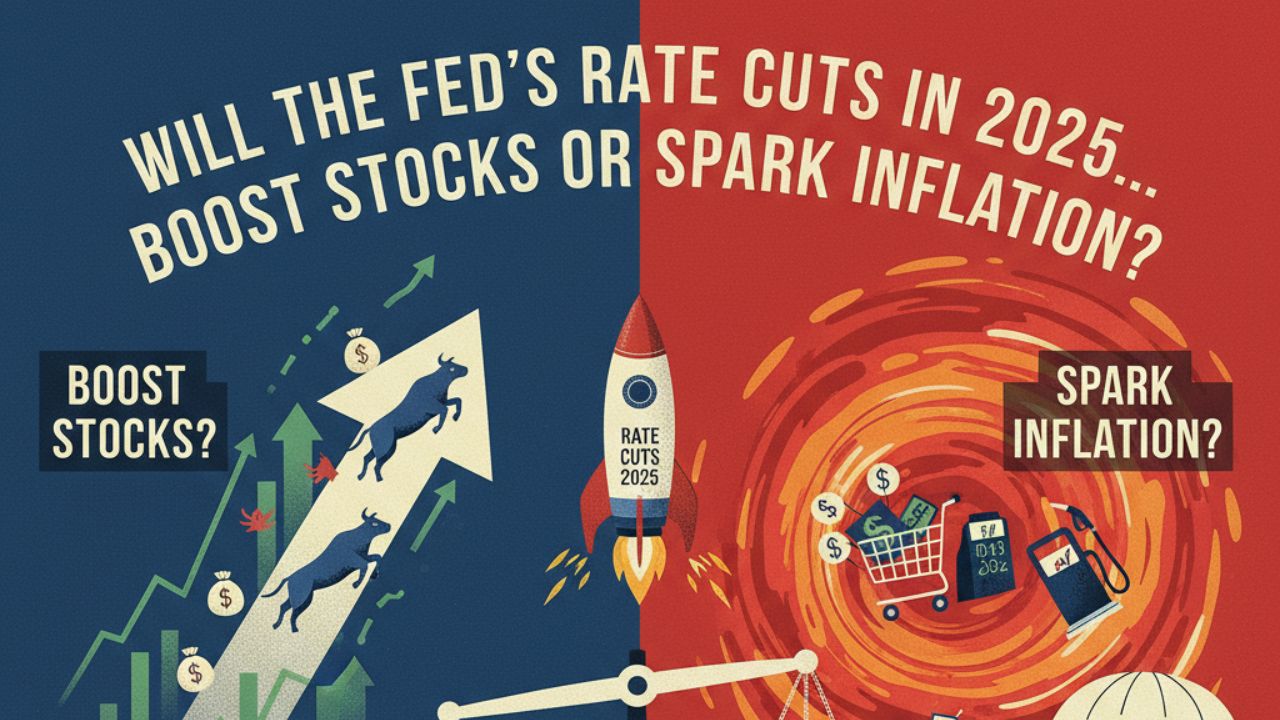
Will the Fed’s Rate Cuts in 2025 Boost Stocks or Spark Inflation?

As the U.S. economy navigates a complex landscape in 2025, all eyes are on the Federal Reserve’s potential interest rate cuts. These decisions could reshape financial markets and personal finances alike. Federal Reserve Chair Jerome Powell’s comments at the Jackson Hole symposium on August 22, 2025, have fueled speculation. Markets are now pricing in an 88.25% chance of a 0.25% rate cut at the Fed’s September meeting.

Investors and analysts on X (formerly Twitter) are divided. Some expect a stock market rally, while others warn of an “everything bubble” or resurgent inflation.

So, what does this mean for U.S. financial markets, and how should investors prepare? Let’s break it down.


The Fed’s Dilemma: Balancing Inflation and Employment

The Federal Reserve has kept its benchmark federal funds rate steady at 4.25%–4.5% since December 2024. This level is considered restrictive as it keeps borrowing costs high to control inflation.

  • Inflation Trends: Inflation has come down from its 2022 peak of over 5.5% but remains sticky at 2.7% (Core PCE, May 2025), above the Fed’s 2% target.
  • Labor Market Softening: The July non-farm payrolls report showed just 73,000 jobs added, far below expectations, with earlier months revised lower.

This slowdown has created divisions within the Fed. At the July 2025 meeting, two dissenting members pushed for an immediate 0.25% cut – a rare signal of growing concern about economic weakness.

At Jackson Hole, Powell admitted that “conditions may warrant adjusting our policy stance” as job market risks rise. However, he remains cautious, citing uncertainties such as President Trump’s new tariffs, which could lift import costs and fuel inflation.

Also Read – The Very First Post You Should Read to Learn Cryptocurrency


How Rate Cuts Could Impact Financial Markets

1. Stock Market: Surge or Bubble?

Lower rates typically boost stocks by cutting borrowing costs for businesses and encouraging consumer spending. Powell’s August speech triggered a Dow Jones rally of 800 points as optimism spread. Analysts like Ed Yardeni forecast the S&P 500 could reach 6,600 by year-end and 7,500 in 2026 if cuts materialize.

Sectors such as technology, real estate, and consumer discretionary tend to thrive in low-rate environments.

But caution remains. Critics warn of an “everything bubble,” with stocks, housing, and crypto near record highs. If corporate earnings fail to justify valuations, a sharp correction could follow.

2. Bonds and Fixed Income

A rate cut generally lowers Treasury yields. Following Powell’s remarks, the 2-year Treasury yield fell to 3.71%. While this reduces returns for bondholders, it could make equities more attractive, potentially shifting capital from bonds to stocks.

However, if tariffs fuel inflation, yields could unexpectedly climb, as they did in 2024, creating market uncertainty.

3. Housing and Consumer Borrowing

Lower rates could ease strain in the housing market. 30-year mortgage rates remain high at 6.8% (June 2025), far above the 3% levels of 2021. Even modest cuts could revive homebuying and refinancing activity, boosting real estate and related sectors.

Consumers may also benefit from lower rates on auto loans and personal loans. Yet, credit card rates – averaging 20.13% – are unlikely to see meaningful relief from small Fed cuts.

4. Inflation Risks and Tariffs

Trade policies are a major wildcard. Trump’s 145% tariffs on Chinese imports could create short-term price spikes. Powell has downplayed these as “one-time” shocks, but persistent trade tensions could keep prices elevated.

The Fed’s current outlook – only two quarter-point cuts in 2025 – signals caution. Policymakers are wary of easing too much while core inflation is still projected at 2.8% by year-end.


What Investors Should Do?

  1. Diversify Portfolios
    Spread exposure across equities, bonds, and alternative assets like gold or crypto. J.P. Morgan strategists emphasize aligning portfolios with long-term goals.
  2. Focus on Defensive Sectors
    If inflation stays elevated, defensive sectors such as utilities, healthcare, and consumer staples could offer stability.
  3. Track Key Economic Data
    Watch upcoming reports like CPI (September release) and jobs data. These indicators will shape the Fed’s next moves.
  4. Avoid Market Timing
    Experts caution against trying to outsmart the market. Northeastern economist Bob Triest notes that staying disciplined is safer than chasing rate-driven rallies.

The Bottom Line

The Fed’s potential rate cuts in 2025 could lift stocks, ease borrowing costs, and boost consumer confidence. But risks remain – asset bubbles, inflation, and trade tensions could all complicate the outlook.

For now, a September cut looks likely. But the path ahead is uncertain, as the Fed walks a fine line between stabilizing prices and supporting employment.

Investors should brace for volatility, stay diversified, and focus on long-term goals.

This article is for informational purposes only and should not be considered financial advice. Investing in stocks, cryptocurrencies, or other assets involves risks, including the potential loss of principal. Always conduct your own research or consult a qualified financial advisor before making investment decisions. The author and publisher are not responsible for any financial losses incurred from actions based on this article. While efforts have been made to ensure accuracy, economic data and market conditions can change rapidly. The author and publisher do not guarantee the completeness or accuracy of the information and are not liable for any errors or omissions. Always verify data with primary sources before making decisions.

Understanding Gold (XAUUSD) Trading – A Beginner’s Guide

Gold has been valued by humans for thousands of years. In ancient times, people used it to make jewelry, coins, and symbols of power. Even today, gold is seen as a safe and trusted form of wealth. To many people, gold is not just a metal. It represents security, trust, and financial stability.

But how is the price of gold actually decided? Who decides it? And why does gold continue to hold value even in modern times? Let’s understand this step by step.

Why Gold Has Value?

Gold is valuable because it is rare, durable, and universally accepted. Unlike paper money, gold cannot be printed. Unlike other metals, it does not rust or lose shine. This makes it an excellent store of value.

In addition, gold has cultural and emotional value. People buy it during festivals, weddings, and as gifts. Central banks also keep gold as part of their reserves because it builds trust in the stability of their currency.

So, gold has both practical value (it is limited and lasting) and emotional value (people trust it across cultures and generations).

History of Gold Pricing

The practice of setting a standard gold price started more than 100 years ago. In 1919, a group of five banks in London began meeting daily to agree on a single price for gold. This process was called the London Gold Fixing. At that time, it gave the world one trusted reference price for trading gold.

Over time, the system changed. Instead of a small group of banks, today the London Bullion Market Association (LBMA) manages the official global gold benchmark. The LBMA Gold Price is published twice a day in U.S. dollars, euros, and British pounds. It is widely used by banks, jewelers, investors, and central banks as the reference point for gold pricing.

This history shows how gold pricing moved from private meetings to a transparent and regulated process that the whole world can trust.


Key Institutions and How They Fit Together

The gold market is made up of several important players who together decide how gold is traded and priced:

1. The OTC Market (Over-the-Counter)

Most gold trading happens in the OTC market, which is a global network of banks, dealers, and institutions. There is no single physical marketplace. Instead, large buyers and sellers trade directly with each other.

2. The London Bullion Market Association (LBMA)

LBMA is a key institution that sets the reference price for gold twice a day (known as the LBMA Gold Price). This price is used worldwide as a benchmark.

3. Central Banks

Central banks across the world hold large amounts of gold in their reserves. They buy and sell gold to manage economic stability and to build trust in their currency.

4. Gold Mining Companies

These companies supply freshly mined gold to the market. They play a big role in how much new gold enters circulation every year.

Together, these institutions keep the gold market running and influence how its price is set.


The Primary Source of Gold Price

The primary source of gold pricing is the OTC market, where banks and institutions trade gold directly. Since these are large transactions, the price discovered in OTC trading reflects real market demand and supply.

However, the world needs a standard reference price. That is why the LBMA Gold Price is important. It is published twice daily and acts as a trusted benchmark used by traders, jewelers, and investors around the globe.

The spot price of gold reflects the current rate at which gold is being traded in the market. Reliable sources include:

  • The LBMA website
  • The World Gold Council website
  • Trusted financial platforms like Bloomberg, or Reuters

Factors That Influence the Price of Gold

The price of gold is not fixed. It changes every day depending on global events and economic conditions. Some of the main factors are:

  • Inflation: When the cost of goods rises, people turn to gold as protection for their wealth. This increases demand and pushes the price higher.
  • Interest Rates: When interest rates are low, people prefer to invest in gold instead of bonds or savings accounts, which makes gold more expensive.
  • Geopolitical Events: Wars, conflicts, or global crises make investors nervous. In such times, gold is seen as a safe place to put money, so demand rises.
  • Supply and Demand: If mining output falls or central banks buy more gold, the supply becomes tighter and the price goes up.

Global Gold Supply and Reserves

Gold is limited, and new supply comes mainly from mining. On average, about 3,000–3,500 tonnes of gold are mined every year worldwide.

Apart from newly mined gold, a huge amount is already held in reserves by central banks. According to the World Gold Council, central banks together hold more than 36,000 tonnes of gold.

Countries like the United States, Germany, Italy, and India have some of the largest reserves. These reserves act like financial insurance for nations, protecting them during uncertain times.


With limited annual supply and huge reserves held by central banks, gold will always remain important in the global financial system.

This article is for informational purposes only and should not be considered financial advice. Investing in stocks, cryptocurrencies, or other assets involves risks, including the potential loss of principal. Always conduct your own research or consult a qualified financial advisor before making investment decisions. The author and publisher are not responsible for any financial losses incurred from actions based on this article. While efforts have been made to ensure accuracy, economic data and market conditions can change rapidly. The author and publisher do not guarantee the completeness or accuracy of the information and are not liable for any errors or omissions. Always verify data with primary sources before making decisions.

5 Reasons Opendoor Stock Is Trending Right Now

Manhattan Bridge Capital authorizes up to 100,000 share repurchase programme to address stock price decline and signal confidence.

Opendoor Technologies Inc. (NASDAQ: OPEN) is once again on investors’ radar, posting significant gains and leading the charge among the day’s most active stocks. As a trailblazer in the iBuying sector, Opendoor’s recent momentum is grabbing attention – and for good reason.

Latest Market Snapshot

At the time of writing, Opendoor Technologies Inc. (OPEN) is trading at $3.60, up a robust 11.80% for the session. The stock opened at $3.21 and has ranged between $3.13 and $3.71 so far today, climbing from a previous close of $3.22. With a market capitalization near $2.65 billion and today’s trading volume already topping 199 million shares, investor interest is undeniable.

For the trailing twelve months, Opendoor has reported revenues of $5.18 billion – though the company remains unprofitable, recording a net loss of approximately $305 million (EPS: -$0.43). The stock’s 52-week range of $0.508 to $4.97 underscores its volatility and recent upward momentum.

Also Read – The Very First Post You Should Read to Learn Cryptocurrency

So, what’s behind this renewed surge in Opendoor shares?

Here are the five key factors every investor should watch:

1. Strong Q3 2024 Earnings Results

Opendoor surpassed expectations in its recent Q3 2024 report, showcasing improved operational efficiency and narrowed losses. Management’s focus on cost controls and better unit economics is restoring faith in the company’s long-term model.

2. Housing Market Recovery Signs

Signs of stronger housing demand are emerging, as the Federal Reserve hints at potential interest rate cuts and affordability shows incremental improvements. This macro environment could accelerate home transactions and play directly into Opendoor’s strengths.

3. Technology and AI Advancements

Tech is at the core of Opendoor’s edge. Robust investments in artificial intelligence and machine learning are enhancing pricing accuracy and operational workflows, helping the company make smarter buying decisions and minimize holding costs.

4. Market Share Expansion

Opendoor is pressing its advantage with aggressive expansion into new and existing real estate markets. This broader geographic reach is capturing a greater share of total transaction volume and fueling growth prospects.

5. Institutional Investor Interest

The smart money is paying attention: notable hedge funds and institutional players have increased their positions in Opendoor, signaling professional confidence in the company’s recovery and future growth trajectory.

This article is for informational purposes only and should not be considered financial advice. Investing in stocks, cryptocurrencies, or other assets involves risks, including the potential loss of principal. Always conduct your own research or consult a qualified financial advisor before making investment decisions. The author and publisher are not responsible for any financial losses incurred from actions based on this article. While efforts have been made to ensure accuracy, economic data and market conditions can change rapidly. The author and publisher do not guarantee the completeness or accuracy of the information and are not liable for any errors or omissions. Always verify data with primary sources before making decisions.

What Are Trading Sessions? – Understand Their Relevance

Trading Sessions Explained

The best time to trade XAU/USD is overwhelmingly during the London/New York overlap (usually 8:00 AM to 12:00 PM ET).

In the world of financial markets, a trading session refers to a specific period of time when markets in a particular geographic region are most active.

Since forex operates on a 24-hour cycle, the sessions follow the sun around the globe – markets open in Asia, then Europe, and finally North America before the cycle begins again.

Also Read – I Created the Best Bitcoin Guide You’ll Ever Read

The Four Main Global Trading Sessions

There are four major sessions that divide the trading day:

The Sydney Session

The Sydney session takes place in Australia.

It opens the market after the weekend and marks the beginning of the weekly trading cycle. Since it is the first session of the week, activity is usually quieter compared to the other major sessions.

The Tokyo Session

The Tokyo session happens in Japan and also includes other large Asian markets.

This session is especially important for Asian currencies, with the Japanese yen (JPY) being the most active. Traders often watch this time to see how Asian markets set the tone for the day.

The London Session

The London session is based in the United Kingdom and is the busiest of all four sessions.

It sees the largest trading volume and the highest liquidity, making it the center of global forex activity. Because of this, a lot of price movements and trading opportunities occur during these hours.

The New York Session

The New York session runs in the United States and is the second busiest trading session after London.

It is known for strong volatility, especially during the time when it overlaps with the London session. Many important U.S. economic announcements are also released during this period, which can cause major market moves.

Also Read – What is the difference between ICT and SMC?


The Most Important Sessions to Watch

While each session brings opportunities, the overlap periods are where the most action happens.

During overlaps, more traders are active, which increases liquidity, reduces spreads, and fuels stronger movements in price.

London and New York Overlap

This is the prime time for traders everywhere.

With both European and North American markets open, trading volume reaches its peak. Combine this with frequent economic data releases from both regions, and you get fast-moving, highly liquid conditions. If you can only trade a few hours a day, this overlap is often the best choice.

Tokyo and London Overlap

This overlap isn’t as intense as London/New York but is still meaningful.

It bridges the Asian and European sessions, often leading to fresh volatility as traders shift focus from yen-related pairs to European currencies like the GBP and EUR. Pairs such as GBP/JPY or EUR/JPY can be particularly active at this time.


As a new trader, you don’t need to stay awake 24/7 monitoring the markets. Instead, focus your attention on the times of highest liquidity and volatility, particularly the overlap periods.

By concentrating on these sessions, you not only conserve time and energy but also increase your chances of finding profitable opportunities in the market.

Remember, trading is not about being present all the time – it’s about being present at the right time.

This article is for informational purposes only and should not be considered financial advice. Investing in stocks, cryptocurrencies, or other assets involves risks, including the potential loss of principal. Always conduct your own research or consult a qualified financial advisor before making investment decisions. The author and publisher are not responsible for any financial losses incurred from actions based on this article. While efforts have been made to ensure accuracy, economic data and market conditions can change rapidly. The author and publisher do not guarantee the completeness or accuracy of the information and are not liable for any errors or omissions. Always verify data with primary sources before making decisions.

Margin and Leverage Explained for Beginners

With margin and leverage, you put up a small amount of your own money (the margin) to control a much larger trade position (the full traded value) by borrowing the rest from your broker (the leverage)

Margin is the portion of a trade’s value you put in as collateral, while Leverage is the facility your broker provides that allows you to control the full value of the trade without putting up the entire amount yourself.

What is Margin in Trading?

Margin is the amount you deposit with a broker or exchange to open a trade. You can think of it as a security deposit. Instead of paying the full value of the trade upfront, you only put in a small percentage of the total value of the trading instrument, and your broker allows you to control the rest.

For example, suppose Bitcoin is trading at $100,000. Your broker might only require you to deposit $5,000 to open a position. This $5,000 is your margin, which you are depositing with your broker.

The word “margin” comes from the Latin word margō, meaning “edge” or “border.” Over time, this evolved to mean “an extra amount” or “a surplus” that is kept in reserve. The term “margin” was applied to trading because it perfectly describes the function of the deposit: it is the cushion or borderline that a trader must maintain to keep a position open. If the value of the trade drops and “eats into” this margin, the broker issues a “margin call,” demanding that you restore the cushion to the required level.

What is Leverage in Trading?

Leverage is the facility your broker offers that lets you control the full value of a trade without having to provide the entire capital yourself.

Using the earlier example, you deposited $5,000 to open a trade for one Bitcoin worth $100,000. Your broker provided the remaining $95,000 to facilitate the trade.

In this scenario:

  • You provided 5% of the total value ($5,000).
  • Your broker provided the remaining 95% ($95,000).

Because your broker helped you control a position 20 times the size of your initial margin ($100,000 ÷ $5,000 = 20), you are said to be using 20x leverage provided by your broker.

Similarly, if a broker asked you to deposit $10,000 for a $100,000 Bitcoin trade, the broker would cover the remaining $90,000. In this case, you would be using 10x leverage ($100,000 / $10,000 = 10).

Leverage is the multiple of your deposited Margin that shows the Total Value of your trading position.

The calculation uses the full value of the asset, not just the amount of money a broker lends you.

Margin and leverage are directly linked:

Margin × Leverage = Total Trade Value

Leverage is the ability to control a much larger trading position than your initial capital would normally allow, using borrowed money from your broker. It is usually expressed as a ratio, such as 10:1 (or 10x) or 100:1 (or 100x).


Bitcoin Example – Price $100,000 with 100x Leverage

Imagine Bitcoin is trading at $100,000 and you want to trade one full Bitcoin. If your broker’s margin requirement is 1%, you can calculate the margin needed.

That would be $100,000 ÷ 100 = $1,000.

This means with just $1,000 of your own money, you can control a $100,000 Bitcoin position using 100x leverage ($1000 × 100 = 100,000).

If the price of Bitcoin rises by 1% ($1,000), your profit will also be $1,000, which is a 100% gain on your margin. But if the price falls by 1%, you lose $1,000 and your margin is completely wiped out.

This is why high leverage is extremely risky – even a small move against you can lead to liquidation.

Reference Table

Margin RequirementLeverageMargin NeededPrice Move for Liquidation
1%100x$1,0001%
2%50x$2,0002%
5%20x$5,0005%
10%10x$10,00010%

Benefits and Risks

Profit and loss are calculated on the total size of your trade, not just your margin. Any profit you make using leveraged money is yours to keep, but if the trade goes against you, the loss comes out of your margin.

Using margin and leverage allows you to trade larger positions with a smaller amount of money, which can lead to significant profits even with small market movements.

However, the same principle works in reverse. Losses are also magnified, and a highly leveraged trade can be wiped out by even a small unfavorable price move.

This is especially true in volatile markets like cryptocurrencies, where prices can swing by several percent in a matter of minutes.

This article is for informational purposes only and should not be considered financial advice. Investing in stocks, cryptocurrencies, or other assets involves risks, including the potential loss of principal. Always conduct your own research or consult a qualified financial advisor before making investment decisions. The author and publisher are not responsible for any financial losses incurred from actions based on this article. While efforts have been made to ensure accuracy, economic data and market conditions can change rapidly. The author and publisher do not guarantee the completeness or accuracy of the information and are not liable for any errors or omissions. Always verify data with primary sources before making decisions.

US Inflation Cools as July CPI Data Shows Stabilization

FOMC meeting september 2025

The latest Consumer Price Index (CPI) report, released by the U.S. Bureau of Labor Statistics (BLS) on August 12, 2025, indicates a continued cooling of inflationary pressures. The all-items CPI, often referred to as headline inflation, rose by 2.7% on a year-over-year (YoY) basis in July, unchanged from the previous month’s rate. On a month-over-month (MoM) basis, prices increased by 0.2%.

This data reflects ongoing progress toward the Federal Reserve’s 2% inflation target, down from peaks above 9% in 2022, though some underlying pressures persist.


Understanding the Key Metrics

The CPI measures the average change in prices paid by urban consumers for a basket of goods and services.

  • CPI-U: The Consumer Price Index for All Urban Consumers is the broadest and most commonly cited measure of inflation, covering about 93% of the U.S. population. It includes a wide range of expenses, from food and housing to transportation and medical care.
  • Core CPI: This version removes volatile food and energy prices to give a clearer picture of underlying inflation trends. In July, Core CPI rose by 3.1% YoY, showing that while headline inflation is moderating, prices for goods and services outside food and energy remain a factor.

Breakdown of Major Categories

CategoryMoM ChangeYoY ChangeNotes
Shelter (Housing)+0.2%+3.7%Remains a major driver of core inflation due to lingering rent and homeownership costs
Food0.0%+2.2%Food at home dipped slightly (-0.1% MoM) but overall stable
Energy-1.1%-1.6%Gasoline prices fell sharply (-2.2% MoM, -9.5% YoY) easing overall pressures
Medical Care+0.4%+3.5%Steady increases in healthcare services
Motor Vehicle Insurance+0.5%+5.3%One of the hotter areas, reflecting higher repair and claim costs
Core (ex-food/energy)+0.3%+3.1%Shows stickier inflation in non-volatile items

While some areas like energy are cooling, others like housing and insurance are keeping costs elevated for many households.


Comparison to Expectations and Trends

The July data largely met economists’ expectations, with headline CPI in line at 2.7% YoY and 0.2% MoM. However, core CPI came in slightly higher than anticipated (3.1% YoY vs. a forecasted 3.0%), signaling that underlying inflation is not cooling as quickly as hoped.

Inflation has been on a downward trajectory since mid-2022, but the pace has slowed recently, with rates hovering around 2.7–3.0% over the past few months.


How CPI is Calculated

The CPI data is released every month and is a statistical estimate based on a weighted average of prices.

The BLS collects around 80,000 price quotes monthly from retail stores and service establishments. These prices are compared on both a month-over-month and year-over-year basis.

The YoY comparison is generally considered more reliable for tracking long-term trends, as it removes seasonal fluctuations. For example, comparing July 2025’s prices to July 2024’s provides a more stable view than comparing July to June, which might be influenced by seasonal demand.


Implications for Everyday People and the Economy

Moderating inflation means your purchasing power is not eroding as quickly. Groceries, gas, and other essentials might stabilize or even drop in some cases. With headline inflation at 2.7%, closer to the Fed’s 2% goal, there is growing expectation for interest rate cuts soon, which could make borrowing cheaper for homes, cars, or credit cards.

However, sticky core inflation (driven by shelter and services) suggests challenges remain, especially for renters facing higher housing costs or drivers dealing with rising insurance premiums. Overall, this report is positive for economic stability but underscores the need to monitor categories that affect daily life.


CPI’s Influence on Federal Reserve Policy and Stock Markets

The CPI plays a pivotal role in shaping monetary policy and financial markets.

The Federal Reserve, the U.S. central bank, adjusts interest rates to achieve its dual mandate of maximum employment and stable prices. When inflation runs high, the Fed raises rates to cool the economy by making borrowing more expensive, reducing spending and investment. Conversely, when inflation moderates, as in the July report, the Fed may cut rates to stimulate growth by lowering borrowing costs, encouraging business expansion and consumer spending.

July’s CPI data, with headline inflation steady at 2.7% and core at 3.1%, has fueled market bets on a September rate cut, easing fears of tariff-driven spikes and increasing the odds of 75 basis points of cuts in the final three Fed meetings of 2025. While the slight uptick in core inflation may not halt cuts, it highlights the need for ongoing vigilance.

For U.S. stock markets, CPI data is significant because it signals potential Fed actions that directly impact valuations. Lower-than-expected inflation boosts investor confidence in rate cuts, leading to rallies as cheaper borrowing supports corporate profits and economic expansion.

High inflation readings, however, could prompt rate hikes, pressuring stocks by increasing costs and reducing growth prospects.

CPI often acts as a barometer for market sentiment, with softer data sparking broad gains in equities.

This article is for informational purposes only and should not be considered financial advice. Investing in stocks, cryptocurrencies, or other assets involves risks, including the potential loss of principal. Always conduct your own research or consult a qualified financial advisor before making investment decisions. The author and publisher are not responsible for any financial losses incurred from actions based on this article. While efforts have been made to ensure accuracy, economic data and market conditions can change rapidly. The author and publisher do not guarantee the completeness or accuracy of the information and are not liable for any errors or omissions. Always verify data with primary sources before making decisions.

How Options Are Priced – A Simple Guide

Option Pricing: Components, Black–Scholes, Put–Call Parity, and Futures vs Spot

Options are not priced randomly. They follow certain principles and mathematical models that take multiple factors into account. Let’s break down the components and logic behind how options are priced, and also understand some important related concepts.

1. Components Behind Option Pricing

The price of an option depends mainly on:

  • Price of the Underlying Asset – Whether it is a stock, index, or commodity.
  • Intrinsic Value – The part of the option price that comes from how much the option is “in the money.”
  • Time to Expiration – More time means more chances for the option to move in your favour.
  • Volatility – How much the underlying price is expected to move.
  • Interest Rates – Market interest rates also have a small but measurable impact on option pricing.

These components work together in a formula. The most popular formula is the Black–Scholes Model, which takes all these inputs to calculate a fair price for the option.


2. The Basic Option Price Formula

Option Price = Intrinsic Value + Extrinsic Value

  • Extrinsic value includes Time Value + Implied Volatility value.

If an option is at the moment of expiration, the time value becomes zero. At that point, the option price equals only the intrinsic value. This is because the “Theta component” (rate of time decay) has fully eroded.


3. Role of Theta – Time Decay

The Theta of an option measures how fast its price will fall as time passes, assuming all else remains the same.

The Theta of an option measures the rate at which its value declines each day as expiration approaches, assuming all else remains unchanged.

  • For option buyers, Theta is always negative, meaning your option loses value with time.
  • This time decay speeds up as expiry gets closer, which is why short-term options lose value quickly.

4. Volatility’s Direct Impact

Option prices are directly proportional to volatility.

High volatility = higher premiums, because there’s a greater chance for large moves that could put your option in the money.

Low volatility = cheaper premiums, as price swings are expected to be smaller.


5. Put-Call Parity and Arbitrage

For European-style options, there’s a mathematical relationship between the prices of calls, puts, and futures called Put–Call Parity:

Futures Price = Strike Price + Call Price – Put Price

A “synthetic future” is not a separate product you can buy or sell. It’s simply an options combination that behaves exactly like a futures contract:

  • Long Call + Short Put = behaves like Long Futures
  • Short Call + Long Put = behaves like Short Futures

Same strike, same expiry.

If this relationship is not true in the market, arbitragers can make risk-free profits.

Arbitrage is the practice of taking advantage of price differences for the same asset in different markets.

For example:

Case 1: Synthetic is Overpriced

  • Strike Price (K) = $100
  • Call Price (C) = $7
  • Put Price (P) = $4
  • Actual Futures Price = $102

From the formula: Synthetic Futures Price=K+C−P=100+7−4=$103

Here, the synthetic is $1 more expensive than the actual futures.

How to Arbitrage:

  1. Sell the synthetic (using options):
    • Sell the call at $7.
    • Buy the put at $4.
      (This behaves like shorting a futures contract.)
  2. Buy the actual futures at $102.

Why It Works:

  • The futures you bought and the short-futures-like options combo cancel each other’s price risk.
  • The $1 difference is locked in as profit, regardless of market movement.

Case 2: Synthetic is Underpriced

  • Strike Price (K) = $100
  • Call Price (C) = $6
  • Put Price (P) = $5
  • Actual Futures Price = $103

From the formula: Synthetic Price=100+6−5=$101

Here, the synthetic is $2 cheaper than the actual futures.

How to Arbitrage:

  1. Buy the synthetic (using options):
    • Buy the call at $6.
    • Sell the put at $5.
      (This behaves like going long on a futures contract.)
  2. Sell the actual futures at $103.

Why It Works:

  • Again, the long-futures-like options combo and the short actual futures cancel each other’s price movements.
  • The $2 difference is your locked-in profit.

6. Why Sometimes Calls Seem More Expensive Than Puts

It may look like calls are more expensive than puts at the same strike or vice versa.

But in reality, options are usually priced correctly according to put–call parity and the level of the synthetic futures price.

This is true even for weekly options. They are priced based on implied futures rather than directly from the spot price.

So, even if you are trading short-term options, futures pricing plays a role.


7. Why Futures Prices Can Be Higher Than Spot Prices?

Futures prices are often higher than spot prices when there’s still significant time to expiration. This happens because of cost of carry, which includes:

  • Financing cost (interest rate for holding the position until expiry).
  • Any other costs involved in holding the asset.

This difference between spot and futures price is known as contango.

As expiry approaches, futures prices converge with spot prices, and the difference disappears on the expiration day.

This article is for informational purposes only and should not be considered financial advice. Investing in stocks, cryptocurrencies, or other assets involves risks, including the potential loss of principal. Always conduct your own research or consult a qualified financial advisor before making investment decisions. The author and publisher are not responsible for any financial losses incurred from actions based on this article. While efforts have been made to ensure accuracy, economic data and market conditions can change rapidly. The author and publisher do not guarantee the completeness or accuracy of the information and are not liable for any errors or omissions. Always verify data with primary sources before making decisions.

5 Possible Reasons Figma Stock Is Crashing After Its IPO

Figma, Inc. (NYSE: FIG), the design software powerhouse, made headlines with its explosive IPO debut on July 31, 2025, soaring 250% from its $33 offering price to close at $115.50, valuing the company at nearly $60 billion. However, just four trading sessions later, after reaching an intraday peak of $142.91, the stock dropped significantly to $79 by August 5, 2025 - a 45% slide from its peak.

Figma, Inc. (NYSE: FIG) – the popular design software company – made headlines with its blockbuster IPO on July 31, 2025. The stock jumped by 250% on its debut day, rising from its issue price of $33 to close at $115.50. At its peak, Figma’s valuation touched nearly $60 billion.

Also Read – Will the Figma (FIG) Rally Continue After a 250% Gain on Debut?

However, just four trading sessions later, after reaching an intraday peak of $142.91, the stock dropped significantly to $79 by August 5, 2025 – a 45% slide from its peak.

This sharp correction has made investors ask one key question – Why is Figma’s stock dropping?

Here are five possible reasons behind this sudden drop:


1. Post-IPO Profit-Taking

Figma’s IPO saw overwhelming demand, with subscriptions exceeding 40 times the available shares. This demand pushed the stock to an intraday high of $142.91. However, once trading began, early investors and institutions quickly started booking profits.

Only 7% of the company’s shares were available for trading (free float), making the stock more volatile. In such cases, even modest selling can trigger sharp price swings. This is a classic example of a “buy the hype, sell the news” pattern, often seen in popular tech IPOs.


2. Overvaluation Concerns

After its debut, Figma was trading at a forward price-to-sales (P/S) ratio of over 60x. For context:

  • Microsoft trades at about 14.1x
  • Datadog trades near 17.8x

What is Price-to-Sales (P/S)?
It’s a metric used to compare a company’s stock price with its sales. A high P/S means investors are paying a premium for every dollar of revenue – which is only justified if the company grows rapidly and profitably.

Even after dropping to $79, Figma’s valuation still looks expensive when compared to its peers. While it grew revenue by 46% year-over-year, some investors are questioning whether that’s enough to support such a high price.


3. Competitive Pressures and AI Disruption

Figma is a market leader in design software with over 40% market share, serving major clients like Google and Netflix. However, the company’s IPO filing mentioned increasing competition, especially from AI-powered design tools.

Startups like Lovable and Bolt are using generative AI to create design systems more efficiently. Meanwhile, giants like Canva and Microsoft are expanding their presence by integrating design tools into existing software platforms.

Some tech analysts believe AI could even replace traditional design tools, allowing developers to convert code directly into designs. Figma has launched Figma Make to stay ahead, but investor concerns about its long-term competitive edge may be weighing on the stock.


4. Macro Market Turbulence

Figma’s decline is also linked to wider market conditions. Around the same time, the NASDAQ Composite and other tech-heavy indices experienced notable pullbacks, driven by:

  • Uncertainty over President Trump’s tariff policies
  • A general sell-off in high-growth tech stocks

Even though Figma’s business remains strong, the timing of its listing overlapped with broader negative investor sentiment in tech. As a result, it may have been caught in a sector-wide correction.


5. Looming Insider Selling Pressure

A major concern for investors is the upcoming expiration of the IPO lock-up period, set for January 2026. Currently, most of Figma’s shares are held by insiders, including venture firms like Sequoia Capital and Index Ventures, whose stakes are collectively worth around $24 billion.

Although insiders cannot sell now, the fear of future selling often pushes current investors to exit early- adding psychological pressure to the stock.

If a large number of shares are released into the market when the lock-up ends, it could increase supply significantly, putting downward pressure on prices.

Also Read – Bullish Launches $724M IPO – BLSH Targets NYSE Listing


Is the IPO Boom Slowing Down?

Despite Figma’s correction, the overall IPO market remains very active in 2025. So far, 123 tech companies have gone public, raising a total of $19.7 billion, which is 48% higher than last year.

But investors seem to be becoming more cautious and selective. They’re still excited about new listings – but only when valuations are seen as reasonable and the growth story is convincing.

Figma’s 250% debut-day gain was historic, but the subsequent 45% drop is a reminder that post-IPO volatility is common, especially in richly valued tech stocks.

This article is for informational purposes only and should not be considered financial advice. Investing in stocks, cryptocurrencies, or other assets involves risks, including the potential loss of principal. Always conduct your own research or consult a qualified financial advisor before making investment decisions. The author and publisher are not responsible for any financial losses incurred from actions based on this article. While efforts have been made to ensure accuracy, economic data and market conditions can change rapidly. The author and publisher do not guarantee the completeness or accuracy of the information and are not liable for any errors or omissions. Always verify data with primary sources before making decisions.

Bullish Launches $724M IPO – BLSH Targets NYSE Listing

Bullish IPO: A New Crypto Player Eyes NYSE Listing with Ticker “BLSH”
Total Potential Raise$724 million
Base Offering20,300,000 shares (up to $629.3M at $31)
Underwriters’ Option3,045,000 shares (up to $94.4M at $31)
Total Shares Offered23,345,000
Price Range$28.00–$31.00 per share
Ticker SymbolBLSH
ExchangeApplied to list on NYSE
Offering TypeOffer for Sale (OFS)
Lead UnderwritersJ.P. Morgan, Jefferies, Citigroup

Cayman Islands-based Bullish, a global digital asset platform backed by billionaire investor Peter Thiel, announced the launch of its initial public offering (IPO) roadshow on August 4, 2025, aiming to raise up to $724 million. The company has applied to list its shares on the New York Stock Exchange (NYSE) under the ticker symbol “BLSH”, marking a significant step in bridging the crypto and traditional financial markets.

Also Read – The Very First Post You Should Read to Learn Cryptocurrency

The IPO includes an offer of 20.3 million ordinary shares in a price range of $28 to $31 per share, potentially raising $629.3 million at the top end. Bullish has also granted underwriters a 30-day option to purchase up to an additional 3.045 million shares, which could add $94.4 million in proceeds, bringing the total potential raise to $723.7 million (rounded to $724 million).

Bullish’s IPO signals crypto’s mainstream push, with BLSH poised to attract investors seeking exposure to digital assets.

This is an Offer for Sale (OFS), meaning the proceeds will go to existing shareholders rather than the company itself. However, Bullish noted that the funds may still support “general corporate purposes,” including potential acquisitions.

The company operates a regulated spot and derivatives exchange in Germany, Hong Kong, and Gibraltar, focusing on institutional-grade liquidity. Bullish also owns CoinDesk, a leading crypto media brand, and provides market indices and data services through its CoinDesk Indices and CoinDesk Data divisions.

The offering is being led by J.P. Morgan, Jefferies, and Citigroup, and taps into growing institutional interest in regulated crypto infrastructure – similar to recent listings by players like Circle.

Bullish has filed a Form F-1 with the U.S. Securities and Exchange Commission (SEC). The offering is subject to market conditions and regulatory approval.

If fully subscribed, Bullish could be valued at around $4.23 billion, positioning BLSH as a potential bellwether for crypto on Wall Street.

Bullish’s IPO reflects crypto’s ongoing push into mainstream financial markets. As the roadshow unfolds, final terms will be determined, making this one of the most closely watched IPOs in the digital asset space this year.

Also Read – 8 Important Facts About Stablecoins You Need to Know in 2025

This article is for informational purposes only and should not be considered financial advice. Investing in stocks, cryptocurrencies, or other assets involves risks, including the potential loss of principal. Always conduct your own research or consult a qualified financial advisor before making investment decisions. The author and publisher are not responsible for any financial losses incurred from actions based on this article. While efforts have been made to ensure accuracy, economic data and market conditions can change rapidly. The author and publisher do not guarantee the completeness or accuracy of the information and are not liable for any errors or omissions. Always verify data with primary sources before making decisions.