Varun Beverages Announces Interim Dividend for 2025

varun-beverages-dividend-2025

Varun Beverages Limited bottles and sells popular soft drinks and juices in India and many other countries.

It follows the calendar year (1 January to 31 December) as its financial year.

What Is a Dividend?
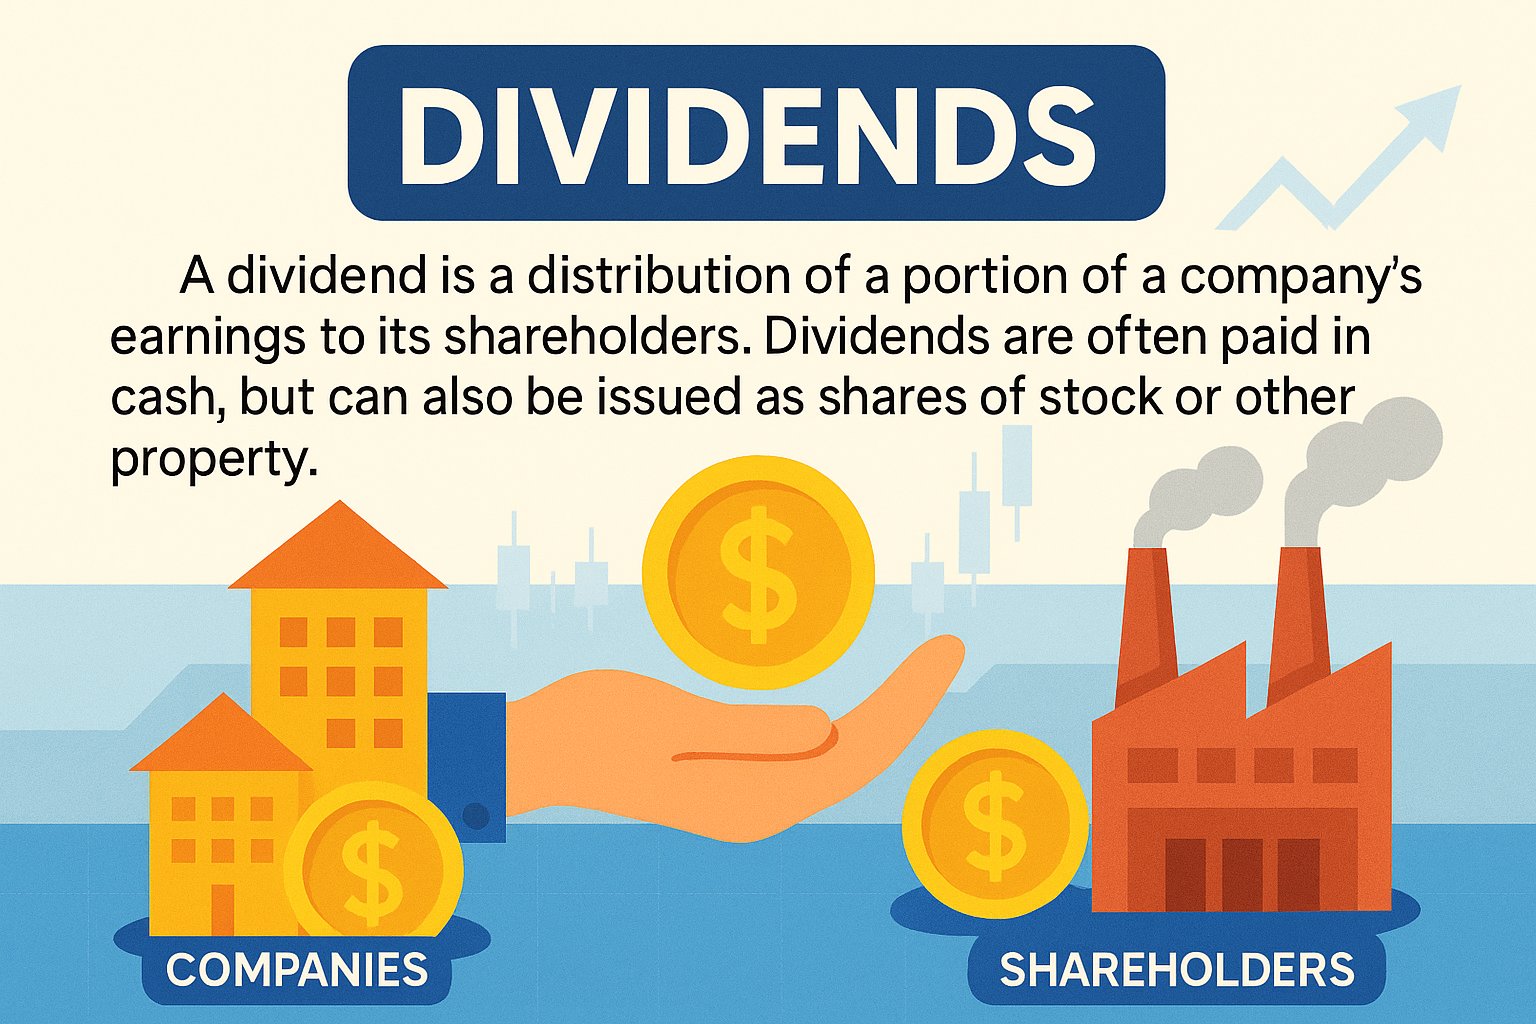
A dividend is part of a company’s profit that it gives back to its shareholders as a reward for investing in its shares.

varun beverages dividend 2025

Dividend Announcement Details

Type of DividendInterim dividend
Dividend Amount₹0.50 per share
Total Shares Eligible338,18,65,692 equity shares
Face Value per Share₹2 each

On April 30, 2025, the Board of Directors of Varun Beverages Limited announced an interim dividend of ₹0.50 per equity share with a face value of ₹2 each. The company fixed May 7, 2025 as the record date to determine eligible shareholders, while the dividend will be paid from May 9, 2025 onwards.

An interim dividend is paid before the full-year results are final. This shows the company’s confidence in its cash flow.

Important Dates

EventDate
Record Date7 May 2025
Ex-Dividend Date5 May 2025
Dividend PaymentFrom 9 May 2025 onwards

Only shareholders recorded by 7 May 2025 will receive the dividend. Payments begin on 9 May 2025.

Also Read – SBI Declares Dividend for 2025—Check SBI Dividend 2025-Record Date & Payment Details


Dividend History of Varun Beverages

DateTypeDetails
07-May-2025Interim Dividend₹0.50 per share
04-Apr-2025Final Dividend₹0.50 per share
09-Aug-2024Interim Dividend₹1.25 per share
04-Apr-2024Final Dividend₹1.25 per share

What Is the Final Dividend?

A final dividend is the part of profit that a company pays to its shareholders after it has published its full-year audited financial results. It usually follows the interim dividend.

Companies declare final dividends when they know the complete performance for the year.

Understanding Record Date and Ex-Dividend Date

  • Record Date: The cut-off date set by the company to determine which shareholders are eligible to receive the dividend. Only those who own shares on this date get the dividend.
  • Ex-Dividend Date: Usually one business day before the Record Date. If you buy shares on or after the Ex-Dividend Date, you will not be eligible for the dividend.

Varun Beverages Dividend 2025 – Tax Rules Explained

Since April 2020, dividends are taxable in the hands of shareholders. If your total dividend income exceeds ₹5,000 in a year, the company will deduct 10 percent TDS unless you submit a lower-tax certificate. You must include all dividend income when you file your tax return.


ALSO READ – What is a Dividend? – A Complete Guide in Simple Words

Varun Beverages – Recent Financial Highlights

MetricValue
Market Capitalisation₹1,78,884 Crore
Return on Equity (ROE)15.62%
Price-to-Earnings (P/E) Ratio68.96 (TTM)
Face Value₹2.00 per share
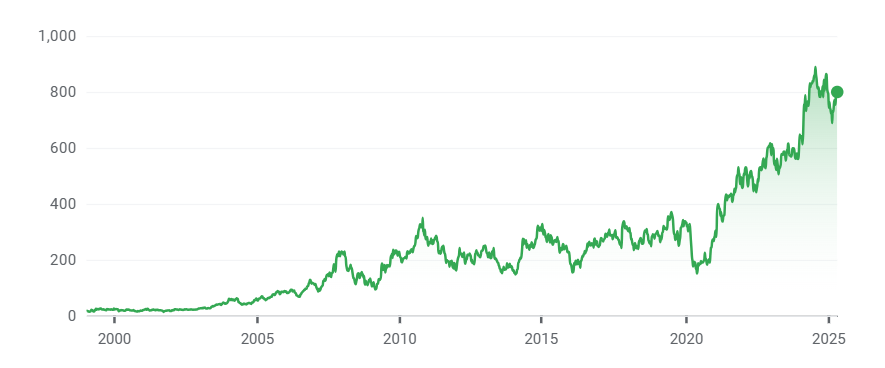
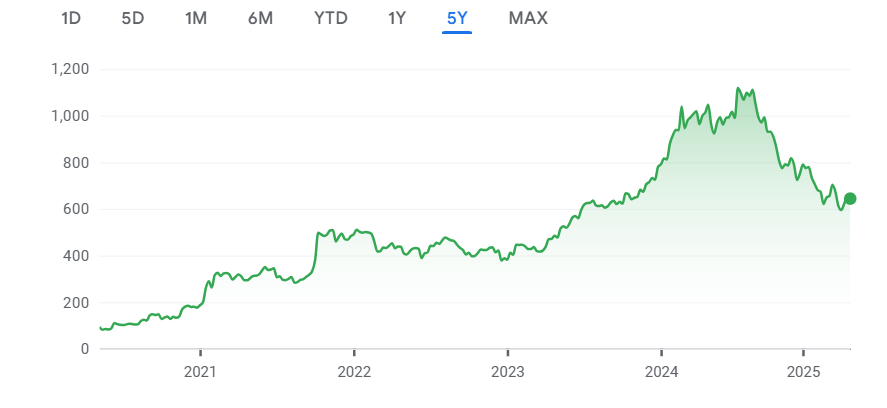
1-Year Stock Performance–11.54%

These figures show that Varun Beverages is a large, profitable company, even though its share price has dipped over the last year.


Eligibility for Dividend
To be eligible for the dividend, you must own shares on the Record Date. If you buy shares before this date and they appear in your demat account by then, you will qualify.

How to Apply for Varun Beverages dividend 2025?
You do not need to apply separately. The company and your broker will handle the process. As long as your shareholding and bank details are updated, the dividend will be directly credited to your bank account on or after 9 May 2025.

Also Read – Tata Motors Dividend 2025 Announced? – Record Date, Ex-Dividend Date & More

About Varun Beverages

Company NameVarun Beverages Limited
Stock SymbolBSE: 540180 NSE: VBL
IPO Year2016 (Listing date: November 8, 2016)
Stock ExchangeBSE, NSE
Market Cap₹ 1.77 lakh crore
FounderRavi Jaipuria
Incorporation1995
HeadquarterGurgaon, Haryana, India
SectorConsumer Defensive
IndustryFood and Beverage
SpecializationBottling & distribution of carbonated soft drinks, non-carbonated beverages, packaged drinking water

Varun Beverages Limited is one of the largest franchisees of PepsiCo in the world. The company was founded in 1995 and is based in Gurgaon, Haryana, India. It is primarily involved in the bottling and distribution of PepsiCo’s beverages, including popular soft drinks like Pepsi, Mountain Dew, Mirinda, 7UP, as well as packaged drinking water and fruit-based drinks. Varun Beverages operates a large network of manufacturing plants and has a strong presence in India and several international markets. The company is known for its strong growth, wide distribution network, and focus on operational efficiency.

Conclusion:
Varun Beverages has approved an interim dividend of ₹0.50 per share on 30 April 2025. Shareholders on the record date (7 May 2025) will receive payments from 9 May 2025 onward. The company’s strong market cap and healthy ROE underline its ability to share profits with investors.

What is the difference between an interim dividend and a final dividend?

An interim dividend is declared and paid before the company’s full-year audited results are final. It uses profits from part of the year. A final dividend is declared after the full-year results are audited and published. It reflects the company’s complete annual profit.

5 Best AI Tools for Pine Script to Supercharge Your TradingView Strategies (2025)

Best AI Tools for Pine Script

TradingView has made technical analysis easier for traders around the world. Its own coding language, Pine Script, helps traders build custom indicators and backtest strategies. But writing code is not easy for everyone. For beginners, it can feel confusing. Even expert traders may find it time-consuming. This is where AI tools are very helpful. These tools can convert your trading ideas into Pine Script code using simple instructions.

As of 2025, the top 5 AI tools helping traders with Pine Script are: ChatGPT, Claude, Perplexity, DeepSeek, and Grok. Let us now explore how each tool helps and which one may be best for your needs.

What is Pine Script?

Pine Script is TradingView’s programming language. It lets users build technical indicators, alerts, and trading strategies. You can create things like:

  • Moving average crossover strategies
  • RSI or MACD-based systems
  • Custom price action indicators

But Pine Script needs coding knowledge. This is where AI tools help you:

  • Convert your idea written in plain English to actual Pine Script code
  • Find and fix errors in your script
  • Make your script run faster
  • Explain tricky concepts in easy words

In short, AI tools save your time and make strategy building easier.

Top 5 AI Tools for Pine Script Strategy Creation

1. ChatGPT: Your All-Purpose Pine Script Partner

Why It’s Good:

  • Easy for beginners
  • Handles all types of indicators and strategies
  • Lots of tutorials and community support

Best For:

  • Beginners and those who want a quick solution

2. Claude: The Debugging and Optimization Expert

What It Does: Claude is created by Anthropic. It is very good at fixing errors and improving your code. It works well with Pine Script version 5 and helps with advanced tasks.

Why It’s Good:

  • Excellent at debugging
  • Helps build complex tools like options calculators

Best For:

  • Experienced traders who want clean and optimized code

3. Perplexity: Your Pine Script Research Buddy

What It Does: Perplexity is not a code generator. It is an AI search engine. It helps you learn about Pine Script concepts and market strategies.

Why It’s Good:

  • Great for understanding difficult topics
  • Complements other coding tools

Best For:

  • Traders who want to learn Pine Script and market terms

4. DeepSeek: The Free Strategy Converter

What It Does: DeepSeek AI is known for turning TradingView indicators into complete trading strategies. This can save you a lot of time.

Why It’s Good:

  • Converts indicators to strategies easily
  • Completely free to use

Best For:

  • Traders on a budget who want strategy creation support

5. Grok: The Future-Ready Coding Assistant

What It Does: Grok is developed by xAI. It is a newer AI tool but shows strong potential. It helps you write code step-by-step and is already being used to create EMA trend indicators and other custom tools.

Why It’s Good:

  • Helps you build complex strategies with guidance
  • Future potential is strong

Best For:

  • Traders looking for an advanced and growing AI solution

Also Read – Grok 3 for Trading Strategy-A Game Changer for Traders

Which Tool is Right for You?- A Quick Comparison

ToolBest ForKey FeaturesCostLearning Curve
ChatGPTBeginners & Versatile UseCode generation, tutorialsFree & PaidLow
ClaudeDebugging & OptimizationDebugging, explanationsPaidMedium
PerplexityResearch & LearningMarket knowledge, concept helpFreeLow
DeepSeekStrategy Conversion & Free UseConverts indicators to strategiesFreeMedium
GrokAdvanced CodingFuture-ready step-by-step guidanceFreeMedium

Tips:

  • If you are new to Pine Script, start with ChatGPT or Perplexity.
  • If you want to improve code quality, go with Claude.
  • If your focus is on strategy building, try DeepSeek or Grok.

Conclusion

In 2025, AI has changed how traders create Pine Script strategies. Tools like ChatGPT and Claude offer strong support for coding and fixing scripts. DeepSeek and Grok help with strategy building, while Perplexity is perfect for learning.

Your choice depends on:

  • Your experience level
  • Your goal (learning, coding, or optimizing)
  • Your budget

Try these tools and see which one works best for your TradingView journey.

Tata Motors Announces Dividend for 2025 – Ex-Dividend Date, Record Date & Payment Date

tata motors dividend 2025

In this article, we will discuss about Tata Motors Dividend 2025. We will cover the ex-dividend date, record date, and payment date for Tata Motors dividend for 2025. We will also talk about Tata Motors’ dividend history. Lastly, we will look at its recent financial performance and other key financial metrics.

Tata Motors 2025 Dividend Announcement

In an exchange filing dated 18th April 2025, Tata Motors announced that its Board of Directors will meet on 13th May 2025. During this meeting, the company will discuss and approve the audited financial results for the financial year 2024–25, announce the results for the fourth quarter (Q4), decide on the dividend for shareholders, and declare the dividend payment date for 2025.

Read the Official Notification Here

The meeting will be held through a conference call.

Tata Motors has announced that a conference call to discuss the tata motors dividend for 2025 and Q4FY25 results will start at 6:30 PM (India time) on 13th May 2025. The call will be attended by the Senior Management of Tata Motors and JLR.

You can also check the financial results on the official website once they are uploaded after the meeting.

Important Dates for Tata Motors Dividend 2025

Tata Motors has recommended a final dividend of ₹6 per share. This is 300% of the share’s ₹2 face value.

Also Read – Tata Motors Will Finalise Its 2025 Dividend on 20 June

If shareholders approve it at the annual general meeting (AGM), eligible shareholders will be paid on or before June 24, 2025.

The ex-dividend date for Tata Motors’ 2025 dividend is (to be announced on June 20, 2025.)

The record date for Tata Motors’ 2025 dividend is (to be announced on June 20, 2025.)

The payment date for Tata Motors’ 2025 dividend is on or before June 24, 2025.

tata motors 2025 dividend record date ex-dividend date payment date

Here is a quick table with important updates related to the 2025 dividend process:

EventDate
Dividend Declaration13 May 2025
Dividend StatusRecommended
Tata Motors 2025 Ex-Dividend DateTo be announced
Tata Motors Dividend 2025 Record DateTo be announced
Tata Motors 2025 Dividend Payment Dateon or before June 24, 2025

Tata Motors Dividend History

Tata Motors has a dividend yield of 0.47% in 2025. This means if you invest ₹100 in the company, you would earn ₹0.47 as a dividend in a year.

A lower dividend yield usually suggests that the company is either reinvesting its profits for growth or paying a smaller portion of earnings as dividends.

Here is a simple table showing Tata Motors’ dividend history:

DateAmount (₹)
11-Jun-2024₹3.00
11-Jun-2024₹3.00
28-Jul-2023₹2.00
18-Jul-2016₹0.20

Tata Motors has given dividends four times since 2016. The latest was on 11 June 2024, when it gave ₹6 in total (₹3 as a special dividend and ₹3 as the final dividend). This shows that Tata Motors has increased its dividend payout over time.

Also Read – Varun Beverages Announces Interim Dividend for 2025

Tata Motors AGM 2025 – Final Dividend Recommendation

The Board of Directors has fixed Friday, June 20, 2025 as the date of the 80th Annual General Meeting (AGM) of the company. At its meeting held today the Board recommended a final dividend of ₹6.00 per equity share of ₹2 each. This dividend is 300% of the share’s face value. If shareholders approve it at the AGM the dividend will be paid to eligible shareholders on or before June 24, 2025.

How to Apply for Tata Motors Dividend 2025?

You do not need to apply separately. Your broker and the company will handle everything on your behalf. Just make sure your shareholding details and bank account information are correct and updated. Once the dividend is declared and the payment date arrives, Tata Motors will directly credit the dividend amount to your bank account.

Tata Motors Dividend 2025 – Tax Rules Explained

Since April 2020, dividends are taxable in the hands of shareholders. If your total dividend income in a financial year is more than ₹5,000, Tata Motors will deduct 10% TDS (Tax Deducted at Source), unless you have submitted a valid lower-tax deduction certificate. You must report all your dividend income when filing your income tax return.


Tata Motors-Important Financial Metrics

Here are some important numbers about Tata Motors:

MetricValue
Market Capitalisation₹2.4 trillion
Return on Equity (ROE)20.24 %
Price-to-Earnings (P/E) Ratio7.70
Price-to-Book (P/B) Ratio2.83
5-Year Stock Return48 %
EPS (TTM)16.83
EPS Growth (TTM)66.95 %
tata motors dividend 2025 announcement

Also Read – Is ITC Giving a Dividend in 2025? – Ex-Dividend Date, Record Date, and Financial Results for Q4 FY25


About Tata Motors

tata motors stock dividend ev 2025
Company NameTata Motors Limited
Stock SymbolBSE: 500570NSE: TATAMOTORS
IPO Year1998 (Listing date: July 22, 1998)
Stock ExchangeBSE, NSE, NYSE
Market Cap₹ 2.40 lakh crore
FounderJ. R. D. Tata
Incorporation1945
HeadquarterMumbai, Maharashtra, India
SectorManufacturing
IndustryAutomotive
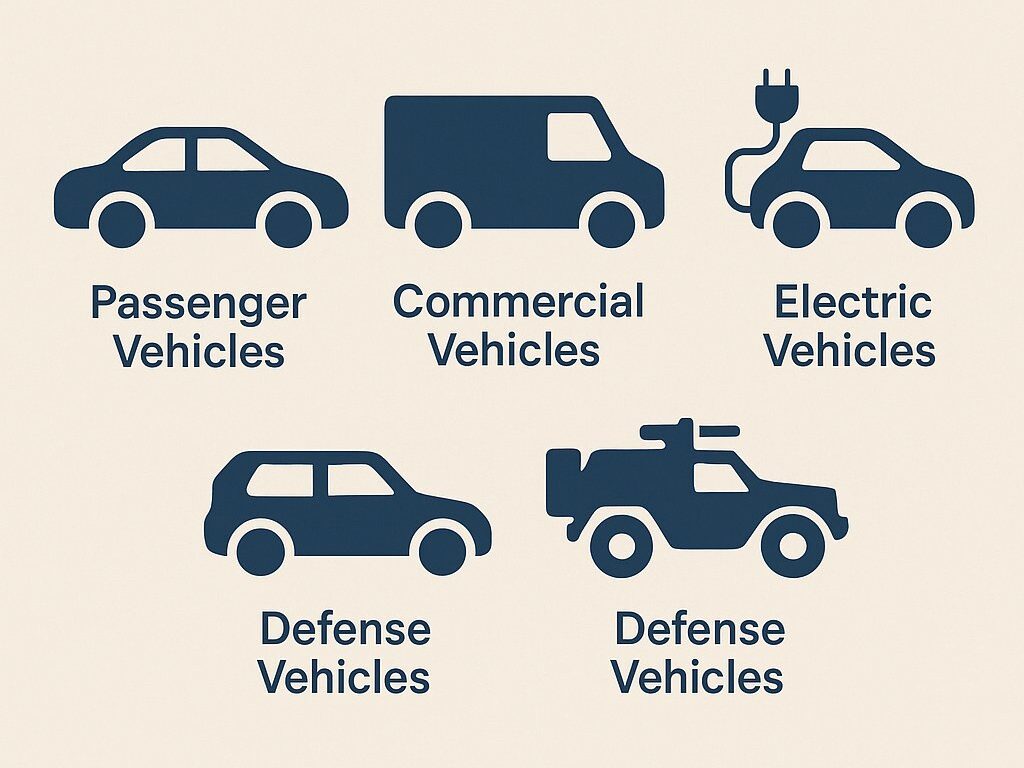
SpecializationPassenger cars, Commercial vehicles, Electric vehicles

Tata Motors Limited is a major Indian automobile company and part of the Tata Group, a large business group in India. Founded in 1945 as Tata Engineering and Locomotive Company (TELCO), it started by making locomotives and later moved into vehicle manufacturing. In 1954, Tata Motors produced its first commercial vehicle in collaboration with Daimler-Benz.​

Headquartered in Mumbai, Tata Motors manufactures a wide range of vehicles, including cars, trucks, buses, and defense vehicles. The company is India’s largest manufacturer of commercial vehicles and ranks among the top three in the passenger vehicle market. It also leads the electric vehicle (EV) segment in India, with popular models like the Tata Nexon EV and Tigor EV.

Tata Motors has a global presence, operating in over 175 countries. It owns several subsidiaries, including Jaguar Land Rover (UK) and Tata Daewoo (South Korea). The company has manufacturing plants in India and other countries like the UK, South Korea, Thailand, and South Africa

In 2008, Tata Motors acquired the British luxury car brands Jaguar and Land Rover from Ford, marking a significant step in its global expansion. The company continues to invest in research and development, focusing on sustainable and innovative mobility solutions.​

As of 2025, Tata Motors is planning a major restructuring to split into two separate listed entities, aiming to enhance operational efficiency and focus on distinct business segments. This move is expected to allow each entity to pursue tailored growth strategies and attract specific investor bases.​

Tata Motors is listed on the Bombay Stock Exchange (BSE) and the National Stock Exchange (NSE) in India. The company is known for its commitment to quality, innovation, and sustainability in the automotive industry.

Also Read – Indian Oil Corporation Dividend 2025 Update


Conclusion:
Tata Motors may announce a dividend in the upcoming board meeting on 13 May 2025. Based on its past record and financial performance, investors can be hopeful for a good payout.

Has Tata Motors announced the record date for the 2025 dividend?

As of now, Tata Motors has not officially announced the record date for its 2025 dividend. It will be announced after the Board of Directors meeting on 13 May 2025.

Has Tata Motors announced the ex-dividend date for 2025?

No, Tata Motors has not yet announced the ex-dividend date. It will be declared along with the record date after the Board meeting.

Is there any difference between Tata Motors dividend 2025 and Tata Motors stock dividend EV 2025?

As of now, there is no difference between “Tata Motors dividend 2025” and “Tata Motors stock dividend EV 2025” because the electric vehicle (EV) business operates under the same company — Tata Motors Limited. There is no separate stock or listing for the EV division. So, if the company declares a dividend in 2025, it will apply to all shareholders, including those interested in the EV segment. Any updates related to dividends will be part of the company’s overall announcement and not specific to EV operations.

ProShares to Launch Three XRP ETFs: A New Era for Cryptocurrency Investment

proshares-to-launch-three-xrp-etfs

On April 30, 2025, ProShares will introduce three exchange-traded funds (ETFs) centered on XRP, following approval from the SEC (Securities and Exchange Commission).

This launch represents a major step toward integrating cryptocurrency into traditional financial systems.

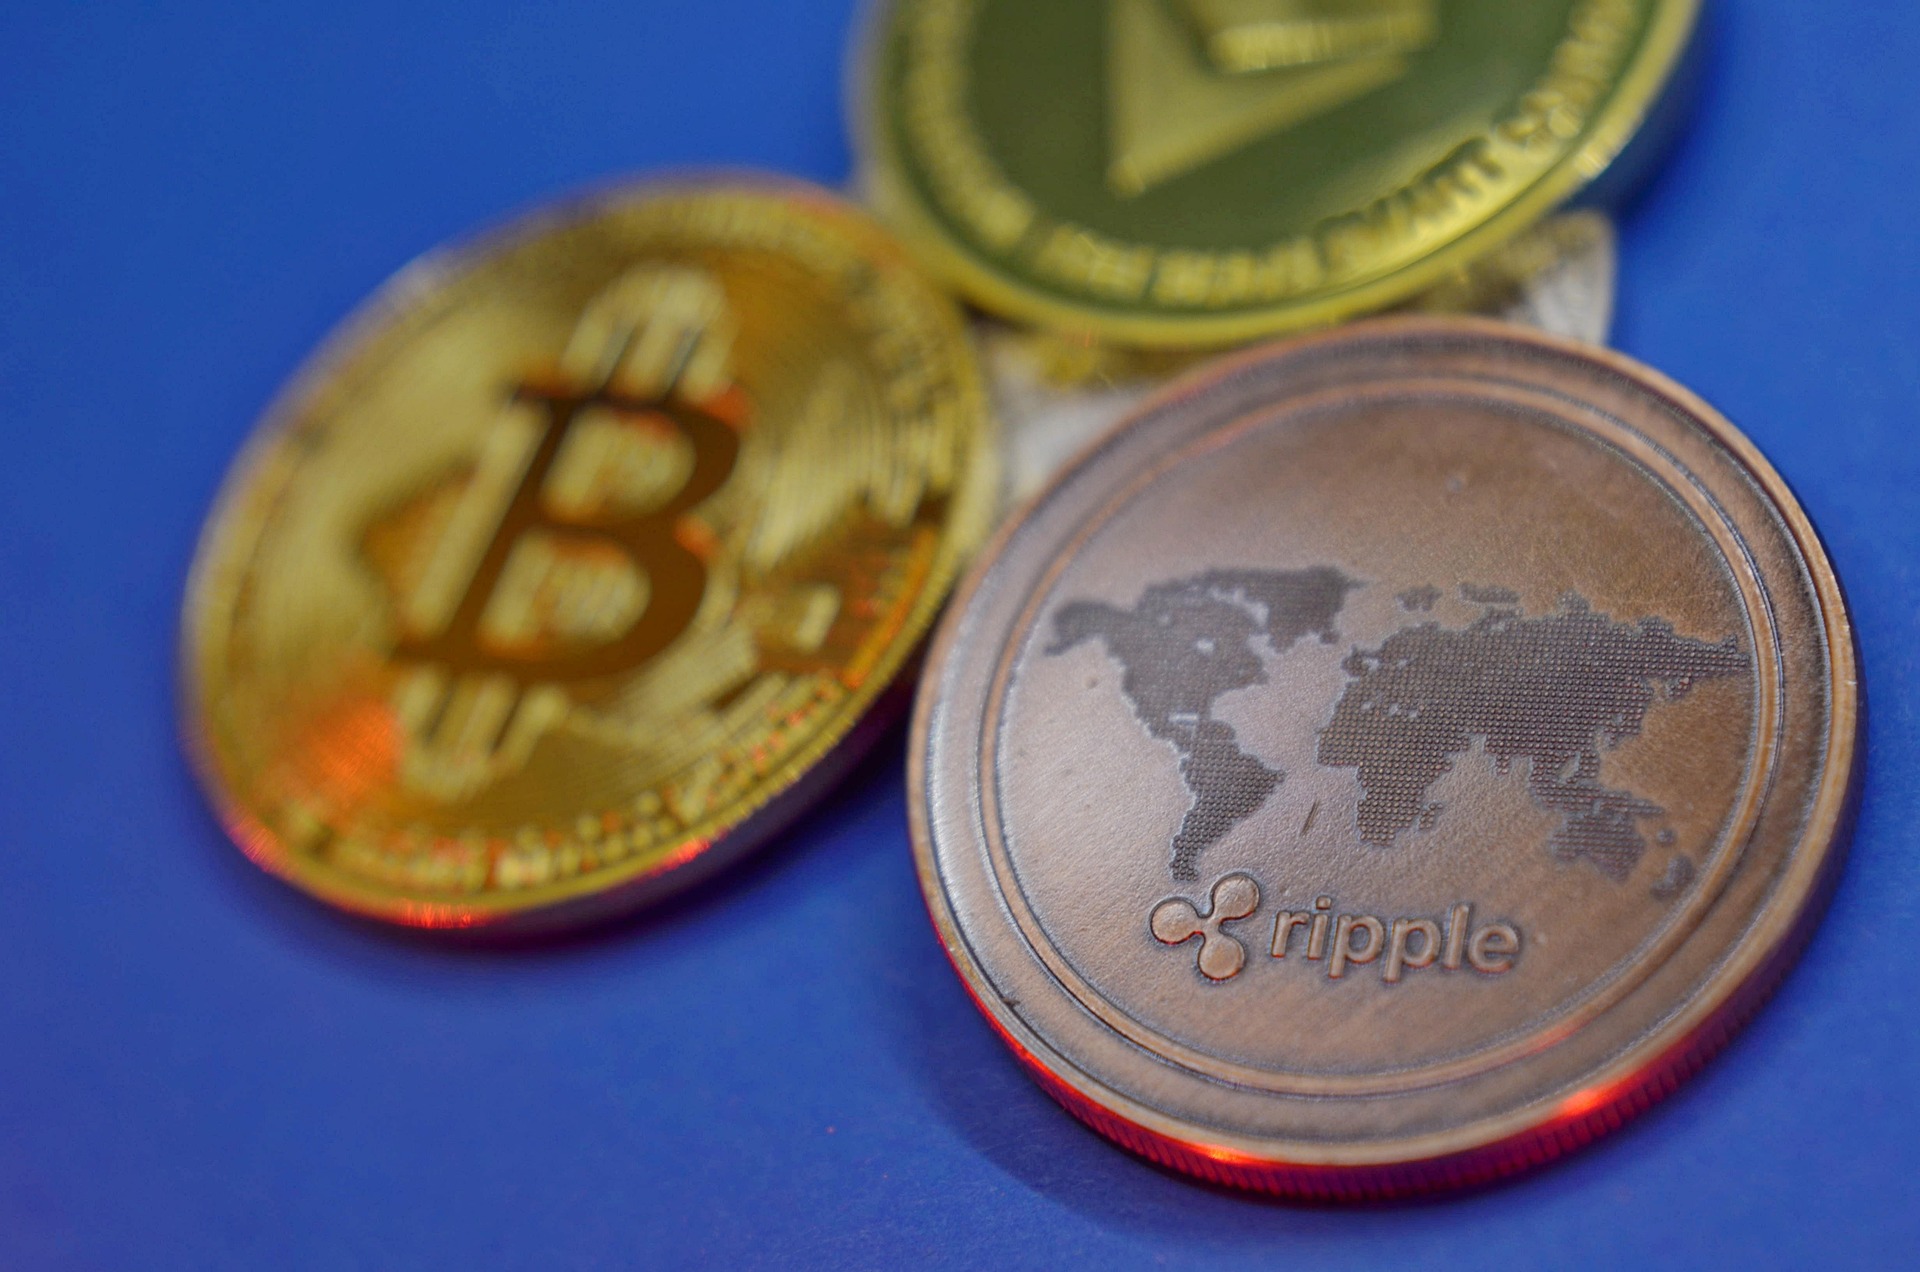
The ETFs—ProShares UltraShort XRP ETF, ProShares Ultra XRP ETF, and ProShares Short XRP ETF—will provide investors with leveraged and inverse exposure to XRP via futures contracts rather than direct ownership. Coming on the heels of Ripple’s legal settlement with the SEC, this development may enhance XRP’s adoption, though the leveraged nature of these ETFs introduces significant risks for investors.

Key Points

  • ETF Types: Leveraged (2x) and inverse (-1x, -2x) ETFs based on XRP futures.
  • Launch Date: April 30, 2025.
  • Regulatory Context: Enabled by Ripple’s resolution of SEC legal issues.
  • Market Impact: Potential to boost liquidity, though leverage may increase volatility.
  • Investor Caution: High-risk products due to amplification of gains and losses.

What Is XRP?

XRP is a digital currency that powers quick and low-cost cross-border payments. Unlike Bitcoin, which relies on mining and a decentralized network, XRP uses a special consensus mechanism. This means transactions are processed faster—often in just a few seconds—and use less energy. It’s built to help banks and financial institutions move money across borders more efficiently.

How Does It Work?

XRP acts as a bridge currency in Ripple’s payment network. Imagine you need to send US dollars (USD) to someone who wants euros (EUR). Instead of a slow, expensive bank transfer, XRP can be used as an intermediary: USD converts to XRP, then XRP converts to EUR. This process cuts down both time and fees, making it a favorite for international payments.

Understanding the ProShares XRP ETFs

ProShares, a prominent ETF provider, is rolling out three distinct XRP-focused ETFs:

  • ProShares UltraShort XRP ETF: Targets twice the inverse (-2x) daily performance of XRP futures.
  • ProShares Ultra XRP ETF: Aims for twice (2x) the daily performance of XRP futures.
  • ProShares Short XRP ETF: Seeks inverse (-1x) daily performance of XRP futures.
XRP ETFs

These ETFs rely on futures contracts and swaps rather than holding XRP directly, aligning with regulatory standards and broadening access for traditional investors. More details can be found on the ProShares website.

What Is ProShares?

ProShares is a company in the United States that creates ETFs (Exchange-Traded Funds).
These are special investment products that you can buy and sell just like stocks.

ProShares makes different types of ETFs – some go up when the market goes up (called “Ultra”), and some go up when the market goes down (called “UltraShort”).
They also offer ETFs focused on specific sectors like technology, finance, or industry.

What are ETFs?

An Exchange-Traded Fund (ETF) is a type of investment fund traded on stock exchanges, similar to stocks, holding assets like stocks, bonds, commodities, or cryptocurrency futures. For cryptocurrencies, ETFs provide exposure without direct ownership, addressing regulatory and custody challenges.

Significance of the Launch

The introduction of these ETFs carries several important implications:

  • Regulatory Clarity: The SEC’s approval follows Ripple’s legal settlement, removing key obstacles for XRP-related financial products.
  • Institutional Interest: These ETFs may draw institutional investors, enhancing XRP’s market liquidity.
  • Market Precedent: The success of Teucrium’s prior XRP ETF launch suggests strong demand.

Market Reactions and Sentiment

The crypto community has responded positively, particularly on social media platforms like X.

This enthusiasm highlights expectations of wider cryptocurrency adoption, tempered by awareness of the risks tied to leveraged ETFs.

ALSO READ – These Altcoins Are Soaring: Should You Jump on $TURBO, $ALPACA, and $VIRTUAL?

Risks and Considerations

Leveraged ETFs come with inherent risks that investors must carefully weigh:

  • Volatility: Cryptocurrency markets are highly volatile, and leverage can magnify losses significantly.
  • Daily Rebalancing: These ETFs are designed for short-term trading, not long-term investment, due to their daily performance objectives.

Prospective investors are encouraged to seek advice from financial professionals before committing funds.

Conclusion

The debut of ProShares’ XRP ETFs on April 30, 2025, could reshape the cryptocurrency investment landscape, offering innovative options for exposure to XRP while introducing elevated risks. As the market continues to mature, these ETFs may signal further advancements in crypto finance, though prudence remains essential for investors.

Disclaimer

This article is intended for informational purposes only. Cryptocurrency investments involve substantial risks. Please consult a financial advisor before making investment decisions.

ALSO READ – Crypto Trading – A Complete Master Guide for Beginners

When is the XRP ETF launch date by ProShares?

ProShares is set to launch three XRP-focused ETFs on April 30, 2025.

These Altcoins Are Soaring: Should You Jump on $TURBO, $ALPACA, and $VIRTUAL?

alt coins

You may hear people talking about $TURBO, $ALPACA, and $VIRTUAL. In the last 24 hours, they jumped by 12.7%, 30.8%, and 39.8%. They now lead CoinGecko’s trending list. Many investors are moving gains out of Bitcoin (around $93,687) and into smaller coins.

Let’s break down what is happening and whether you should look into these tokens.

$TURBO: The Meme Coin on the Move

  • What happened? $TURBO went up 12.7% in one day. Trading volume shot higher.
  • Why the jump?
    • A lively online community is using hashtags like #TurboToTheMoon.
    • It has a small market cap. Smaller coins can swing up or down quickly.
    • Rumors say it might link up with a play-to-earn game, though nothing is confirmed.
  • Should you buy?
    Meme coins can reward early buyers. But they often rely on hype, not real use. Watch for solid news about partnerships. And only risk money you can afford to lose.

$ALPACA: DeFi’s Comeback Story

  • What happened? $ALPACA rose by about 30.8%. It saw $336.6 million in trades.
  • Why the jump?
    • Trading platforms like Bitget added new ALPACA/USDT margin pairs.
    • DeFi (decentralized finance) is regaining interest. People want yield farming projects.
    • Community talk is strong, with many users posting positive messages.
  • Should you buy?
    $ALPACA has clear use in DeFi. But yield farming can be complex and risky. Learn how the protocol works. Check fees, interest, and potential losses before you invest.

$VIRTUAL: Betting on AI and Blockchain

  • What happened? $VIRTUAL surged 39.8% in a day. It once pumped over 24,900% earlier this year.
  • Why the jump?
    • AI-focused tokens are in demand. Investors think AI will change how blockchains work.
    • With a low market cap, big percentage moves are possible.
    • Tech-savvy traders like its plan for on-chain AI tools and smart contracts.
  • Should you buy?
    AI tokens may lead the next big crypto cycle. But they can also drop faster than they rise. Read the project roadmap. Look at the team’s background. Don’t invest more than you can handle losing.

Is This an Altcoin Season?

Bitcoin’s dominance is near 45%. That often means money flows into smaller coins. Past cycles show altcoin gains after Bitcoin slows down. U.S. regulators are easing their stance on crypto. Political support for Bitcoin is also growing. All this can fuel altcoin rallies.

But remember this market moves fast. Big gains come with big drops. To stay safe:

  1. Do your homework. Read whitepapers and team bios.
  2. Manage risk. Only use funds you can lose.
  3. Set limits. A stop-loss order can cap your losses.
  4. Watch news channels. Follow real updates on CoinGecko or X.

$TURBO, $ALPACA, and $VIRTUAL are today’s top gainers. They each have their own story of hype, utility, or tech promise. Whether they can keep climbing is anyone’s guess. If you decide to jump in, move carefully and stay informed. Let us know which altcoin you’re watching right now!

You Do Not Have to Pay Capital Gains Tax on Stocks If…

Ways to Avoid Paying Capital Gains Taxes

When you sell equity shares or equity mutual funds you usually pay a tax on the profit.

These profits are called capital gains. There are two types of capital gains:

  • Long-Term Capital Gains (LTCG): When you hold an investment for more than one year.
  • Short-Term Capital Gains (STCG): When you hold it for one year or less.

But you do not have to pay any tax on these gains in four situations.

A tax expert, CA Dr Suresh Surana, explains these in an Upstox article updated on April 26, 2025. [ No tax on LTCG and STCG from equity mutual funds and shares in these four conditions, says expert ]


1. Your Total Income Is Below the Basic Exemption Limit

If all your income added together (salary, interest, capital gains, etc.) is less than the basic exemption limit then you owe no tax on capital gains.

2. The Transaction Is Not Taxable

Some transfers do not count as a “sale” under the law. For example:

  • You gift shares to a close relative.
  • You transfer shares into an irrevocable trust.

These transfers are not treated as capital gains events. So you pay no tax on them.

3. Your Gain Is Within the Exemption Limit

Under Section 112A of the Income Tax Act you get an exemption of up to ₹1.25 lakh on LTCG each financial year. This applies only if Securities Transaction Tax (STT) was paid when you bought or sold the shares or equity funds. Any gain above ₹1.25 lakh is taxed at 10% without indexation.

4. You Reinvest the Gain in a Home (Section 54F)

You can claim full exemption on LTCG if you use the sale proceeds to buy or build one residential house. You must not own more than one house on the date of sale. You must buy the new house within one year before or two years after the sale. If the house is under construction you get three years to complete it.

In any of these four cases you keep your full profit from selling equity shares or funds without paying capital gains tax. If you think you qualify speak to a chartered accountant before you file your return.

Also Read – Is there any difference between a sector and an industry?

Tax + Cess + Surcharge: Simple Guide to Indian Taxes

Tax + Cess + Surcharge

When we talk about paying taxes in India, we usually hear terms like Tax, Cess, and Surcharge. These are all parts of the money we pay to the government. But what do they really mean? Let’s understand each part in a simple way.

What is TAX?

Tax is the main amount that the government collects from people and companies. This money is used for the country’s development like building roads, schools, hospitals, and paying government workers.

There are two main types of taxes:

a) Direct Tax

You pay this tax directly to the government.

  • Example: Income Tax
    If you earn more than a certain limit in a year, you pay income tax based on how much you earn.

b) Indirect Tax

You pay this tax when you buy something.

Example: GST (Goods and Services Tax)
When you buy a product or use a service, GST is already added to the price.


2. What is “Surcharge”?

Surcharge is an extra tax charged on the base tax amount. But here’s the twist — it applies only if your income is high.

Surcharge Rates (FY 2023-24):

Income LevelSurcharge Rate
₹50 lakh – ₹1 crore10%
₹1 crore – ₹2 crore15%
₹2 crore – ₹5 crore25%
Above ₹5 crore37% (capped at 25% for some types of income)

So, if your income is below ₹50 lakh, you don’t need to pay any surcharge.


3. What is “Cess”?

Cess is a small extra amount added to support specific government projects. Right now, we have a 4% Health and Education Cess.

It is charged on the total of Tax + Surcharge.

So,
👉 Cess = 4% of (Tax + Surcharge)


Putting It All Together: An Example

Let’s say Mr. Arjun earns ₹60 lakh in a year. He comes under the old regime and does not claim any deductions.

Step-by-step Calculation:

  1. Calculate Basic Tax using slab:
    • Tax = ₹13,12,500
  2. Add Surcharge (10% because income is above ₹50 lakh):
    • Surcharge = 10% of ₹13,12,500 = ₹1,31,250
  3. Add Cess (4% on tax + surcharge):
    • Cess = 4% of (₹13,12,500 + ₹1,31,250) = ₹57,750
  4. Total Tax Payable =
    👉 ₹13,12,500 (Tax)
    👉 + ₹1,31,250 (Surcharge)
    👉 + ₹57,750 (Cess)
    👉 = ₹15,01,500

So, even though the base tax was ₹13.12 lakh, the final amount becomes ₹15.01 lakh after adding surcharge and cess.


Why Does the Government Add Surcharge and Cess?

  • Surcharge is mainly for people with higher incomes. The government believes those who earn more should contribute more.
  • Cess is collected for a specific reason. In this case, it’s for health and education. It helps the government fund programs for the poor and improve basic facilities in the country.

Summary Table

ComponentApplies ToPurpose
TaxEveryone based on slabsMain source of government revenue
SurchargePeople earning ₹50 lakh+Extra tax on rich individuals
CessEveryoneFor health and education funding

What is Income Tax?

Income Tax is the money we pay to the government from our earnings. This money helps the government to build roads, schools, hospitals, and much more.

In India, people are taxed based on how much money they earn in a year. This is called a slab system.

Final Thoughts

So, when you hear someone talk about taxes in India, always remember it is not just a single number. The correct structure is:

Tax + Cess + Surcharge

Understanding this structure helps you know where your money goes and why you are paying a bit more than just the slab rate. It also helps you plan your income, savings, and tax-saving investments better.

What is a Candlestick? – A Simple Guide for Beginners

What is a Candlestick?

Trading is more about technical analysis, and in technical analysis, candlestick charts are used the most. Buying or selling decisions are made by observing price action created by candlesticks.

Technical Analysis → Price Action → Candlestick Charts

In this article, we will learn what a candlestick is and how it is formed.

Important Terms to Know Before Proceeding:

  1. Time Frame – A time period such as 24 hours in a go, which is called a daily time frame. It represents the interval between the market’s opening and closing time.
  2. Price Action – Simply means how the price behaves and moves in a chart.
  3. Line Chart – Shows only the closing price (such as the last price of the daily time frame).
  4. Candlestick Chart – Shows four price points of a session: Opening Price, High Price, Low Price, and Closing Price.

What is a Candlestick?

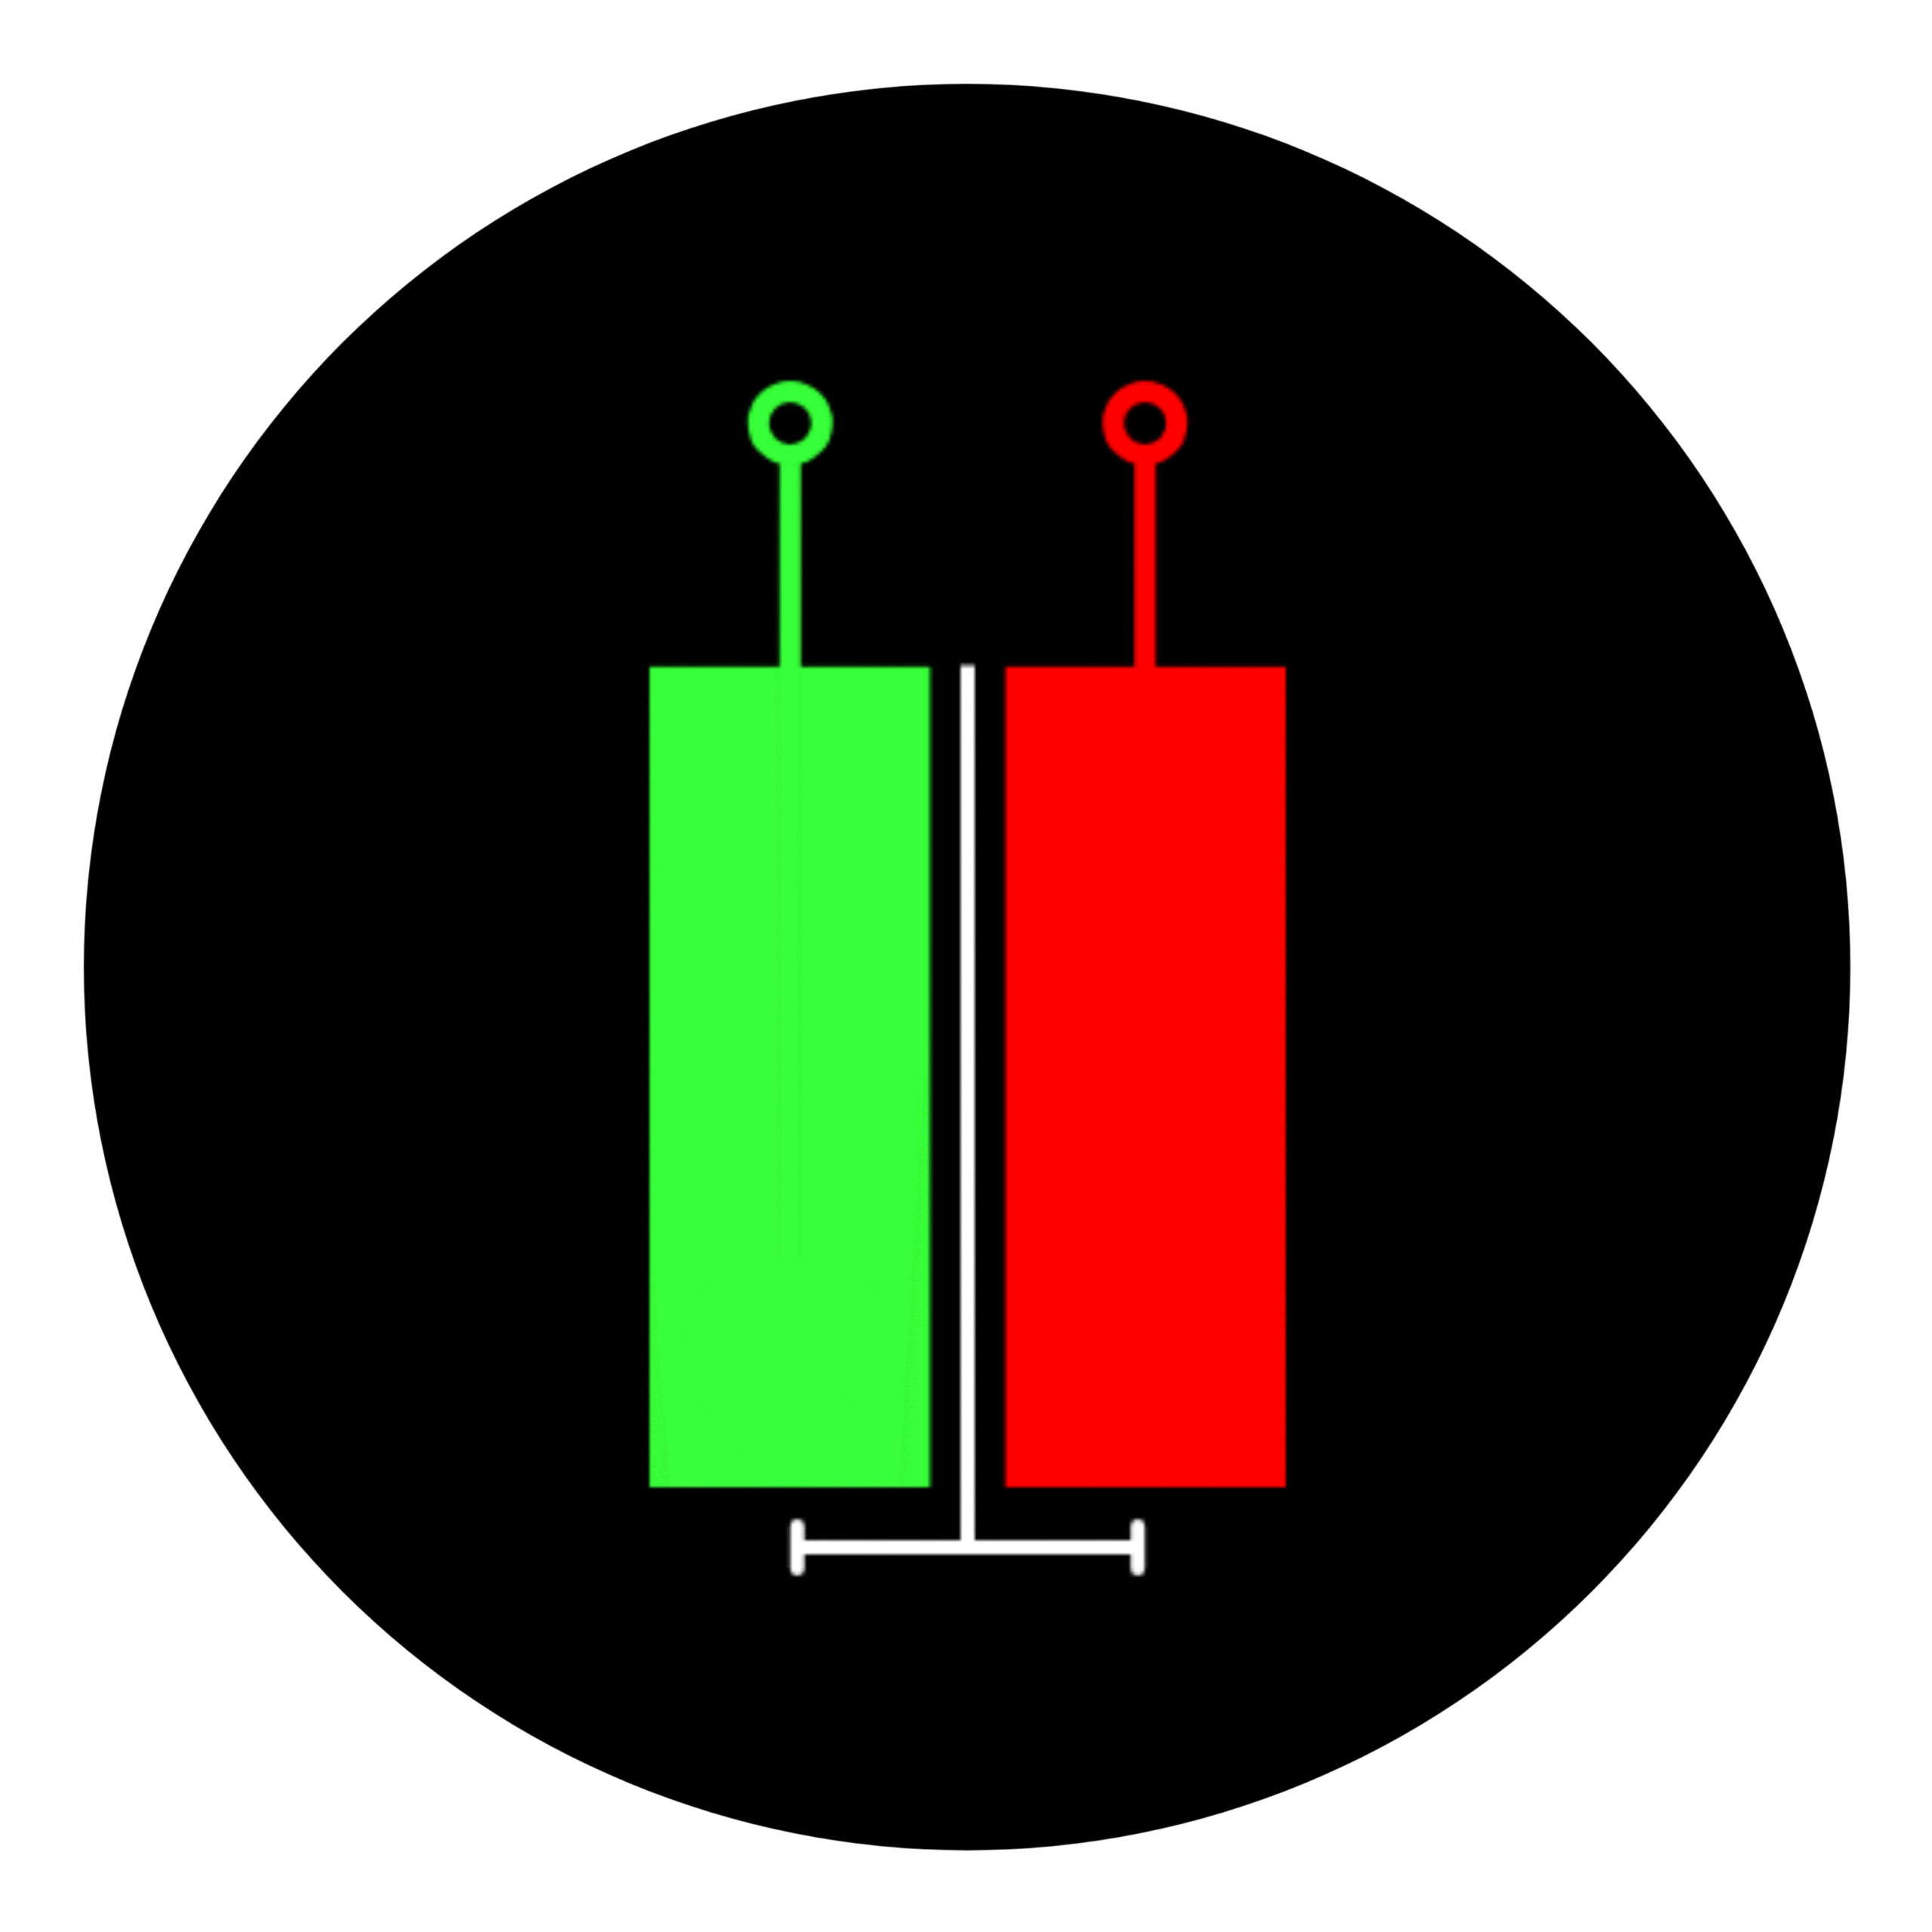
A candlestick is a figure that denotes four types of prices within a given time frame, such as a daily time frame.

It consists of two parts:

  1. A Body – The main portion of the candlestick that represents the difference between the opening and closing prices.
  2. A Wick (Shadow) – The thin lines extending from the body, representing the highest and lowest prices of the time frame.

How is a Candlestick Formed?

To understand how a candlestick is formed, let’s consider a daily time frame where the stock market opens at 9:15 AM and closes at 3:30 PM. The market activity throughout the entire day is represented by one candlestick for that day.

Example:

Suppose there is a stock named “Apple”, and its price movements on a particular day (Monday) are as follows:

  • Opening Price (at 9:15 AM): ₹100
  • Lowest Price (at 11:00 AM): ₹80
  • Highest Price (at 1:00 PM): ₹160
  • Closing Price (at 3:30 PM): ₹140

How This Reflects on a Candlestick:

  • The body of the candlestick will be formed between ₹100 (opening price) and ₹140 (closing price).
  • The wick will extend from ₹80 (lowest price) to ₹160 (highest price).

If the closing price is higher than the opening price (₹140 > ₹100), the candlestick is usually colored green (bullish candle), indicating a price increase.

If the closing price is lower than the opening price, the candlestick is usually red (bearish candle), indicating a price drop.

How Are Candlestick Charts Different from Other Chart Types?

Apart from line charts, which only show closing prices, there are other chart types like bar charts and OHLC charts that also display price data. However, candlestick charts are visually more informative. Let’s see how they differ:

  1. Bar Charts – These use vertical lines to show the high and low prices. The opening price is marked by a small horizontal tick on the left, and the closing price is marked on the right. However, since bar charts do not have a filled body, it is harder to quickly understand whether the price moved up or down.
  2. OHLC Charts – These are similar to bar charts because they also show the open, high, low, and close prices. However, unlike candlestick charts, they do not use colors to indicate price movement. Candlestick charts use green to indicate price increase (bullish movement) and red to indicate price decrease (bearish movement), making them easier to interpret.

Why Are Candlestick Charts Preferred?

Candlestick charts are preferred because they provide a clear and easy-to-read format.

The colored bodies make it simple to understand price movement at a glance, helping traders make quicker decisions based on price trends.

Why Oil Company Shares Are Falling Today?

Why Oil Company Shares Are Falling Today?

Oil company shares are dropping today because crude oil prices are going down. This is happening after OPEC+ decided to pump more oil into the market. In this article, we’ll explain why oil company shares are falling, how OPEC+ affects oil prices, what crude oil is, and what inventory has to do with it. We’ll also look at other important factors that affect crude oil prices. Everything will be explained in a clear and simple way.

What is OPEC+?

OPEC+ is a group of countries that produce a lot of the world’s oil. It includes OPEC (Organization of the Petroleum Exporting Countries) members, like Saudi Arabia, and other big oil-producing countries like Russia.

Together, they decide how much oil to produce. This decision affects oil prices around the world. When they produce more oil, prices usually go down. When they produce less, prices can go up.

Recently, OPEC+ agreed to increase oil production by 411,000 barrels per day starting in May. This extra oil is expected to hit the market soon, and that’s why crude oil prices are falling now.


What is Crude Oil? Explaining Brent and WTI

Crude oil is the raw liquid taken from the ground. It is used to make products like petrol, diesel, plastic, and more.

There are two major types of crude oil:

  • Brent Crude – This comes from the North Sea and is used to set prices in Europe, Africa, and the Middle East.
  • WTI (West Texas Intermediate) – This comes from the United States and is used to set prices in North and South America.

Right now, both Brent and WTI prices are going down because of the extra oil that OPEC+ plans to release.


Why Are Oil Company Shares Falling?

Oil companies make money by digging up oil and selling it. When oil prices are high, they earn more profit. But when prices fall, they earn less.

Investors, who own small parts of these companies through shares, look at oil prices to guess how much profit the companies will make. If they think profits will drop, they sell their shares.

So, as crude oil prices are falling, investors are selling their shares in oil companies. This is why oil company share prices are falling today.


The Connection Between Oil Company Shares and OPEC+

OPEC+ plays a big role in oil prices. When they increase oil production, like they did recently, more oil enters the market.

If demand doesn’t go up along with supply, oil prices fall. When oil prices fall, oil companies earn less money. This makes their shares less attractive to investors. So, when OPEC+ increases supply, it often leads to a drop in oil company shares too.


Why Investors Are Selling Oil Now

Investors are scared that prices may fall even more in the coming days. So they are selling their oil-related shares now before the prices drop further.

It’s like if you own a rare toy and find out that more of the same toy is going to be released. You might try to sell your toy now before its value falls.

This rush to sell is pushing crude oil prices even lower and bringing down oil company shares along with it.


How Inventory Affects Crude Oil Prices

Inventory means the oil that is stored but not yet used or sold. It works like a backup supply.

  • High Inventory = Lower Prices: If there’s too much oil stored, prices drop because there’s more supply than demand.
  • Low Inventory = Higher Prices: If there’s not much oil in storage, supply is limited, and prices go up.

With OPEC+ adding more oil to the market, inventory might go up. If that happens, prices may stay low for a longer time.


How Inventory Affects Company Profits

Many oil companies store oil that they produced or bought when prices were high. If prices fall, they may have to sell this oil at a loss.

For example, if a company bought oil for $70 per barrel but now it’s worth $60, they lose $10 for every barrel.

This reduces company profits. When investors see this, they worry even more and sell more shares, which pushes share prices even lower.


Important Factors That Affect Crude Oil Prices

Crude oil prices do not only depend on OPEC+. There are several other reasons why oil prices can go up or down. Here are the main ones:

1. Supply and Demand

If oil supply is high and demand is low, prices fall. If demand is high and supply is low, prices rise.

2. OPEC+ Decisions

When OPEC+ cuts or increases oil production, it directly affects prices.

3. Geopolitical Tensions

War or political problems in oil-producing countries can reduce supply and push prices up.

4. Natural Disasters and Weather

Storms and hurricanes can damage oil rigs and reduce supply, causing prices to go up.

5. U.S. Dollar Strength

Oil is traded in U.S. dollars. A strong dollar can make oil expensive for other countries and reduce demand, lowering prices.

6. Economic Growth

When the world economy is growing, demand for oil goes up, which can raise prices. In slowdowns, demand falls and prices drop.

7. Oil Inventory Levels

High inventory lowers prices. Low inventory increases prices.

8. Government Policies and Taxes

New rules, taxes, or restrictions on oil use or production can also affect oil prices.

9. Technological Advancements

Better drilling or more electric vehicles can change how much oil is needed or produced, affecting prices.


In short, the reason oil company shares are falling today is mostly because of OPEC+ increasing supply. This is making prices drop. Add to that worries about profits and growing inventories, and investors are quickly pulling out of oil stocks.

What is F&O? – Important Concepts You Must Know

what is f&o

The stock market offers several ways to trade beyond just buying and selling stocks. One of the most powerful tools for traders and investors is Futures and Options.

If you are wondering what F&O is, or what is the meaning of F&O in the share market, here’s a simple explanation.

Futures and Options are known as derivative instruments, which means their value comes from an underlying asset. This asset can be anything like stocks, stock indices, cryptocurrency, crude oil, natural gas, gold, silver, and more.

In F&O trading, you do not buy or sell the actual asset. Instead, you trade contracts based on how you think the price of the asset will move in the future. This is why many traders prefer F&O in the share market—to either make profits or protect their investments from risk.

The full form of F&O is Futures and Options, and both work differently:

  • A Futures contract is an agreement to buy or sell an asset at a fixed price on a future date.
  • An Options contract gives you the right, but not the obligation, to buy or sell the asset at a set price before the expiry date.

Understanding Derivatives With a Simple Example

Think of an orange as an asset and its juice as its derivative. The price of orange juice depends on the price of oranges. If oranges become expensive, juice prices will rise. If oranges become cheap, juice prices will fall.

Similarly, derivatives like Futures and Options (F&O) depend on the price of their underlying asset. These were originally created for hedging, which means reducing risk. But before we understand F&O, let’s first explore different types of derivatives.


Types of Derivatives

There are four main types of derivatives, and they are generally categorized in the following order:

1. Forward Contracts (Oldest Form of Derivatives)

A Forward Contract is a private agreement between two parties to buy or sell an asset at a fixed price on a future date.

These contracts are customized and are not traded on exchanges.

Example: A wheat farmer agrees to sell 1000 kg of wheat to a buyer at a fixed price after three months. No matter how market prices fluctuate, the deal remains unchanged.

Key Features:

  • Customized contract
  • High counterparty risk
  • Not regulated by exchanges

2. Futures Contracts

Futures are similar to forward contracts but are standardized and traded on exchanges. They eliminate the counterparty risk of forwards because a clearing house acts as an intermediary.

Example: A trader buys a Gold Futures contract expecting gold prices to rise in the next two months.

Key Features:

  • Traded on stock exchanges (e.g., NSE, BSE)
  • Standardized contract size and expiry
  • Requires margin (initial deposit)

3. Options Contracts

An Options Contract gives the buyer the right, but not the obligation, to buy or sell an asset at a predetermined price before expiry.

Types of Options:
Call Option – Right to buy an asset at a fixed price before expiry.
Put Option – Right to sell an asset at a fixed price before expiry.

Example: Suppose you buy a Call Option on Reliance shares. If the price goes up, you can buy the shares at a lower price and make a profit. If the price goes down, you can let the contract expire and only lose the premium paid.

Key Features:

  • No obligation to buy or sell
  • Limited risk (only the premium paid)
  • Used for hedging and speculation

4. Swaps

A Swap is a financial contract where two parties exchange financial instruments, such as interest rates or currencies, over time. Swaps are mostly used by large corporations and financial institutions.

Types of Swaps:
🔹 Interest Rate Swaps – Exchange of fixed and floating interest rates.
🔹 Currency Swaps – Exchange of cash flows in different currencies.

Example: A U.S. company with a loan in Indian Rupees (INR) can swap its interest payments with an Indian company that has a loan in U.S. Dollars (USD) to benefit from lower interest rates.

Key Features:

  • Used for risk management
  • Not traded on exchanges
  • Complex financial structure

Among these, Futures and Options are the most popular derivatives used in the stock market.


F&O contracts were originally created for hedging purposes. But before we move ahead, let’s first understand:

What is Hedging?

Hedging means reducing risk or capping your gains and losses. Here’s a simple example:

Suppose you have two smartphones, and you log in to two different demat accounts with different brokers on different phones.

  • On Phone 1, you buy a stock.
  • On Phone 2, you short-sell the same stock.

Now, no matter where the stock moves, you won’t make a profit or a loss. This is a basic example of hedging – protecting yourself from market uncertainty.

Example of Hedging Using Options Contracts

Imagine you have invested ₹1 crore in 100 stocks of a company. You’re worried that the stock price might fall, but you don’t want to sell your shares.

  • Instead of selling, you buy a Put Option (1 Lot = 100 stocks).
  • If the stock price falls, your portfolio will show a loss, but the Put Option will generate a profit.
  • Since the price of derivatives mirrors the price of the asset, your loss in stocks is balanced by the gain in the Put Option.

Result? Your overall loss is reduced, or in some cases, you may even end up with no profit, no loss!

This is how Options help in hedging risk.

We will read about hedging as well as hedging strategies in more detail later.


Futures vs. Options – Key Differences

FeatureFuturesOptions
ObligationMust settleNo obligation
RiskHighLimited/Unlimited
Margin RequiredHighLow/High
LeverageYesYes
Best ForHedging & speculationHedging & trading flexibility

Got confused? Worry not! We will cover this in more detail in upcoming articles. So, relax!


Final Thoughts

Futures and Options are powerful tools that help traders maximize profits and minimize risks. Whether you are a trader looking to speculate or an investor looking to hedge your portfolio, F&O can help.

However, they are complex and risky, so learning and understanding them before trading is important. If used wisely, Options can protect your investments, and Futures can help you take advantage of market movements.

What is F&O in stock market?

F&O stands for Futures and Options. These are contracts that allow you to trade based on the future price of a stock or other asset instead of buying the asset directly.

What is F&O stock?

An F&O stock is a company’s stock that is approved by the stock exchange for Futures and Options trading. Not all stocks are listed in the F&O segment — only selected ones are.

What is F&O trading in share market?

F&O trading means buying and selling futures and options contracts in the share market. It is a form of derivative trading and is different from regular stock buying.

Why do traders use F&O stocks?

Traders use F&O stocks to make profits from price changes without holding the actual stock. It also allows them to hedge their risks if prices fall or rise suddenly.

Is F&O trading risky?

Yes, F&O trading can be risky, especially for beginners. That’s why it’s important to understand how Futures and Options work before you start investing in them.