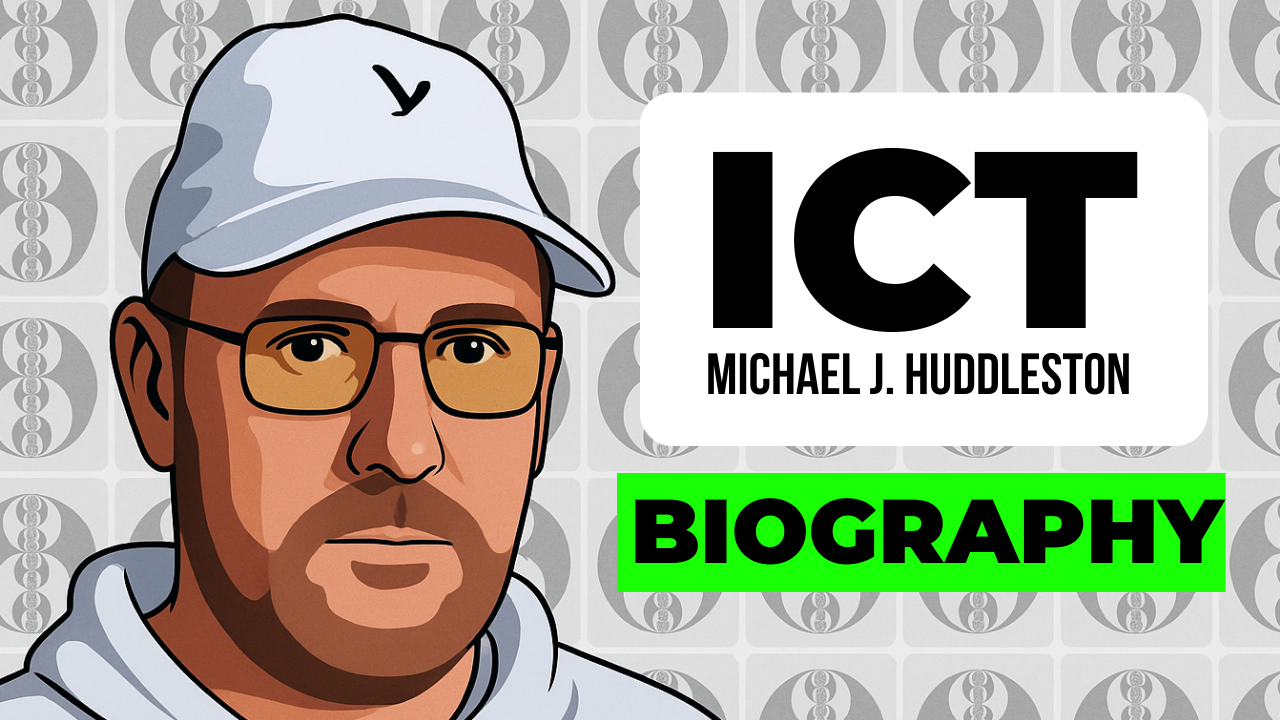
ICT (Michael J. Huddleston)-Biography, Net Worth, YouTube Channel, Family & Trading Success

ict trader biography michael j huddleston

Michael J. Huddleston is better known as The Inner Circle Trader or ICT. He calls himself mentor of mentors in forex and price action. He created the Smart Money Concepts (SMC) methods. He has over 30 years of experience. He shares free lessons on YouTube and his website. Many traders use his ideas in forex and crypto. This article covers his real name, background, SMC ideas, and how they apply to Bitcoin.

The Inner Circle Trader is a popular name in trading. His real name is Michael J. Huddleston. He teaches how to read market moves with simple rules. He calls his approach Smart Money Concepts or SMC. This helps traders see where big players act.

Also Read – What is the difference between ICT and SMC?

Who Is ICT?

Real NameMichael J. Huddleston
Age50+
Net Worthestimated to be more than 12 million
EducationCompleted high school; studied trading under Larry Williams, Richard Dennis
Early LifeGrew up in St. Joseph, Michigan
WifeNot publicly disclosed
Children1. Caleb
2. (to be updated)

Michael J. Huddleston grew up in St. Joseph, Michigan. After finishing high school, he worked various jobs, including servicing vending machines.

His uncle introduced him to futures and options trading, inspiring his first steps in finance. Intrigued by the potential to build wealth, Huddleston enrolled in trading courses taught by experts such as Larry Williams and Richard Dennis. Although he faced losses in his early trades, he persevered by studying market patterns and refining his skills.

Who invented ICT concepts?

Michael J. Huddleston developed his own unique style of reading price action. Over time, his teachings became known as ICT concepts or ICT-SMC concepts. So, without any doubt, he can be called the inventor of ICT concepts.

What is ICT’s real name?

ICT stands for Inner Circle Trader. But his real name is Michael J. Huddleston. He chose ICT as his brand name.

The Inner Circle Trader-YouTube Channel

ICT runs a free YouTube channel with over one million subscribers as of 2025. He shares videos on order blocks, fair value gaps, and market structure.

He often says, “I am the mentor of your mentor.”

The Inner Circle Trader (ICT) YouTube channel, run by Michael J. Huddleston, teaches a unique trading methodology focused on "Smart Money Concepts." It aims to help retail traders understand how institutional players manipulate and move markets.

How Much Does ICT (Michael J. Huddleston) Earn from YouTube?

There is no exact information available about the YouTube earnings of ICT (Michael J. Huddleston), but we can make a rough estimate using a tool called Social Blade. Social Blade is a free online platform that gives data about YouTube channel performance, such as total views and estimated income.

According to Social Blade, ICT’s channel gets around 3 million views every month, and his estimated monthly earnings range between $1,000 and $12,000. This range is based on general ad revenue estimates.

But we can try to guess a more accurate number. ICT’s channel is in the finance or trading category, and channels in this niche usually earn more per 1,000 views. This rate is called RPM (Revenue Per Mille), which means how much a creator earns for every 1,000 views.

In the United States, finance-related YouTube channels can earn anywhere from $5 to $25 RPM, depending on factors like where the audience is from, how they engage with the content, and what kind of ads are shown.

If we assume a conservative RPM of $5, and multiply that by 3 million views, ICT could be earning around $15,000 per month from YouTube ads alone.

So it’s fair to say that he likely earns more than $12,000 per month just from YouTube advertisements.

Smart Money Concepts (SMC)

Smart Money Concepts are a series of rules that reveal how large institutions operate in the markets. The main ideas include:

Market Structure: ICT teaches how to identify trends, consolidation, and key levels by studying swing highs and lows. Proper structure analysis helps traders align themselves with the dominant market direction.

Order Blocks: These are specific zones where banks and hedge funds place large buy or sell orders. When price returns to these zones, it often reverses or accelerates in the original direction.

Fair Value Gaps (FVGs): Also called voids, FVGs are gaps between candles on a chart. They represent areas where price moved too quickly, leaving behind unfilled orders. Traders expect price to revisit these zones before continuing.

Liquidity Pools: These are areas just above swing highs or below swing lows where many stop orders accumulate. Institutions often trigger these pools to fuel larger moves.

Does ICT-SMC Work in the Stock Market?

ICT’s core principle lies in the concept of liquidity, also known as stop-loss hunting. Whether in the US stock market (Dow Jones, S&P 500, NASDAQ), Indian markets (Bank Nifty, Nifty 50 F&O), or European markets (FTSE 100), ICT-SMC applies everywhere. One needs to practice well in live markets and develop an intuition for what each candle is telling you.

By applying these tools, traders learn to enter and exit positions with greater confidence and precision.

Does ICT SMC Apply to Bitcoin?

ICT does not trade crypto himself. He is usually negative on crypto trading. Despite that, many students use his SMC ideas on Bitcoin charts.

They track Order Blocks and liquidity. Traders say the rules still work on crypto, but some think not all rules fit the volatile crypto markets.

Also Read – I Created the Best Bitcoin Guide You’ll Ever Read

Conclusion

Michael J. Huddleston, the Inner Circle Trader, transformed how retail traders view price action by revealing the hidden moves of institutional players. His Smart Money Concepts offer a step-by-step roadmap for spotting high-probability trade setups. While no method guarantees success, countless traders credit ICT’s teachings for improving their confidence and results. Whether you trade forex, stocks, or Bitcoin, understanding SMC can be a powerful addition to your toolkit.

What is ICT?

ICT means Inner Circle Trader. It is Michael Huddleston’s brand.

Who is Michael J. Huddleston?

He is a trader and mentor from Michigan with over three decades of market experience.

Who owns the ICT strategy?

Michael J. Huddleston owns ICT and the SMC methods

This article is for informational purposes only and should not be considered financial advice. Investing in stocks, cryptocurrencies, or other assets involves risks, including the potential loss of principal. Always conduct your own research or consult a qualified financial advisor before making investment decisions. The author and publisher are not responsible for any financial losses incurred from actions based on this article. While efforts have been made to ensure accuracy, economic data and market conditions can change rapidly. The author and publisher do not guarantee the completeness or accuracy of the information and are not liable for any errors or omissions. Always verify data with primary sources before making decisions.

Skechers stock is going to be delisted from the NYSE – what you need to know

Who is buying Skechers? skechers news

Skechers U.S.A., Inc. (NYSE: SKX) has announced a landmark $9.4 billion acquisition by investment firm 3G Capital, marking its transition to a privately held company. The deal, set to reshape the footwear giant’s future, will lead to its delisting from the New York Stock Exchange. Here are five critical details shareholders and investors need to know:


1. Acquisition Triggers Delisting

3G Capital will acquire Skechers for $63.00 per share in cash, a 30% premium over its 15-day average stock price. The transaction, approved unanimously by Skechers’ board, is expected to close in Q3 2025. Post-closure, Skechers’ shares will be delisted, ending its 30-year run as a publicly traded company. The move reflects a growing trend of firms opting for private ownership to avoid public market pressures.


2. Shareholder Options: Cash or Equity in a Private Entity

Shareholders have two payment options:

  • $63.00 per share in cash (immediate liquidity).
  • $57.00 in cash + one unlisted, non-transferable equity unit in the new private parent company.

Notably, founder Robert Greenberg and family have committed to the mixed payment, signaling confidence in Skechers’ private future. However, the equity units lack liquidity, meaning shareholders cannot trade them publicly—a key consideration for investors seeking flexibility.


3. Leadership and Strategy Remain Unchanged

Skechers will continue under CEO Robert Greenberg and its current management team, with headquarters staying in Manhattan Beach, California. The company plans to maintain its focus on international expansion, direct-to-consumer growth, and innovation. Going private may allow Skechers to pursue long-term strategies without quarterly earnings scrutiny, potentially accelerating initiatives like global distribution and technology investments.


4. Strong Financials and Deal Rationale

Skechers reported record 2024 revenue of $9 billion ($640 million net earnings), underscoring its robust market position. The acquisition at a premium suggests 3G Capital sees untapped value, possibly in Skechers’ 15% revenue exposure to China and its wholesale growth potential. Delisting could provide operational flexibility amid challenges like U.S. tariffs (not addressed in the release) and shifting trade dynamics.


5. Navigating Risks as a Private Company

While privatization offers advantages, Skechers faces external headwinds:

  • Trump-era tariffs impacting shoemaking costs.
  • Dependence on China for 15% of revenue (per FactSet).

As a private entity, Skechers may mitigate these risks through strategic adjustments away from public scrutiny. However, shareholders opting for equity units must trust management’s ability to navigate these challenges without the transparency of public reporting.

Also Read – Forget Stocks – Warren Buffett’s Life-Changing Advice from the 2025 Berkshire Hathaway Investors Meeting Will Open Your Eyes


Key Takeaways

  • Skechers’ stock surged 25% pre-market to $61.78 following the announcement.
  • The deal underscores confidence in the brand’s resilience and growth prospects.
  • Shareholders must decide between immediate cash or illiquid equity by the Q3 2025 closure.

As Skechers transitions to private ownership, stakeholders should weigh liquidity needs against long-term faith in the company’s vision. For the broader market, this acquisition highlights the evolving landscape where firms increasingly seek refuge from public market volatility.

What is 3G Capital?

3G Capital is a global private investment firm known for acquiring and managing consumer-focused brands with long-term growth potential. Founded in 2004, it has built a reputation for partnerships with iconic companies, emphasizing operational efficiency, cost discipline, and strategic expansion.

Kalyani Steels Declares Dividend for FY25—Check Dividend Amount, Record Date & Payment Details

Kalyani steel dividend 2025 record date

The Board of Directors of Kalyani Steels met on 5 May 2025 and recommended a final dividend of ₹ 10.00 per equity share (face value ₹ 5), or 200% of face value, for the financial year 2024-25. Below are all the key details you need to know.


Company Overview

FieldDetails
Company NameKalyani Steels Limited
Stock SymbolBSE: 542976 · NSE: KSTEEL
IPO Year2003
Stock ExchangeBSE, NSE
Market Cap₹ 6,500 crore (approx. May 2025)
FounderBharat Forge Group
Incorporation2003
HeadquartersPune, Maharashtra, India
SectorMetals & Mining
IndustrySteel Manufacturing
SpecializationAlloy Steels, Stainless Steels

Kalyani Steels is part of the Bharat Forge Group. It produces high-strength alloy and stainless steel. The company serves automotive, oil, gas and engineering sectors globally.


Kalyani Steels Dividend 2025 – Important Dates

Kalyani Steels Dividend 2025 Announcement Date5 May 2025
Kalyani Steels Dividend TypeFinal Dividend
Kalyani Steels Dividend Amount₹ 10.00 per equity share
Kalyani Steels Ex-Dividend Dateto be updated
Kalyani Steels Record Dateto be updated
Kalyani Steels Payment Dateto be updated

Record Date: The cut-off date set by the company to determine which shareholders are eligible to receive the dividend. Only those who own shares on this date get the dividend.

Ex-Dividend Date: Usually one business day before the Record Date. If you buy shares on or after the Ex-Dividend Date, you will not be eligible for the dividend.

Note: Shareholders on record by the Record Date are eligible for the dividend.

Also Read – Tata Motors Dividend 2025 Announced? – Record Date, Ex-Dividend Date & More


Kalyani Steels – Dividend History

DateDividend (₹ per share)
14-Aug-2024₹ 10.00
11-Aug-2023₹ 10.00
22-Jul-2022₹ 10.00
26-Aug-2021₹ 7.50
12-Mar-2020₹ 5.00

Kalyani Steels has maintained regular dividends, reflecting steady profitability.


How to Receive Your Dividend?

You do not need to apply separately. Depositories and the company will handle it.

  1. Beneficial Owners: Names on NSDL/CDSL list as of 4 July 2025.
  2. Registered Members: Names in Register of Members after transfer processing by 4 July 2025.

After 31 July 2025, Kalyani Steels will credit the dividend to your bank account or dispatch a cheque.


Kalyani Steels Dividend 2025 – Tax Rules Explained

Since April 2020, dividends are taxable in the hands of shareholders. If your total dividend income exceeds ₹ 5,000 in a year, Kalyani Steels will deduct 10% TDS at source. You can submit a lower‑tax deduction certificate if eligible. Make sure to include all your dividend income when filing your annual tax return.


Q4 FY25 Results – Highlights

ParticularsQ4 FY25Q4 FY24
Profit After Tax₹ 79.28 crore₹ 62.53 crore
Profit Before Tax (PBT)₹ 107.14 crore₹ 84.39 crore
Revenue from Operations₹ 544.33 crore₹ 503.15 crore
Total Expenses₹ 449.94 crore₹ 431.40 crore
Other Expenses₹ 278.76 crore₹ 209.43 crore
Raw Material Costs₹ 112.30 crore₹ 103.58 crore
Employee Benefit Expenses₹ 58.88 crore₹ 52.79 crore

Kalyani Steels reported a 26.75% rise in net profit. Revenue grew by 8.25%, while expenses increased 4.28%. Other costs jumped sharply by 33.10%.


Key Financial Metrics

MetricValue
Market Capitalisation₹ 6,500 crore
Return on Equity (ROE)15.10%
Price-to-Earnings (P/E) Ratio12.00
Price-to-Book (P/B) Ratio1.80
Industry P/E Ratio14.50
Industry P/B Ratio2.10
EPS (TTM)₹ 48.50

Kalyani Steels delivered strong margins and improved profitability in Q4 FY25. Its valuation ratios remain attractive compared to industry peers.

ALSO READ – What is a Dividend? – A Complete Guide in Simple Words

Mahindra & Mahindra Declares Dividend for FY25—Check Dividend Amount, Record Date & Payment Details

Mahindra dividend 2025 date

Along with its audited financial results for the fourth quarter (Q4 FY25) and the year ended 31 March 2025, Mahindra & Mahindra Ltd. has approved a final dividend of ₹ 25.30 per equity share (face value ₹ 5), or 506% of face value. Below are all the key details you need to know.


Company Overview

Company NameMahindra & Mahindra Ltd.
Stock SymbolBSE: 500520 · NSE: M&M
IPO Year1945 (as a tractor manufacturer)
Stock ExchangeBSE, NSE
Market Cap₹ 1.85 lakh crore (approx. May 2025)
FounderJ.C. Mahindra & K.C. Mahindra
Incorporation1945
HeadquartersMumbai, Maharashtra, India
SectorAutomobiles & Farm Equipment
IndustryAutomotive & Agricultural Machinery
Key Products & ServicesSUVs, Tractors, Commercial Vehicles, Electric Vehicles

Mahindra & Mahindra is a leading Indian automaker and farm-equipment maker. It has a global presence in over 100 countries. It makes SUVs, tractors, and electric vehicles. The company is known for innovation and a strong market share.


Mahindra Dividend 2025 – Important Dates

Mahindra & Mahindra Dividend 2025 Announcement Date5 May 2025
Mahindra & Mahindra Dividend TypeFinal Dividend
Mahindra & Mahindra Dividend Amount₹ 25.30 per equity share
Mahindra Dividend 2025 Ex-Dividend Date3 July 2025
Mahindra Dividend 2025 Record Date4 July 2025
Mahindra Dividend 2025 Payment DateAfter 31 July 2025

Note: Shareholders recorded in the books by the Record Date are eligible to receive the dividend.

Also Read – Tata Motors Dividend 2025 Announced? – Record Date, Ex-Dividend Date & More


Mahindra & Mahindra – Dividend History

DateDividend (₹ per share)
05-Jul-2024₹ 21.10
14-Jul-2023₹ 16.25
14-Jul-2022₹ 11.55
15-Jul-2021₹ 8.75
16-Jul-2020₹ 2.35

Mahindra & Mahindra has steadily increased dividends over recent years. It shows the company shares profits with its investors.


How to Receive Your Dividend

You do not need to apply separately. Your depository and the company will handle it automatically.

  1. Beneficial Owners: Names on the NSDL/CDSL list as of 4 July 2025.
  2. Registered Members: If your shares are held in physical form, then your name must be in the company’s official Register of Members by 4 July 2025. This requires that any transfer requests were fully processed by that date.

After 31 July 2025, Mahindra & Mahindra will credit the dividend to your bank account or dispatch a cheque.


Book Closure Period

The Register of Members and Share Transfer Books will remain closed from 5 July 2025 to 31 July 2025 (both days inclusive).

Any valid transfer requests must reach the Registrar by 4 July 2025 to be processed before book closure.

ALSO READ – What is a Dividend? – A Complete Guide in Simple Words


Q4 FY25 Results – Highlights

ParticularsQ4 FY25Q4 FY24
Profit After Tax₹ 3,541.85 crore₹ 3,124.94 crore
Revenue from Operations₹ 42,585.67 crore₹ 35,373.34 crore
Total Expenses₹ 39,113.61 crore₹ 32,172.17 crore
Vehicle Sales (Units)2,53,0282,15,280
Tractor Sales (Units)87,13871,039

Mahindra & Mahindra reported a 13.34% rise in profit after tax. Revenue grew by 20.5%. Expenses also increased. Vehicle sales rose 18% and tractor sales increased 23% compared to Q4 FY24.


Key Financial Metrics

MetricValue
Market Capitalisation₹ 1,85,000 crore
Return on Equity (ROE)12.50%
Price-to-Earnings (P/E) Ratio18.00
Price-to-Book (P/B) Ratio3.20
Industry P/E Ratio26.10
Industry P/B Ratio3.75
5-Year Stock Return210.00%
EPS (TTM)₹ 140.50

Mahindra & Mahindra has shown consistent growth and strong returns in recent years. When compared to the industry averages, its P/E ratio is lower, which could mean the stock is relatively undervalued. Similarly, its P/B ratio is also below the industry average, indicating potentially better value for long-term investors.

ALSO READ – SBI Declares Dividend for 2025—Check SBI Dividend 2025-Record Date & Payment Details


Why This Matters
A high dividend reflects strong profits and rewards investors. It can also attract new buyers to the stock.


Forget Stocks – Warren Buffett’s Life-Changing Advice from the 2025 Berkshire Hathaway Investors Meeting Will Open Your Eyes

berkshire hathaway 2025 investor meet Warren Buffett

Warren Buffett, who is now 94 years old, shared both investing insights and personal advice at the 2025 Berkshire Hathaway annual meeting. While his investment lessons remind us to stay patient and focused on value, his life lessons push us to prioritize happiness, pursue work we love, and surround ourselves with the right people. These tips can transform how we think about our careers and personal well-being.

Event Highlights

The 2025 Berkshire Hathaway annual meeting took place on May 3, 2025, in Omaha, Nebraska. Known as the “Woodstock for Capitalists,” the event featured four and a half hours of Q&A with Buffett and his executives. Attendees and viewers around the world tuned in to hear his views on markets, the economy, and life.

Greg Abel – To Be the Next CEO of Berkshire Hathaway

Who is Greg Abel?

At the 2025 meeting, Warren Buffett made a big announcement. He said that Greg Abel will become the new CEO of Berkshire Hathaway by the end of 2025.

The transition is expected to be completed by early 2026. Buffett, who is now 94 years old, shared that he had first discussed this with only two board members.

During the meeting, he said, “The time has arrived where Greg should become the chief executive officer of the company at year-end.” Buffett also mentioned that while he will still be involved, Greg Abel will be in charge of running the company and making important financial decisions.

4 Important Life Lessons by Warren Buffett from 2025

berkshire hathaway 2025 investor meet Warren Buffett life lessons

While Buffett’s investing wisdom guides how we grow wealth, his personal advice offers a roadmap for a fulfilling life.

1. Happiness Means Longevity

“A happy person lives longer than someone doing things they don’t admire much,” Buffett said, highlighting that joy in life boosts well-being and may even extend lifespan.

2. Choose Work You Love

Buffett advised young people to find work they’d do even without pay. He explained that loving your work makes every day rewarding and reduces stress over money.

3. Surround Yourself with the Right People

“Who you associate with is enormously important. You will move in the direction of those you admire and call friends,” Buffett said. Good company not only aids career success but shapes who you become.

4. Stay Optimistic and Resilient

Despite global challenges and political risks, Buffett remains bullish on America’s future. He described being born in the U.S. as his greatest luck and urged confidence in the country’s ability to overcome crises.

A Glimpse of Investment Lessons by Warren Buffett (Brief Overview)

  • Market Volatility: Buffett reminded investors that recent swings are normal. He noted that Berkshire’s stock was halved three times in sixty years, yet the company thrived through each cycle.
  • Cash and Opportunities: With a record cash hoard of $347 billion, Berkshire is ready to act when good deals arise. Buffett said he’d deploy up to $100 billion for the right opportunity in the next five years.
  • Long-Term Holdings: He committed to holding Japanese stocks for at least fifty more years, emphasizing the value of patient investing.

Also Read – Declining NPAs Are Good but Rising Provisions Are Bad—How?

Conclusion

Warren Buffett’s 2025 meeting gave us more than tips on when to buy or sell stocks. His life-changing advice reminds us to seek happiness, passion, and the right circle of influence. These lessons can open our eyes to what truly matters beyond the numbers on a screen.

Who is Greg Abel?

Greg Abel is a Canadian businessman born on June 1, 1962, in Edmonton, Alberta. His full name is Gregory Edward Abel. He currently serves as the chairman and CEO of Berkshire Hathaway Energy and the vice-chairman of non-insurance operations at Berkshire Hathaway, a role he has held since 2018.

What is the net worth of Greg Abel?

Gregory Abel’s estimated net worth is approximately $484 million.

What is the age of Warren Buffett?

Warren Buffett is now 94 years old.

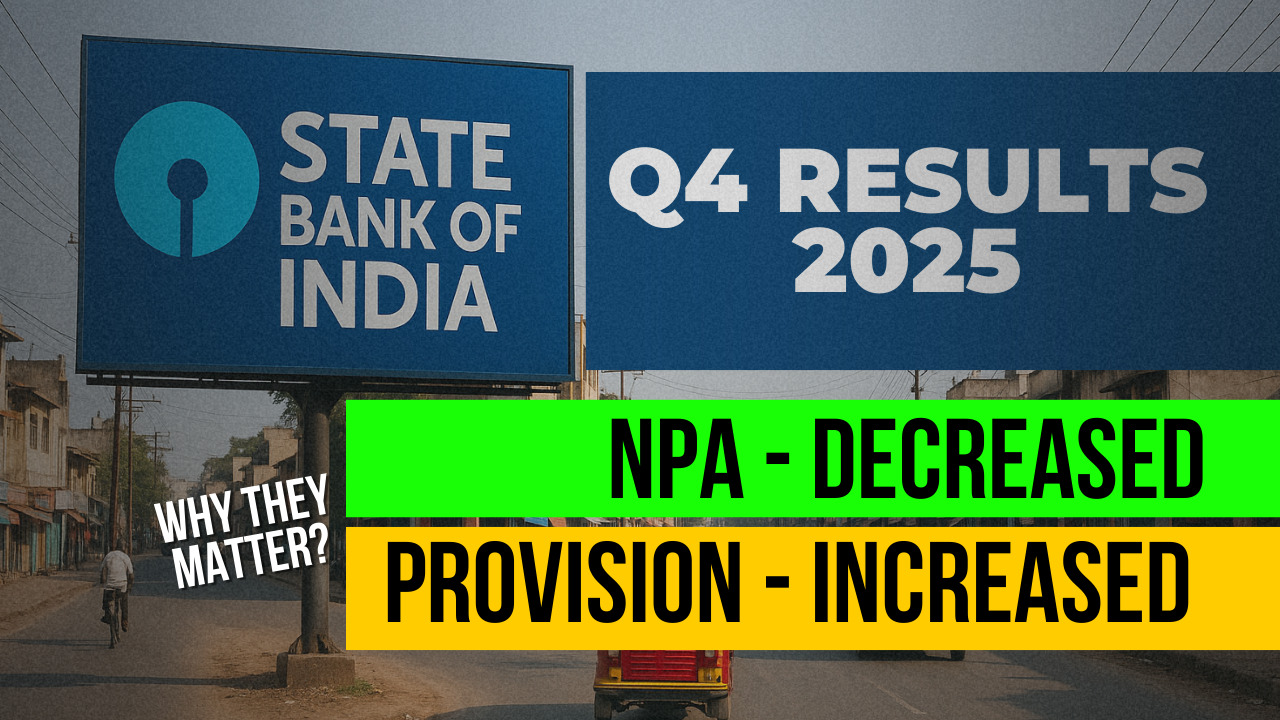
Declining NPAs Are Good but Rising Provisions Are Bad—How?

Why NPAs & Provisions Matter in Banking Stocks?

This article is written in the context of State Bank of India’s Q4 results for FY25, where the bank’s gross non-performing assets (NPAs) fell to 1.82% of total advances, indicating that fewer loans are going unpaid. At the same time, SBI’s provisions for bad loans rose by nearly 300% to ₹6,442 crore.

Revenue₹42,775 crore₹41,655 crore
Operating Profit₹31,286 crore₹28,748 crore
Net Profit₹18,643 crore₹20,698 crore
Provisions₹6,442 crore₹1,608 crore
Provisions (QoQ)₹6,442 crore₹911 crore
Gross NPA (%)1.82%2.07% (Q3 FY25)

State Bank of India, the country’s largest bank in terms of assets and deposits, currently holds a market valuation of approximately ₹7,14,014.23 crore. The bank’s shares are trading at a price-to-earnings (P/E) ratio of 9.00, reflecting the multiple investors are willing to pay for its earnings. Over the past five years, SBI’s stock has appreciated by 319.95%, supported by strong financial performance. The earnings per share (EPS) for the trailing twelve months stand at ₹81.75, with a consistent growth rate of 20.56% recorded during the same period.

Below, we explain NPAs and provisions in simple terms and use an example of a small bank to make it clear.

What Are NPAs?

Simple Definition

See, money is also an asset as it provides economic benefit to the bank in the future. So, non-performing assets or simply called NPA is that money that becomes unable to bring interest to the bank.

  • Non-Performing Assets (NPAs) are loans where the borrower has stopped paying interest or principal for 90 days or more, or the bank thinks they won’t be repaid in full.

Sometimes NPAs are also called bad loans since they stop generating income for the bank and need special handling.

Why Declining NPAs Matter

Declining NPA simply means the bank is getting interest on the money it has given as a loan, which can lead to banks making more profits.

In technical terms:

When NPAs fall, it means:

  • Fewer troubled loans: The bank has made better quality loans that customers are repaying on time.

What Are Provisions?

If a bank has a doubt or is almost sure that some part of the total loan it has given to borrowers is not going to come back to the bank (let alone interest), it sets aside some security amount out of its past profit just to offset those bad loans. Those are called provisions.

Provisions lead to reductions in a bank’s retained profits.

Simple Definition in Technical Terms

  • Provisions for bad loans are money the bank sets aside from its profits to cover loans that might go bad in the future.
  • In accounting, provisions show up as an expense, reducing the bank’s reported profit because these funds are reserved rather than kept as earnings.

Why Rising Provisions Can Hurt

When a bank increases its provisions:

  • Lower reported profits: More money is parked in a reserve account, so there’s less profit left to distribute or reinvest.
  • Signal of caution: It may imply the bank expects more loans to turn bad soon, which can worry investors even if current NPAs are low.

However, provisions are also a sign of responsible and cautious banking. If a bank doesn’t make enough provisions and loans turn bad later, it could hurt the bank’s stability. So, provisions are not always bad—they show the bank is preparing for possible risks.

Also Read –SBI Declares Dividend for 2025—Check SBI Dividend 2025-Record Date & Payment Details

Putting It All Together with a Simple Bank Example

Imagine a small bank, EasyBank, with:

  • Total loans of ₹100 crore
  • Initially, ₹3 crore in NPAs (3% of loans)
  • It sets aside ₹1 crore as provisions.

Scenario A: NPAs fall

  • NPAs drop from ₹3 crore to ₹1.82 crore (1.82% of ₹100 crore).
  • This is great: fewer bad loans, more money coming in from interest.

Scenario B: Provisions rise

  • EasyBank sees early signs that some newer loans might go bad, so it raises provisions from ₹1 crore to ₹4 crore.
  • Even though NPAs are low, ₹3 crore extra is taken out of profit and held in reserve.
  • Result: reportable profit falls since ₹4 crore is an expense, not earnings.

Why SBI’s Q4 FY25 Looks This Way

  • Gross NPAs at SBI fell to 1.82% of advances (loans), marking healthier loan quality.
  • But SBI boosted its bad-loan provisions to ₹6,442 crore, reducing net profit for the quarter.

In simple terms: Lower NPAs mean the bank’s loan book is cleaner, while higher provisions mean the bank is being extra cautious and setting aside more money—good for safety but not for short-term profits.

Conclusion

The more NPA drops, the better it is for a bank.

But higher provisions are not always bad. They reduce short-term profit but also show that the bank is being careful and preparing for possible future risks. So, the best situation is when NPAs are low and provisions are made wisely based on risk.

Also Read – Understanding the CASA Ratio: Important Points to Know

What do you mean by “advances”?

In banking, “advances” refers to the total amount of money that a bank has lent to its customers. Whenever we talk about NPAs as a percentage of advances, we are comparing bad loans to the bank’s entire loan book, that is, all the loans the bank has given out.

SBI Declares Dividend for 2025—Check SBI Dividend 2025-Record Date & Payment Details

sbi dividend 2025

Along with its audited financial results for the fourth quarter (Q4 FY25) and the financial year ended 31 March 2025, the State Bank of India (SBI) has officially announced the SBI Dividend 2025. Despite a decline in profits, the bank has declared an impressive final dividend of ₹15.90 per equity share for its shareholders. The announcement also includes key details such as the SBI Dividend 2025 record date, and the dividend payment date.

state bank of india dividend 2025 record date

About SBI (Company Overview)

Company NameState Bank of India
Stock SymbolBSE: 500112 NSE: SBIN
IPO Year1997 (Listed as a public sector bank)
Stock ExchangeBSE, NSE
Market Cap₹ 7.75 lakh crore (approximate as of May 2025)
FounderGovernment of India (as Imperial Bank in 1921, renamed SBI in 1955)
Incorporation1955
HeadquarterMumbai, Maharashtra, India
SectorFinancial Services
IndustryBanking
SpecializationRetail banking, Corporate banking, Insurance, Asset management, Loans, Digital banking

State Bank of India(SBI) is the largest public sector bank in India. It began in 1806 as the Bank of Calcutta. In 1955 the government took charge and renamed it State Bank of India. Its head office is in Mumbai. SBI has over 22 000 branches and 63 000 ATMs across India. It serves more than 500 million customers. SBI also works in 36 countries. It offers savings and current accounts, loans, credit cards, insurance and investment services. It has many units like SBI Life, SBI Mutual Fund and SBI Cards. The Reserve Bank of India calls SBI a systemically important bank. It plays a key role in the Indian economy and leads in digital banking services.

State Bank of India dividend 2025 – Important Dates

State Bank of India Dividend 2025 Announcement Date3 May 2025
Type of DividendFinal Dividend
Dividend Amount₹15.90 per equity share
SBI ex-dividend date 202515 May 2025
SBI dividend record date 202516 May 2025
SBI dividend payment date 202530 May 2025
  • The record date for SBI’s 2025 dividend is set at 16 May 2025.
  • The ex-dividend date for SBI’s 2025 dividend is likely 15 May 2025.
  • The dividend payment date for SBI’s 2025 dividend is scheduled for 30 May 2025.

Record Date: The cut-off date set by the company to determine which shareholders are eligible to receive the dividend. Only those who own shares on this date get the dividend.

Ex-Dividend Date: Usually one business day before the Record Date. If you buy shares on or after the Ex-Dividend Date, you will not be eligible for the dividend.

Also Read – Tata Motors Dividend 2025 Announced? – Record Date, Ex-Dividend Date & More

State Bank of India – Dividend History

DateTypeDividend (₹ per share)
22-May-2024Final Dividend₹13.70
31-May-2023Dividend₹11.30
25-May-2022Dividend₹7.10
03-Jun-2021Dividend₹4.00
26-May-2017Dividend₹2.60

Before the SBI dividend 2025 announcement, SBI’s dividend history shows steady growth over the years. This means SBI regularly shares profits with its shareholders. The dividend payout has increased almost every year. That shows SBI cares about giving good returns to its investors.

ALSO READ – What is a Dividend? – A Complete Guide in Simple Words

How to Apply for State Bank of India Dividend 2025?

You do not need to apply yourself. Your broker and the company take care of everything. Just make sure your shareholding details and bank information are up to date. Then, on or after 30 May 2025, SBI will credit the dividend directly to your bank account.

SBI Dividend 2025 – Tax Rules Explained

Since April 2020 dividends are taxable in the hands of shareholders. If your total dividend income exceeds ₹5,000 in a year the company will deduct 10 percent TDS unless you submit a lower-tax certificate. You must include all your dividend income when you file your tax return.

SBI Q4 FY25 Results – Highlights

ParticularsQ4 FY25Q4 FY24
Revenue₹42,775 crore₹41,655 crore
Operating Profit₹31,286 crore₹28,748 crore
Net Profit₹18,643 crore₹20,698 crore
Provisions₹6,442 crore₹1,608 crore
Provisions (QoQ)₹6,442 crore₹911 crore
Gross NPA (%)1.82%2.07% (Q3 FY25)
Net NPA (%)0.47%0.53% (Q3 FY25)

State Bank of India saw revenue rise 2.7% to ₹42,775 crore in Q4 FY25. Operating profit grew 8.8% to ₹31,286 crore. However net profit fell 10% to ₹18,643 crore. Provisions jumped to ₹6,442 crore year on year and also rose sharply quarter on quarter. Asset quality improved as gross NPA fell to 1.82 percent and net NPA to 0.47 percent.

Key Financial Metrics of State Bank of India (SBI)

sbi 2025 dividend record date ex dividend
MetricValue
Market Capitalisation₹7,14,014.23
Return on Equity (ROE)17.26 %
Price-to-Earnings (P/E) Ratio9.00
Price-to-Book (P/B) Ratio1.63
5-Year Stock Return319.95 %
EPS (TTM)₹81.75
EPS Growth (TTM)20.56 %

State Bank of India is India’s largest bank by assets and deposits. Its market value is about ₹7,14,014.23 Crore. Investors pay 9.00 times the earnings for its shares. Over the last five years the stock has risen by 319.95%. Its earnings per share over the trailing year are ₹81.75. Those earnings have grown 20.56% in the same period.

Also Read – Declining NPAs Are Good but Rising Provisions Are Bad—How?

Why is Olymp Trade banned in India?

is olymp trade legal in india 2025?

OlympTrade is an online trading platform that allows users to trade in different financial instruments like currencies, stocks and commodities. It became popular because of its easy-to-use app and simple interface.

But many people in India ask one common question – “Why is OlympTrade banned in India?”

This article explains what OlympTrade offers, whether it is legal in India, why it is banned and if it may become legal in the future.


What Type of Trading Does OlympTrade Allow?

OlympTrade gives users different trading options. Here’s what it offers:

  • Fixed Time Trading (FTT): You predict whether the price of an asset like gold or a currency will go up or down within a fixed time. If your prediction is correct, you earn a profit. If it is wrong, you lose your money.
  • Forex Trading: This involves trading currency pairs like USD/INR or EUR/USD. You buy one currency and sell another to earn profit.
  • Digital Options: This is similar to FTT but usually comes with higher risk and fixed returns. It is more like placing a bet on price movement.

Important Point:

  • Among all these, forex trading is the main reason why OlympTrade is banned in India.

Let us look at the rules in India:

  • Forex trading is controlled by the Reserve Bank of India (RBI) under the Foreign Exchange Management Act (FEMA).
  • Only RBI-authorized brokers can legally offer forex trading.
  • OlympTrade is not approved by the RBI.

So right now, OlympTrade is not legal in India in 2025, especially for forex trading.


Why Is OlympTrade Banned in India?

Here are the main reasons:

  • No RBI Approval: On October 22, 2024, the RBI published an alert list. OlympTrade is listed as an unauthorized platform.
  • User Safety Risks: Unapproved platforms may not have proper safety features. This can lead to fraud or users facing problems while withdrawing money.
  • Legal Trouble: Trading on unauthorized platforms can lead to legal penalties. FEMA allows Indian residents to trade only through authorized dealers.

RBI’s Official Alert List Mention

OlympTrade is listed in the RBI Alert List.

This confirms that OlympTrade is not allowed to operate forex trading in India.


Countries Where Olymp Trade Is Banned

Olymp Trade is not available in over 50 countries. It is banned in all European Union members such as France, Germany, Italy, and Spain.

It is also banned in North America and Oceania, including the United States, Canada, and New Zealand.

In Asia and the Middle East it is banned in Iran, North Korea, Iraq, Syria, Myanmar, Lebanon, Libya, and Yemen.

In Africa it is banned in Somalia, Sudan, Zimbabwe, Ethiopia, Mali, Liberia, Mauritius, Congo, Central African Republic, and Eritrea. Residents of these countries cannot open a new account or make trades on the platform.


Will OlympTrade Be Allowed in India in the Future?

As of now, there is no sign that the ban will be lifted.

  • OlympTrade must get approval from the RBI under FEMA.
  • Until that happens, using OlympTrade for forex trading is considered illegal.

Also Read – Understanding the Basics of Buying, Selling, and Stop Hunting in Financial Markets


Conclusion

Let us summarize the key points:

  • OlympTrade is an international trading platform that offers FTT, forex and digital options.
  • It is banned in India mainly because of unauthorized forex trading.
  • The RBI has listed OlympTrade in its alert list, which means Indian users cannot legally use it for forex trading.
  • Some types of trading like FTT are debated, but using the platform is still risky and not clearly legal.
  • To protect your money and avoid legal problems, use RBI-approved brokers only.

Is Olymp Trade a SEBI registered company?

No, Olymp Trade is not a SEBI Registered Company.

Is binary trading legal in India?

No, binary trading is completely illegal in India.

5 Simple Steps to Convert TradingView Indicators to Strategies

convert TradingView indicators to strategies

Many traders start with indicators. They show where price moves and where trends may form. But signals alone do not place trades for you. A strategy can run your rules automatically and show if your plan works over time. Converting an indicator to a strategy gives you real feedback on performance. You learn what works and what fails. This guide walks you through each step in plain language so you can build your first Pine Script strategy today.


What Are Indicators and Strategies?

  • Indicator
    • Shows how price behaves
    • Uses functions like plot() and plotshape()
    • Answers “What is happening?”
  • Strategy
    • Places hypothetical trades based on rules
    • Uses functions like strategy.entry() and strategy.exit()
    • Answers “What should I do?”

Example
An RSI indicator plots a line that shows overbought or oversold levels.

A strategy can place a buy order when RSI falls below 30 and place a sell order when it rises above 70. This way you can test how many times this plan makes money before trading live.


5 Steps and Best Practices for Converting Indicator Code to Strategy Code

Follow these five steps and keep best practices in mind to avoid common pitfalls.

1. Identify Clear Entry and Exit Rules

  • Turn vague signals into precise actions
  • Bad: “RSI crosses above 30”
  • Good: “BUY when RSI crosses above 30”
  • Limit rules to one or two at first
  • Write each rule on its own line

Why this matters
Clear rules help your script trigger trades reliably. Fewer rules make testing faster and outcomes easier to understand.


2. Switch from indicator() to strategy()

  • At the top replace: //@version=5 indicator("My Indicator", overlay=true) with //@version=5 strategy("My Strategy", overlay=true)
  • Remove all plot() calls used only for signals
  • Use strategy.entry() for buys and sells

Key Fix
Always start with strategy() not indicator(). This lets TradingView know you want backtests.


3. Replace plotshape() with Order Functions

  • Remove: plotshape(rsi < 30, style=shape.circle)
  • Add entry: if ta.crossover(rsi, 30) strategy.entry("Buy", strategy.long)
  • Add exit: if ta.crossunder(rsi, 70) strategy.exit("Sell", from_entry="Buy")

Best Practice
Group your entry and exit logic near each other. This makes code easier to read and debug.


4. Add Backtesting Settings

  • Use realistic capital and fees
  • Example: strategy( initial_capital=10000, commission_type=strategy.commission.cash_per_order, commission_value=5 )
  • initial_capital sets test funds
  • commission_value charges a fee per order

Why This Matters
Fees can turn a profitable idea into a losing one. Always include realistic costs.


5. Include Stop Loss and Take Profit

  • Prevent big losses and secure gains
  • Add to your strategy: strategy.exit( "Exit", from_entry="Buy", loss=50, profit=100 )
  • loss stops trades down $50
  • profit takes gains at $100

Tip
Test multiple values to see which gives the best balance of win rate and drawdown.


6. Test, Tweak, Repeat

  • Open the Strategy Tester tab
  • Look at net profit, win rate, and drawdown
  • Common errors:
    • No data means rules never trigger
    • Repainting means your script uses future data
  • Fix:
    • Check conditions can happen in your time frame
    • Use high and low instead of close for entries

Best Practice
Keep a change log. Note each tweak and its impact on results. This helps you learn what matters most.

Also Read – 5 Best AI Tools for Pine Script to Supercharge Your TradingView Strategies (2025)


Real Example: Moving Average Crossover

Below is a full before and after so you can see every change.

Before (Indicator Only)

//@version=5
indicator("MA Crossover", overlay=true)
maFast = ta.sma(close, 9)
maSlow = ta.sma(close, 21)
plot(maFast, color=color.green)
plot(maSlow, color=color.red)

This script only draws two lines. No trades.


After (Full Strategy)

//@version=5
strategy("MA Crossover Strategy", overlay=true,
  initial_capital=10000,
  commission_type=strategy.commission.cash_per_order,
  commission_value=5
)

maFast = ta.sma(close, 9)
maSlow = ta.sma(close, 21)

// Entry rule
if ta.crossover(maFast, maSlow)
    strategy.entry("Buy", strategy.long)

// Exit rule
if ta.crossunder(maFast, maSlow)
    strategy.exit("Sell", from_entry="Buy")

// Risk management
strategy.exit(
  "RiskExit",
  from_entry="Buy",
  loss=50,
  profit=100
)

This script will run backtests with $10 000 capital and $5 fees per trade. It buys on a fast MA crossover and closes on crossunder or when profit or loss limits hit.


3 Mistakes That Wreck Your Strategy

  1. No Volume Check
    • Low trading volume can give fake signals.
    • Fix by adding and volume > 100000 to entry.
  2. Ignoring Fees
    • A fee free backtest looks better than reality.
    • Always include commission settings.
  3. Overfitting
    • Too many rules fit past patterns but fail in live markets.
    • Keep your code simple and test on different symbols.

FAQs

Can TradingView automate live trades?
No. TradingView backtests only. Use alerts to link with brokers for real orders.

Why is my strategy not placing trades?
Check your entry logic. Make sure conditions can occur. Confirm your capital settings are not zero.

How do I avoid repainting?
Never use close on the same bar. Use high or low or reference previous bars.


Conclusion

Converting a TradingView indicator to a strategy takes five clear steps. You define rules. You switch to strategy() functions. You set backtest and risk settings. Then you test and learn. Keep code simple. Track each change. Over time you will build a robust plan that works for you. Start today by picking your favorite indicator and following these steps. Happy coding and profitable trading!

Also Read – How to Convert Any TradingView Indicator into a Strategy Using Grok 3?

Indian Oil Corporation Dividend 2025 Update

Indian Oil Corporation Dividend 2025 Update

Indian Oil Corporation (IOC) has made a fresh announcement regarding its dividend for the financial year 2024-25.

Interim Dividend Declared

On January 30, 2025, IOC declared an interim dividend of ₹5 per equity share for the financial year 2024-25.

  • Face Value of Share: ₹10
  • Interim Dividend Amount: ₹5 per share
  • Record Date: February 8, 2025
  • Ex-Dividend Date: February 7, 2025

This means if you hold IOC shares before or on February 7, 2025, you will be eligible to receive the ₹5 dividend per share.

When Will You Get the Money?

According to IOC’s official statement, the dividend will be paid to all eligible shareholders on or before February 29, 2025.

What Is an Interim Dividend?

An interim dividend is paid by a company before the final yearly results are announced. It is usually given when the company is confident about its financial performance.

Summary Table

DetailInfo
Dividend TypeInterim
Dividend Amount₹5 per share
Face Value of Share₹10
Ex-Dividend DateFebruary 7, 2025
Record DateFebruary 8, 2025
Payout Date (on or before)February 29, 2025

IOC’s Consistent Performance

IOC has been consistent in rewarding shareholders through regular dividends. This interim dividend is another positive signal from the company showing healthy profits and strong cash reserves.