With over 3 years of experience in financial markets, we focus on simplifying global and Indian markets through clear, practical insights. Our expertise also extends to the evolving landscape of digital finance, including blockchain, stablecoins, and decentralized finance (DeFi).
Circle Internet Group Inc. (NYSE: CRCL) surged over 14% in early trading on Thursday, rising $28.33 to hit $226.95. This sharp rebound comes after the stock closed at $198.62 the previous day – marking a three-day plunge totaling 33.78% from Monday’s peak of $298.99. Today’s price action has pushed Circle’s market cap back up to approximately $49.03 billion, compared to Tuesday’s low of $43.8 billion.
The rally appears to be a technical pullback, following a steep sell-off that wiped out nearly $24 billion in market capitalization within 72 hours. While traders and investors are watching closely, many are wondering: Is this the bottom – or just a pause before more downside?
A Closer Look: Is CRCL Stock Out of Danger?
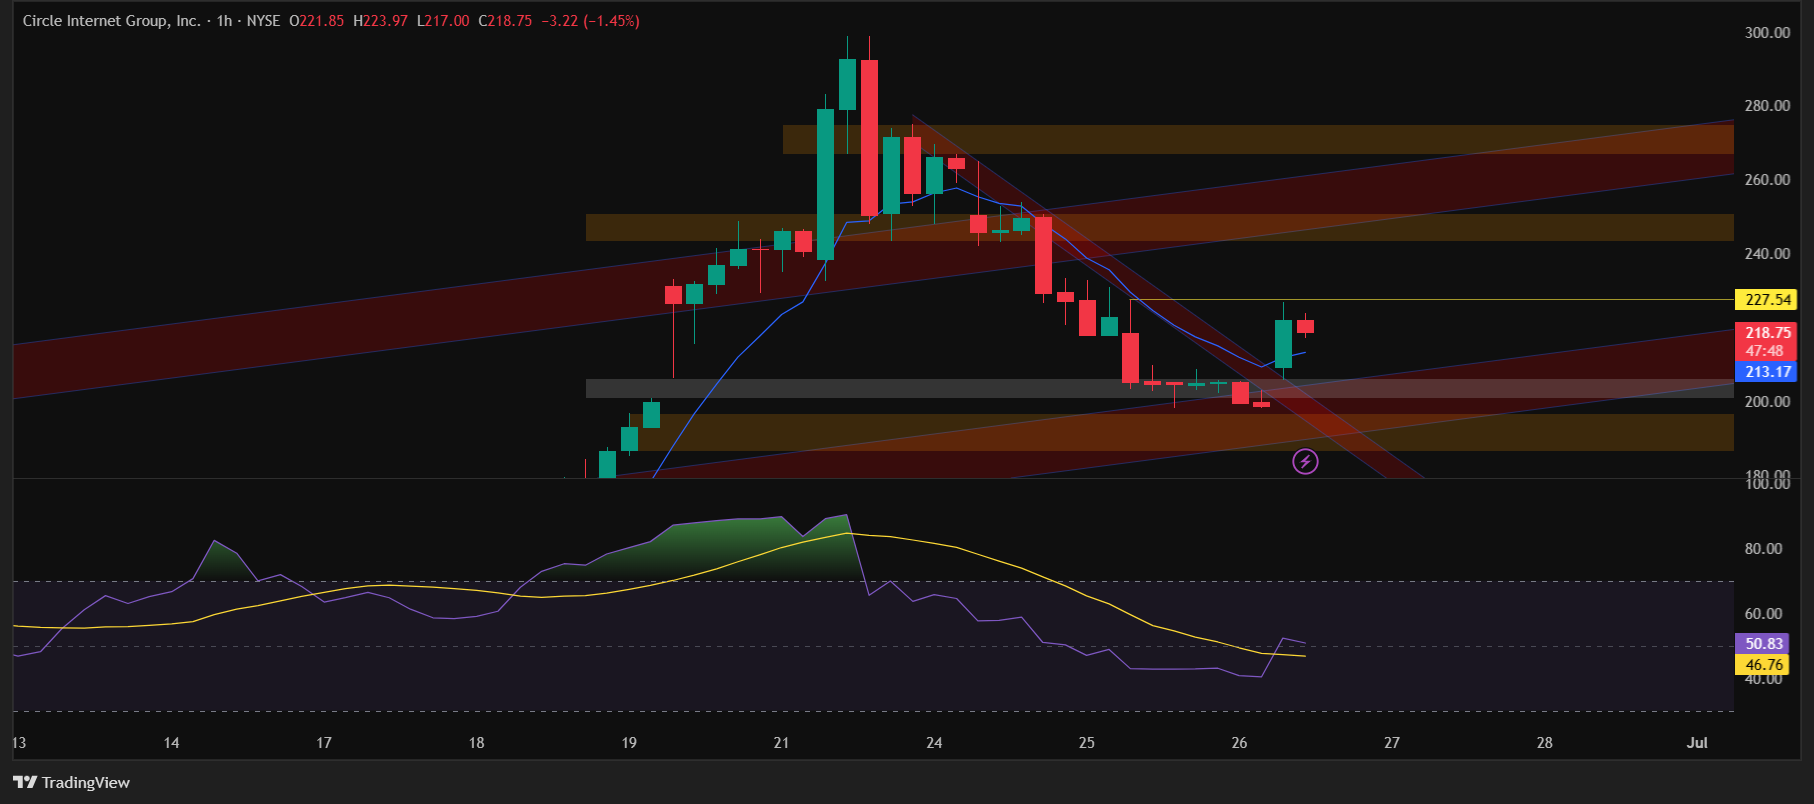
For investors hopeful that Circle’s worst days are over, the answer isn’t so simple. According to recent candlestick chart patterns, CRCL is not in confirmed bullish territory yet. Technically, the stock is still in correction mode and is only rebounding from a critical support zone between $198–$206.
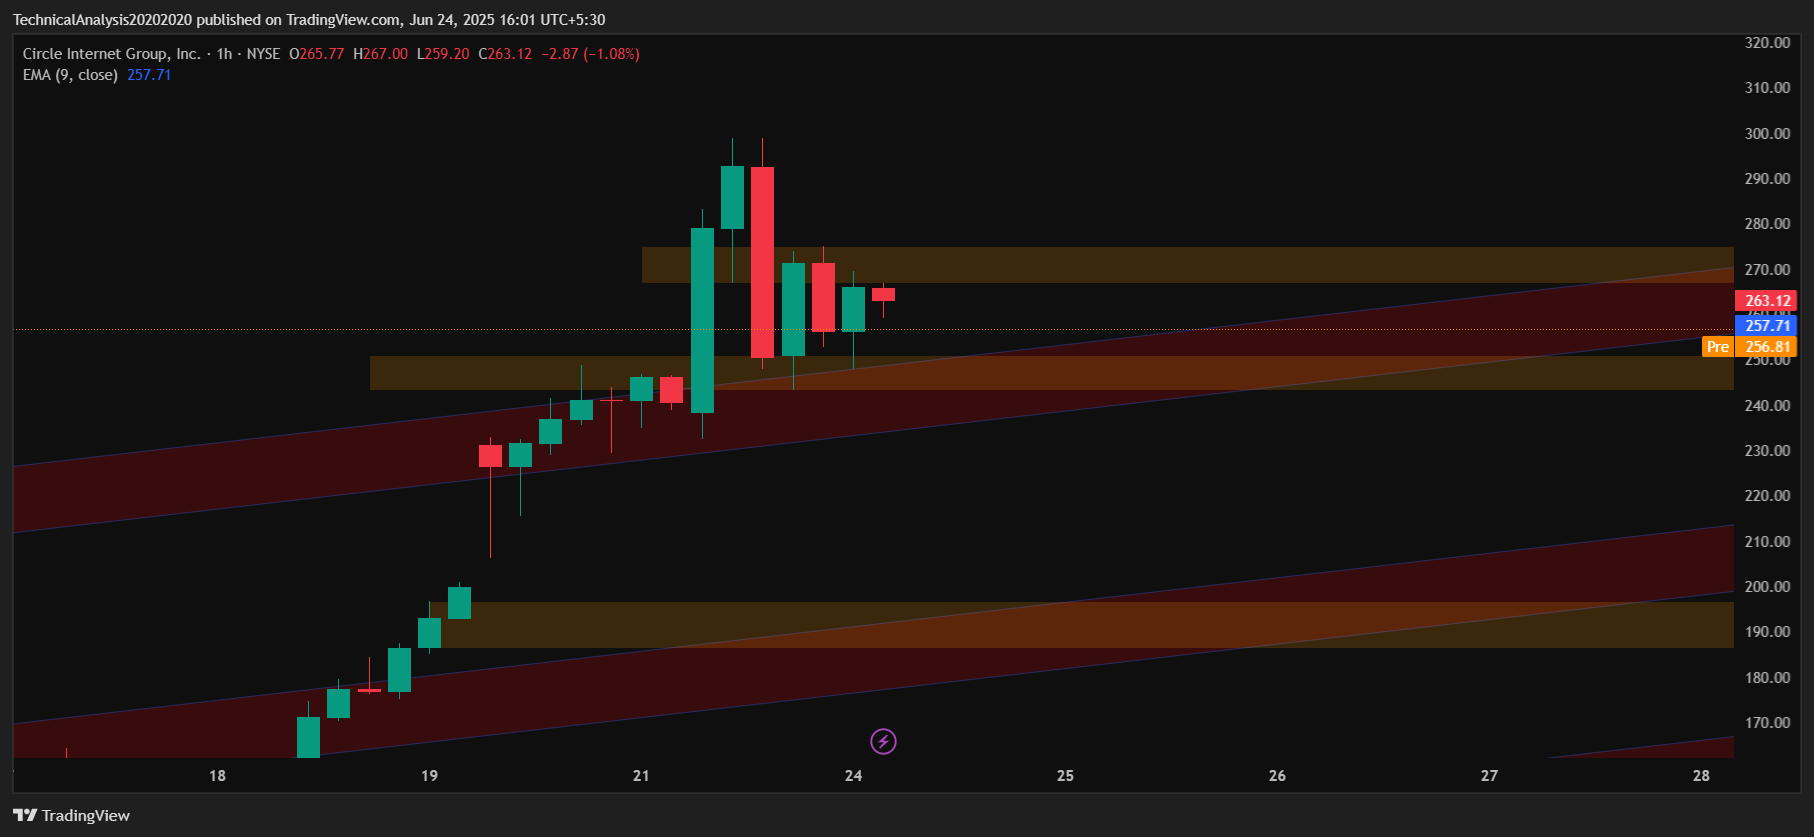
To regain a bullish outlook, Circle needs to sustain above $250 – a key resistance level – for several sessions. Until then, price action may stay confined to a parallel channel that appears to be forming between $206 and $255. This range-bound movement is consistent with what has previously been observed in CRCL’s chart structure.
The stock briefly broke above a minor trendline, indicating short-term momentum. However, there is a high probability that price could retest the 9-day EMA, which currently sits at $194.85 on the daily timeframe. At the time of writing, the stock is showing some rejection near the previous session’s high, suggesting buyers are cautious around resistance zones.
Meanwhile, the RSI (Relative Strength Index) is hovering around 50, indicating neither overbought nor oversold conditions. For a stronger reversal confirmation, RSI would ideally need to bounce from near-oversold levels with increasing momentum.
This intraday spike may provide short-term relief, but given the volatility and broader market reaction to stablecoin regulation updates – including the BIS report that criticized the viability of stablecoins — investors should remain alert. Technical setups hint at continued volatility unless CRCL reclaims and holds higher levels with strong volume.
This article is for informational purposes only and should not be considered financial advice. Investing in stocks, cryptocurrencies, or other assets involves risks, including the potential loss of principal. Always conduct your own research or consult a qualified financial advisor before making investment decisions. The author and publisher are not responsible for any financial losses incurred from actions based on this article. While efforts have been made to ensure accuracy, economic data and market conditions can change rapidly. Always verify data with primary sources before making decisions.
With over 3 years of experience in financial markets, we focus on simplifying global and Indian markets through clear, practical insights. Our expertise also extends to the evolving landscape of digital finance, including blockchain, stablecoins, and decentralized finance (DeFi).
Circle Internet Group Inc. (NYSE: CRCL) extended its dramatic downtrend for a third consecutive session, closing at $198.62, down 10.79% from yesterday’s close. This sharp decline follows two straight days of losses and now amounts to a weekly drop of 17.3%, wiping out nearly $24 billion in market capitalization from Monday’s intraday peak of $298.99, when CRCL’s valuation briefly touched $67 billion.
Today, the market closed with a strong bearish marubozu candle, signaling relentless selling pressure throughout the session. CRCL opened at $218.54, reached an intraday high of $227.54, but sold off aggressively to a session low of $198.00.
Wednesday’s drop was fueled by a fresh macro headwind: a critical report by the Bank for International Settlements (BIS) – the global financial institution owned by 63 central banks, including the U.S. Federal Reserve, ECB, and Bank of Japan. Often called the “central bank of central banks,” the BIS holds significant sway over global monetary policy perspectives.
In its newly published analysis, the BIS acknowledged the value of tokenization – the process of converting real-world assets or fiat currencies into digital tokens for use on blockchain networks – but dismissed stablecoins like USDC as insufficient for systemic financial infrastructure.
“stablecoins offer some promise on tokenization, but fall short of requirements to be the mainstay of the monetary system when set against the three key tests of singleness, elasticity, and integrity.”
This statement undermines the foundational business case for Circle’s USDC, which boasts a $61.9 billion market cap and processed $2.61 trillion in annual transaction volume, positioning itself as the go-to stablecoin for regulated financial rails.
Valuation and Institutional Rotation Add to Pressure
Wednesday’s fall adds to existing concerns that began mounting earlier in the week. On Monday, CRCL reached an intraday high of $298.99, reflecting a 750% gain from its $31 IPO price. However, that surge was quickly followed by heavy institutional selling.
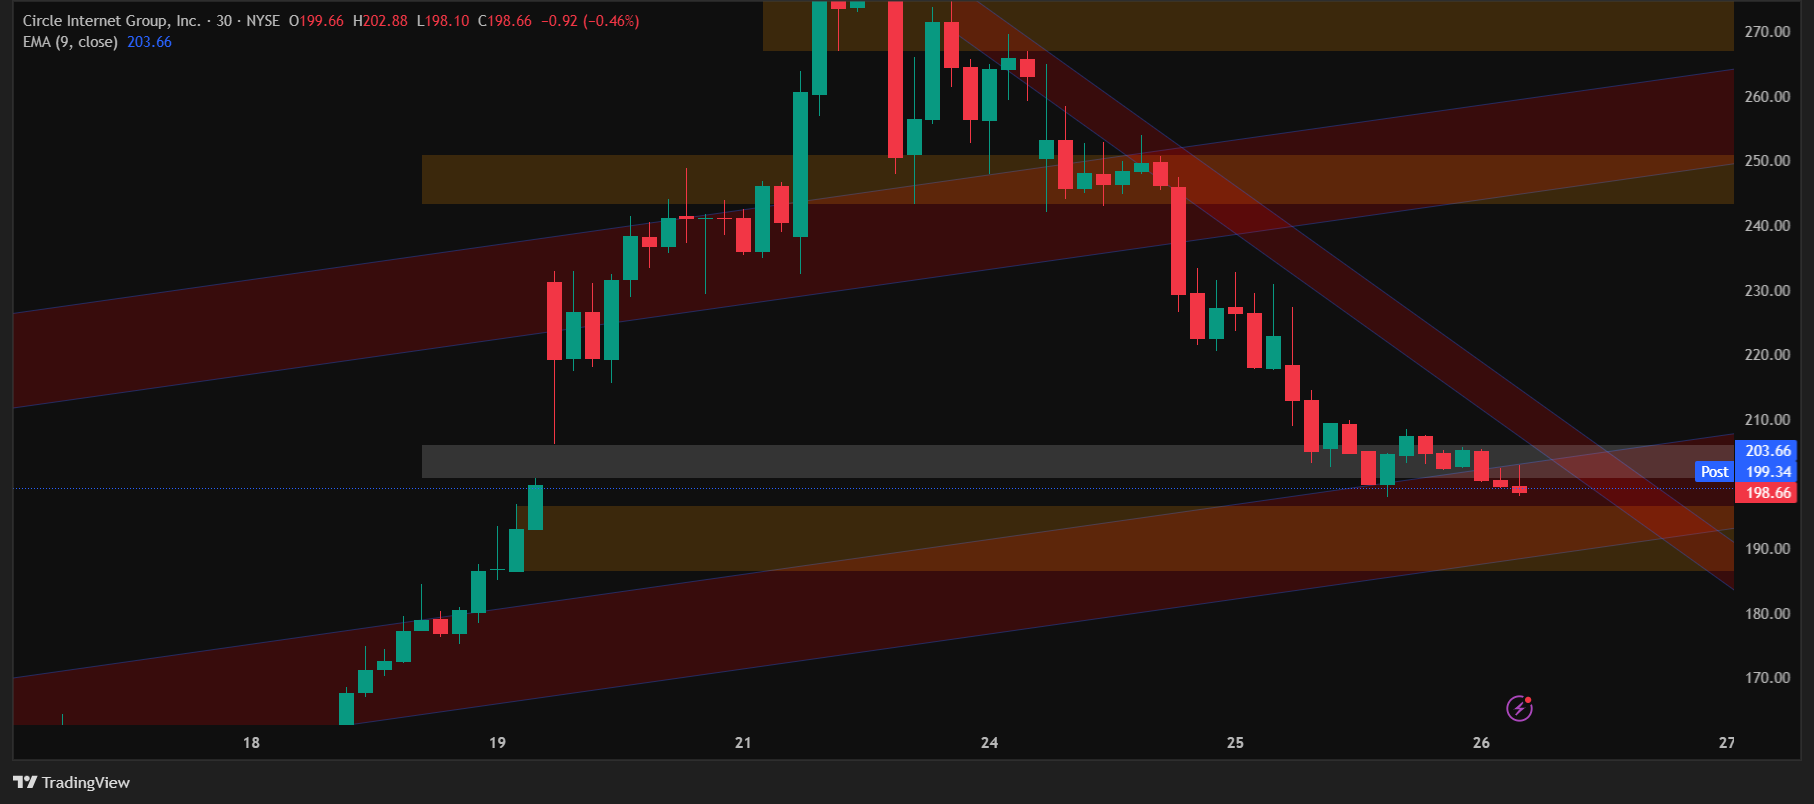
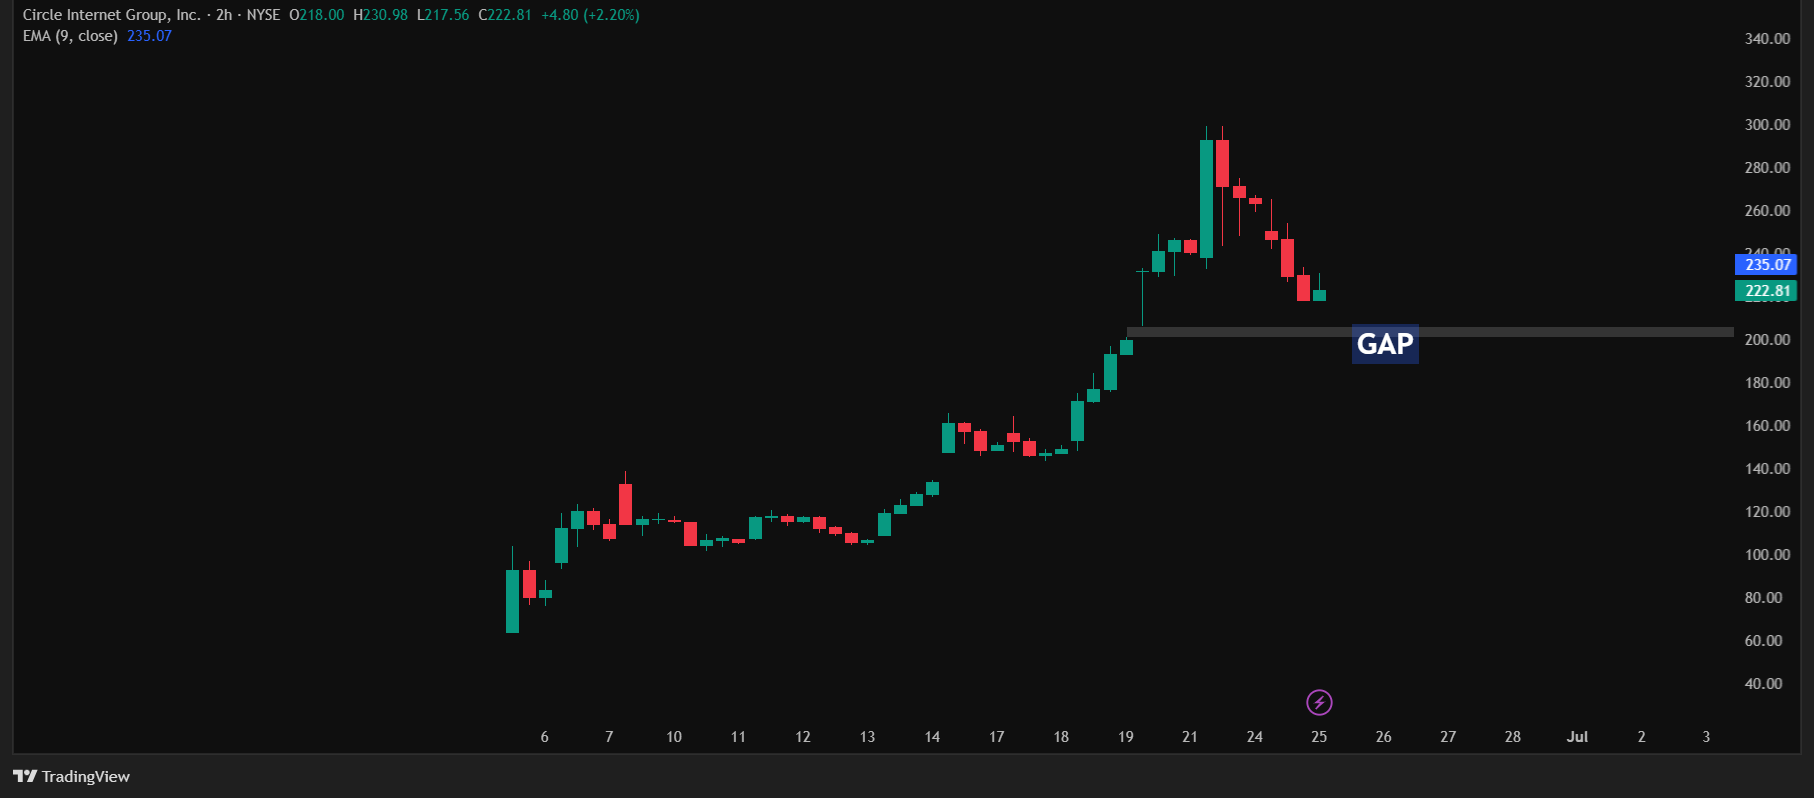
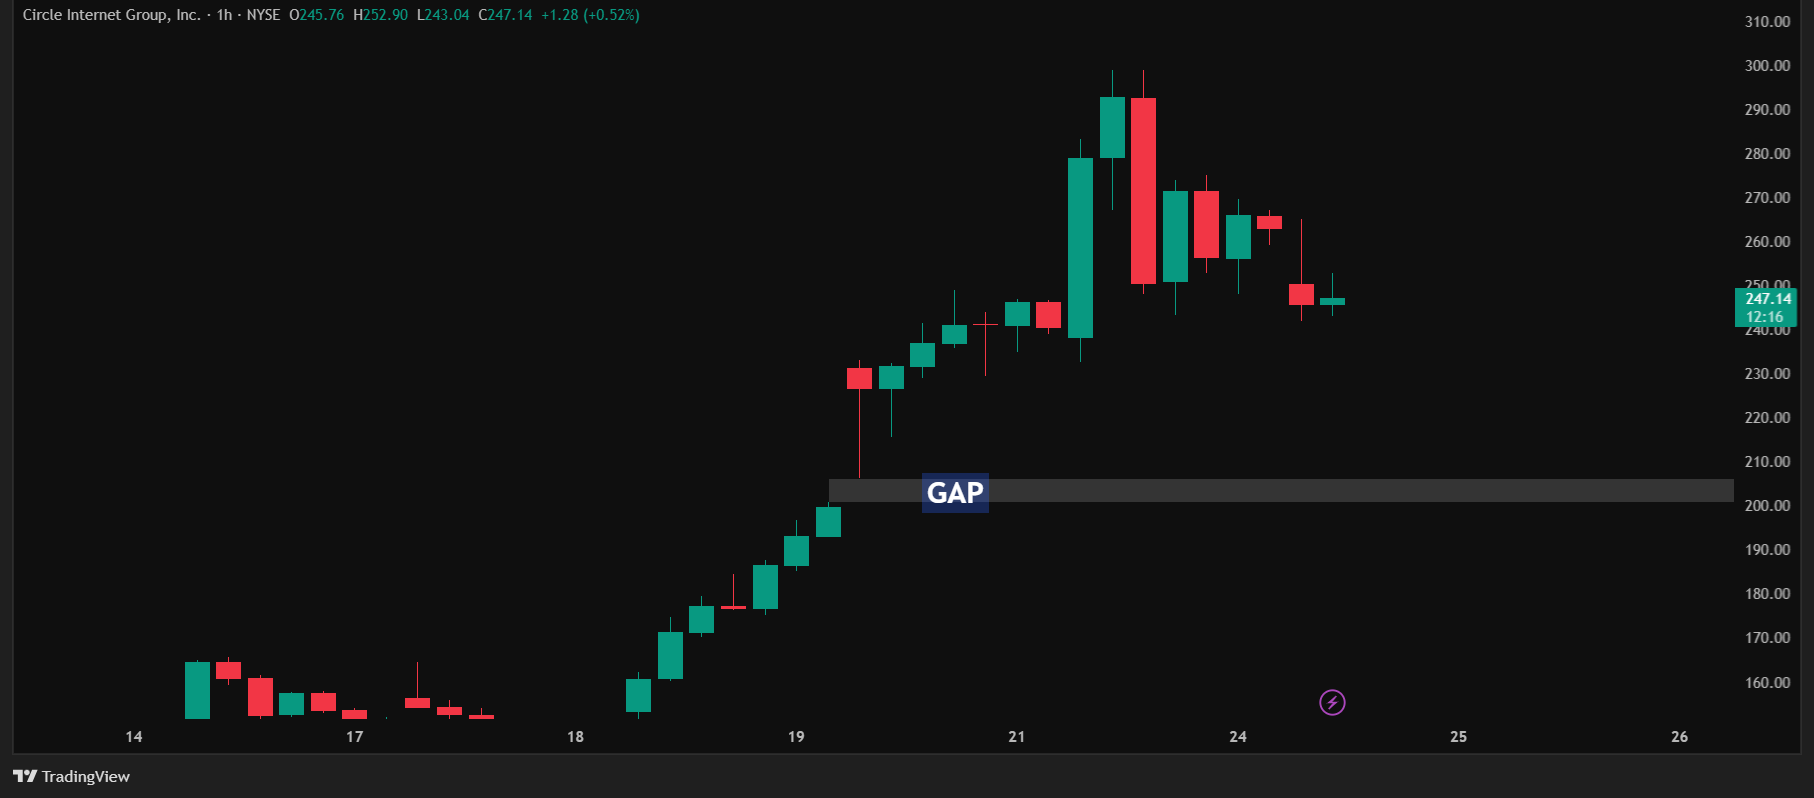
On the technical front, CRCL has now filled the price gap between $200–$206, a zone previously highlighted by us as an inevitable magnet for price correction. The stock is now hovering at a critical confluence zone around $198–$200, where technical and geometric support levels meet.
The 9-day EMA on the daily chart sits near $188–$190, a zone that could act as the next key support if selling continues. Any bounce toward $200–$205 would need strong volume confirmation to reverse the bearish trend.
The Relative Strength Index (RSI) on the daily timeframe is currently at 40.43, just above the oversold threshold of 30. This suggests that while the stock has weakened considerably, it hasn’t yet hit panic-selling levels typically associated with technical reversals.
Summary
With the macro narrative turning cautious, regulatory uncertainty resurfacing, and key support zones being tested, CRCL’s near-term trajectory remains volatile. While Circle’s fundamentals – including its USDC dominance, partnerships with Fiserv, and regulatory leadership – remain strong, the market is clearly entering a valuation reset phase.
This article is for informational purposes only and should not be considered financial advice. Investing in stocks, cryptocurrencies, or other assets involves risks, including the potential loss of principal. Always conduct your own research or consult a qualified financial advisor before making investment decisions. The author and publisher are not responsible for any financial losses incurred from actions based on this article. While efforts have been made to ensure accuracy, economic data and market conditions can change rapidly. The author and publisher do not guarantee the completeness or accuracy of the information and are not liable for any errors or omissions. Always verify data with primary sources before making decisions.
With over 3 years of experience in financial markets, we focus on simplifying global and Indian markets through clear, practical insights. Our expertise also extends to the evolving landscape of digital finance, including blockchain, stablecoins, and decentralized finance (DeFi).
The slide filled a technical gap between $200-$206, formed during last week’s 750% rally from a $31 IPO to a $298.99 peak. CRCL’s market cap now stands at $44.79B, down $5B from Monday’s $49.1B. Trading volume hit 24.49M shares, signaling intense selling pressure.
From a technical standpoint, CRCL’s RSI is at 35, inching closer to the oversold threshold of 30. The gap between $200–$206, visible in last week’s rapid rally, has now been completely filled – a move often seen as a potential bounce zone for short-term traders. However, whether this leads to a reversal or a further slide toward the $190–$200 range remains uncertain.
With institutional profit-taking, valuation concerns, and broader risk sentiment affecting fintech stocks, Circle’s near-term trajectory may depend on buyers’ willingness to defend the $200 support level.
As of now, the technical structure suggests a likely retest of $190–$200 if the stock fails to hold above today’s lows. Analysts and traders will be closely watching the close for confirmation of strength or further downside.
This article is for informational purposes only and should not be considered financial advice. Investing in stocks, cryptocurrencies, or other assets involves risks, including the potential loss of principal. Always conduct your own research or consult a qualified financial advisor before making investment decisions. The author and publisher are not responsible for any financial losses incurred from actions based on this article. While efforts have been made to ensure accuracy, economic data and market conditions can change rapidly. The author and publisher do not guarantee the completeness or accuracy of the information and are not liable for any errors or omissions. Always verify data with primary sources before making decisions.
With over 3 years of experience in financial markets, we focus on simplifying global and Indian markets through clear, practical insights. Our expertise also extends to the evolving landscape of digital finance, including blockchain, stablecoins, and decentralized finance (DeFi).
Cathie Wood’s ARK Invest has stirred the market again – this time by trimming its position in Circle Internet Group (NYSE: CRCL) while boosting its stake in Coinbase (NASDAQ: COIN). On June 23, 2025, ARK sold 415,844 CRCL shares worth $109.6 million, part of a larger divestment totaling $352 million, according to reports from Cointelegraph.
What’s behind the rebalancing?
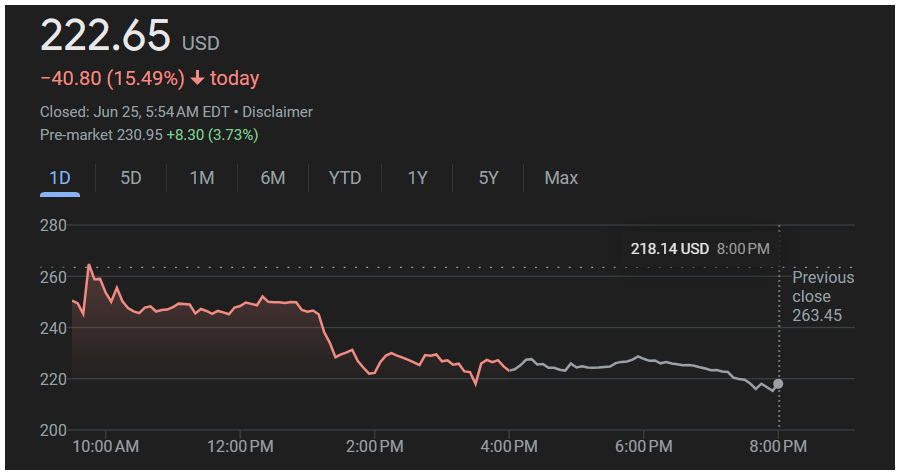
It’s a strategic pivot rooted in profit-taking after Circle’s explosive 750% rally from its $31 IPO price to an all-time high of $298.99, which briefly pushed its market cap to $67 billion. CRCL dropped 15.49% to $222.65 on tuesday, cutting its market cap to approximately $49.1 billion, with after-hours trading slipping further to $218.14.
At the time of writing, it is trading 3.90% higher at $232 in the pre-market session.
Importantly, ARK hasn’t fully exited. It still holds 3.2 million CRCL shares, accounting for 7.8% of ARKW, signaling continued confidence in USDC (Circle’s flagship stablecoin). USDC currently boasts a $61.9 billion market cap and $2.61 trillion in annual transaction volume, according to CoinMarketCap.
However, CRCL’s P/E ratio of 238 and EV/EBITDA of 197.04 point to a stretched valuation. In contrast, Coinbase offers diversified exposure to the crypto ecosystem. ARK acquired 4,198 COIN shares worth $1.48 million, capitalizing on its $955.8 million Q1 2025 revenue, expanding Base Layer 2 network, and the broader 15% rally in Bitcoin.
While the GENIUS Act supports the stablecoin sector by clarifying U.S. regulations, ARK’s rotation into COIN appears to hedge against potential volatility and overvaluation in CRCL – balancing its fintech bet between infrastructure (COIN) and tokenization (CRCL).
This article is for informational purposes only and should not be considered financial advice. Investing in stocks, cryptocurrencies, or other assets involves risks, including the potential loss of principal. Always conduct your own research or consult a qualified financial advisor before making investment decisions. The author and publisher are not responsible for any financial losses incurred from actions based on this article. While efforts have been made to ensure accuracy, economic data and market conditions can change rapidly. The author and publisher do not guarantee the completeness or accuracy of the information and are not liable for any errors or omissions. Always verify data with primary sources before making decisions.
With over 3 years of experience in financial markets, we focus on simplifying global and Indian markets through clear, practical insights. Our expertise also extends to the evolving landscape of digital finance, including blockchain, stablecoins, and decentralized finance (DeFi).
New York, 05:42 AM ET:Circle Internet Group Inc. (NYSE: CRCL) surged 4.42% to $232.48 in pre-market trading at 8:00 AM EDT, rebounding from Wednesday’s 15.49% plunge to $222.65 . The drop, extending a correction from a $298.99 peak on June 23, wiped $18B off CRCL’s market cap, now $49B. Investors are eyeing Circle’s USD Coin (USDC), with $2.61T in 2024 transactions, as a stabilizing force.
The recovery follows a brutal two-day slide, sparked by Cathie Wood’s ARK Invest selling 1.7M CRCL shares for $352M. Despite CRCL’s 750% rally since its $31 IPO on June 5, 2025, its P/E of 238 signals overvaluation.
RSI at 40.77 suggests potential to fill a $206 gap or test $200, but pre-market strength hints at a $200-$250 range.
This article is for informational purposes only and should not be considered financial advice. Investing in stocks, cryptocurrencies, or other assets involves risks, including the potential loss of principal. Always conduct your own research or consult a qualified financial advisor before making investment decisions. The author and publisher are not responsible for any financial losses incurred from actions based on this article. While efforts have been made to ensure accuracy, economic data and market conditions can change rapidly. The author and publisher do not guarantee the completeness or accuracy of the information and are not liable for any errors or omissions. Always verify data with primary sources before making decisions.
With over 3 years of experience in financial markets, we focus on simplifying global and Indian markets through clear, practical insights. Our expertise also extends to the evolving landscape of digital finance, including blockchain, stablecoins, and decentralized finance (DeFi).
Circle Internet Financial Ltd. (NYSE: CRCL), the fintech powerhouse behind the USDC stablecoin, has hit a rough patch. On Tuesday, June 25, its stock plummeted 15.49%, closing at $222.65 – down from Monday’s close of $263.50. This sharp decline erased nearly $5 billion from its market capitalization, leaving it at $49.1 billion.
The stock opened at $250.42 – a key support level – before sinking to an intraday low of $217.58. After hours, it dipped further to $218.14, shedding another 2.03% ($4.51). Despite this tumble, CRCL remains up an impressive 42.40% over the past five days, though the recent drop has investors questioning whether the worst is yet to come.
The financial world buzzed with news of Cathie Wood’s ARK Invest, a prominent ETF provider, unloading a significant chunk of CRCL stock. Instead, Wood redirected capital into Robinhood (HOOD) and Coinbase (COIN) shares – a move that’s amplified the bearish sentiment around CRCL. ARK’s decisions often sway market trends, and this sell-off has contributed to the stock’s downward spiral.
The timing is notable: Monday saw CRCL surge 25% to an intraday peak of $298.99 on news of a partnership with Fiserv, only to crash 11.9% from that high. Tuesday’s 17.89% drop from an intraday peak of $265 to the low of $217.58 underscores the volatility gripping the stock.
Technical Breakdown: Bearish Signals Dominate
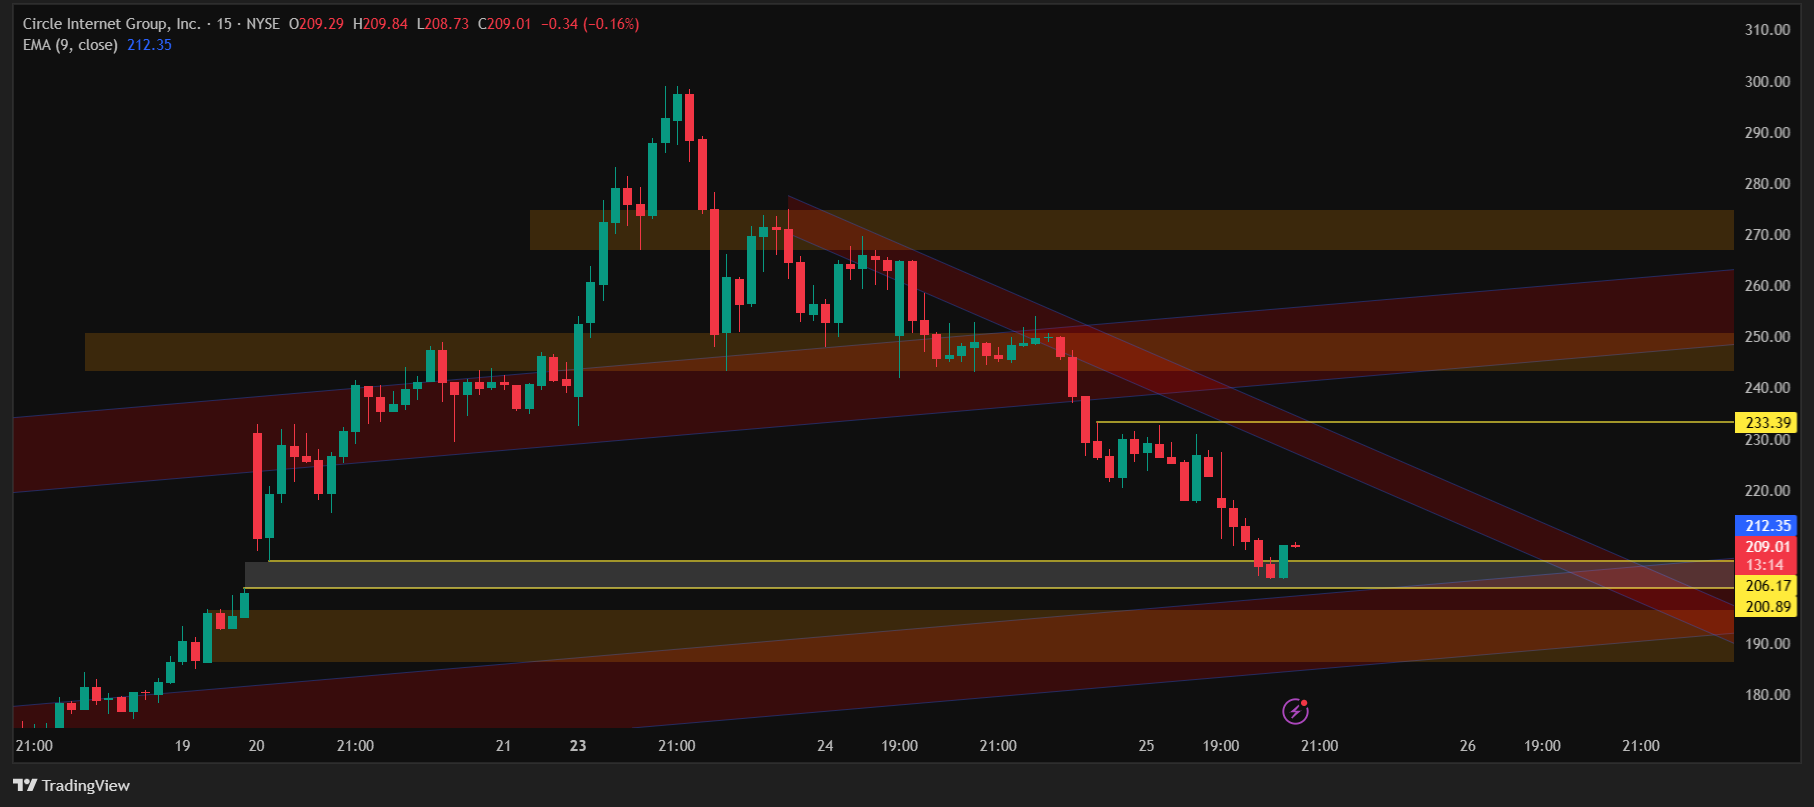
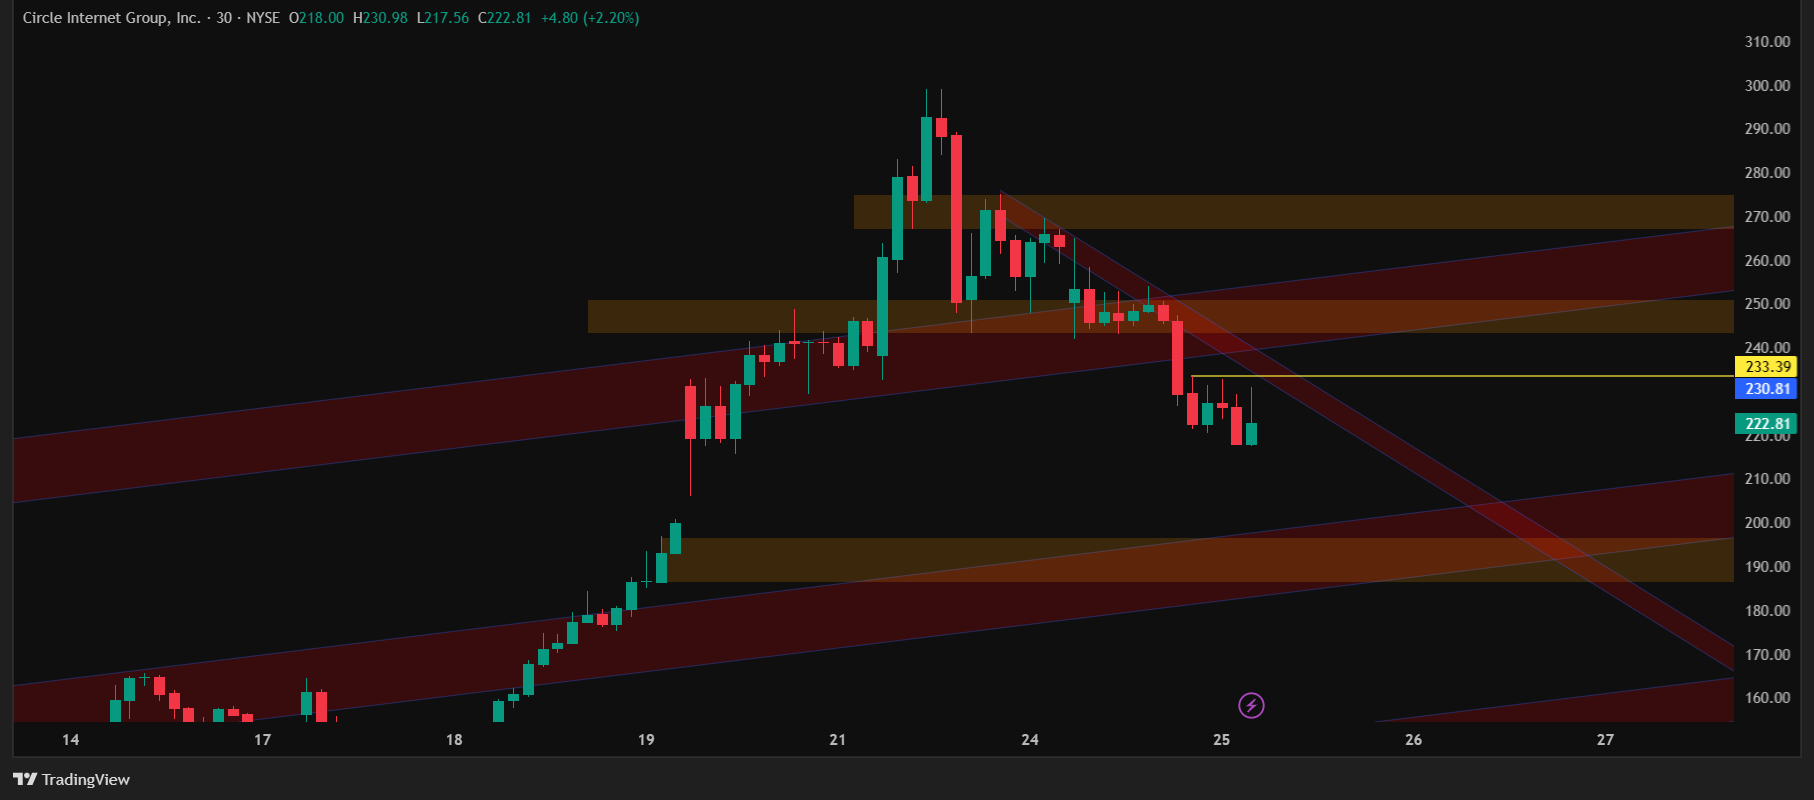
The charts tell a grim story. Tuesday’s close featured a bearish marubozu candlestick – a sign of unrelenting selling pressure. The stock, now at $222.50, has breached its critical $245-250 support zone and retraced to $230, aligning with the 9EMA on the hourly timeframe.
On the daily chart, the 9EMA support sits at $186.55, near a broader support range of $185-205, based on simple price action analysis. Meanwhile, the $243-250 zone has flipped into a major resistance, with $233-238 acting as a minor hurdle below it.
The Relative Strength Index (RSI) stands at 40.77 – not yet in oversold territory (below 30) – suggesting room for further downside. Analysts see CRCL potentially filling a gap below $206 and testing the $200 level.
For now, the stock appears poised to trade range-bound between $200 and $250, reflecting a cooling-off period after its meteoric 750% rise from an IPO price of $31. That overstretched rally, paired with a high P/E ratio compared to industry peers, had long hinted at an overdue correction.
Key Technical Levels:
Support: $185-205 (daily 9EMA at $186.55), $200 zone
Resistance: $233-238 (minor), $243-250 (major)
RSI: 40.77 (neutral, not oversold)
CRCL Financials: A Silver Lining Amid the Crash?
Despite the stock’s recent decline, Circle’s fundamentals remain strong. For the fiscal year, the company reported a net income of $155.67 million and revenue of $1.68 billion, with 110.07 million shares outstanding (Source: TradingView).
As a leader in the stablecoin space, Circle’s business model is closely tied to the growing adoption of digital assets – a trend that could support its long-term outlook. However, the recent market cap contraction and technical headwinds continue to overshadow these strengths in the short term.
CRCL’s $5 billion market cap wipeout is a stark reminder of the volatility that follows high-flying stocks. Cathie Wood’s pivot to Robinhood and Coinbase has fueled the sell-off, while technical indicators point to a possible drop to $200. Profit-taking after a 750% post-IPO run was inevitable, but the depth of this correction – coupled with a lofty P/E ratio – raises questions about near-term stability. Still, Circle’s strong financials and its foothold in the stablecoin market suggest resilience over the long haul.
Will it get worse? The $200 level looms as a critical test. If it holds, CRCL could stabilize within the $200-250 range. A break below, however, might signal deeper trouble. Investors should keep a close eye on volume, RSI, and any fresh catalysts to gauge the stock’s next chapter. For now, caution is the name of the game.
This article is for informational purposes only and should not be considered financial advice. Investing in stocks, cryptocurrencies, or other assets involves risks, including the potential loss of principal. Always conduct your own research or consult a qualified financial advisor before making investment decisions. The author and publisher are not responsible for any financial losses incurred from actions based on this article. While efforts have been made to ensure accuracy, economic data and market conditions can change rapidly. The author and publisher do not guarantee the completeness or accuracy of the information and are not liable for any errors or omissions. Always verify data with primary sources before making decisions.
With over 3 years of experience in financial markets, we focus on simplifying global and Indian markets through clear, practical insights. Our expertise also extends to the evolving landscape of digital finance, including blockchain, stablecoins, and decentralized finance (DeFi).
Circle Internet Group Inc. (NYSE: CRCL), the issuer of the world’s second-largest stablecoin, USDC, is facing a turbulent week. Already down 17.3% from the previous week’s close and wiping out nearly $24 billion in market capitalization from Monday’s intraday peak of $298.99, CRCL touched the $200 mark on Wednesday.
As of June 25’s close at $198.62, the sharp decline has wiped out nearly $24 billion in market capitalization, bringing CRCL’s valuation down from its June 23 peak of approximately $67 billion to $43.8 billion. The steep three-day drop has intensified investor concerns, especially after breaching the psychologically and technically significant $200 level. With Circle now trading below key moving averages and macro pressure mounting after the BIS report, many are questioning whether the correction could deepen further toward the $188–$190 zone, which marks the next critical support.
Here are seven key reasons behind Circle’s stock drop and what they mean for investors.
1. Downgrades from Major Banks Like JPMorgan
Circle Internet Group has faced significant headwinds due to downgrades from prominent financial institutions like JPMorgan. On the first day of Wall Street coverage, JPMorgan initiated its coverage of Circle with an Underweight rating, equivalent to a sell recommendation, citing an unjustifiably high valuation. Their $80 price target, which already factors in a premium for investor enthusiasm, signals a lack of confidence in the stock’s current price, contributing to its downward pressure as institutional investors reassess their positions.
2. Jim Cramer’s Bearish Commentary Undermines Investor Confidence
Jim Cramer, a widely followed market commentator, has publicly criticized Circle Internet Group, calling its current stock price “crazy” and unjustifiable by any measure. His vocal disapproval, combined with his influence among retail and institutional investors, has likely demoralized the market and eroded confidence in Circle’s valuation. Such high-profile bearish sentiment amplifies selling pressure, further driving the stock’s decline.
3. Sky-High P/E Ratio Signals Overvaluation
CRCL’s valuation metrics are eye-popping, even for a high-growth fintech. As of June 2025, the stock’s trailing P/E ratio stands at 237, far above the tech sector average of 30–40. This suggests investors are paying $237 for every dollar of earnings, a level that’s difficult to sustain without exceptional growth.
Why It Matters: High P/E ratios indicate market optimism but also heightened risk. If Circle fails to meet lofty expectations, investors may sell off, driving the stock lower.
CRCL’s EV/EBITDA of 197.04 and price/sales of 31.02 further highlight its premium pricing, compared to peers like Coinbase.
Since its IPO on June 5, 2025, at $31 per share, CRCL has skyrocketed 749.84%, outpacing the S&P 500’s 2.44% year-to-date gain. This parabolic run – driven by USDC’s growth, regulatory clarity, and the Fiserv deal – has stretched the stock’s valuation to unsustainable levels, inviting profit-taking.
Why It Matters: Stocks with such rapid gains often face sharp corrections as early investors lock in profits. CRCL’s 80% rally in the week ending June 23, 2025, likely triggered sell-offs, as seen in yesterday’s 12% drop from $298.99.
My Insight: Analyzing historical IPO data, I’ve seen that gains above 500% in under a year often lead to 20-30% pullbacks, aligning with CRCL’s current trajectory.
As anticipated, CRCL filled the gap between $206 and $200 on Wednesday, confirming a key technical expectation that had been building since last week’s sharp rally.
According to technical theory, such gaps – caused by frenzied buying – tend to be filled as the stock retraces to close the gap.
Why It Matters:Technical traders see gaps as magnets for price action. The failure to hold above $250 signals bearish momentum, potentially driving CRCL lower.
My Insight: Studying CRCL’s candlestick charts, I noted the gap around $200–$206, which aligns with heavy selling pressure.
Last week, ARK sold 1.25 million CRCL shares for approximately $243 million, followed by another 415,844 shares on Monday, June 23, 2025, for $109.6 million, reported by Cointelegraph. In total, ARK has offloaded about 1.7 million shares, representing 37% of the 4.5 million shares it purchased at IPO.
Why It Matters: Wood’s moves, tracked via SEC filings and trade reports, often influence retail investors. The sale of 1.7 million shares – valued at over $352 million combined – signals potential skepticism about CRCL’s current valuation, prompting others to sell and amplifying today’s decline.
Despite the sales, ARK retains 2.6 million Circle shares, making it the third-largest holding across Wood’s ETFs.
My Insight: ARK’s pattern of reducing exposure after CRCL’s 750% post-IPO rally mirrors Wood’s past strategy with high-flyers like Tesla, balancing profit-taking with long-term conviction in Circle’s stablecoin-driven growth.
7. BIS Delivers Damning Verdict on Stablecoins in Tuesday Release
The fifth and most recent driver of CRCL’s accelerated selloff came from the Bank for International Settlements (BIS) – an influential global institution owned by 63 central banks.
In a press release issued Tuesday, the BIS dealt a fresh blow to Circle’s core business model, as reported by CoinDesk.
The report warned that stablecoins cannot reliably maintain one-to-one parity with central bank money, may struggle with liquidity under stress, and lack proper controls to prevent financial crime. While the BIS expressed support for tokenization and digital innovation, it clearly positioned central bank digital currencies (CBDCs) as the preferred path forward.- not privately issued stablecoins like USDC.
This public disapproval from the world’s top monetary coordination body has spooked investors and deepened fears that global regulators may tighten oversight on stablecoins. For Circle, whose USDC is its flagship product with over $61.9 billion in circulation, the report undermines its long-term vision of replacing traditional banking rails with private tokenized dollars. The timing of the statement, amid already intense downward pressure on CRCL, has only accelerated the stock’s selloff.
Is a Correction Toward $200 Inevitable?
Latest Update – CRCL Corrects to $200, Closes at $198.62 on Wednesday, June 25. The stock has now plunged more than 33% from its all-time high of $298.99 earlier in the week.
CRCL’s 14% drop to $226, reflects a confluence of factors: an overheated P/E ratio, profit-taking after a 750% rally, a technical price gap, and selling pressure from Cathie Wood’s ARK. While Circle’s fundamentals – such as USDC’s $2 trillion in annual transactions and the Fiserv partnership – remain strong, the stock’s valuation suggests continued downside risk.
Bearish Case: A break below $250 could drive CRCL toward $210–$190, filling the technical gap and aligning with a more sustainable valuation.
Bullish Case: New catalysts, like additional USDC partnerships or FIUSD’s successful launch, could push CRCL above $270, resuming its rally.
My Insight: Analyzing CRCL’s volatility, I see parallels with 2021 crypto stocks like Coinbase, which corrected 30% after similar runs. Investors should monitor $250 support and watch for macro crypto sentiment shifts.
This article is for informational purposes only and should not be considered financial advice. Investing in stocks, cryptocurrencies, or other assets involves risks, including the potential loss of principal. Always conduct your own research or consult a qualified financial advisor before making investment decisions. The author and publisher are not responsible for any financial losses incurred from actions based on this article. While efforts have been made to ensure accuracy, economic data and market conditions can change rapidly. The author and publisher do not guarantee the completeness or accuracy of the information and are not liable for any errors or omissions. Always verify data with primary sources before making decisions
With over 3 years of experience in financial markets, we focus on simplifying global and Indian markets through clear, practical insights. Our expertise also extends to the evolving landscape of digital finance, including blockchain, stablecoins, and decentralized finance (DeFi).
Circle Internet Group (NYSE: CRCL) is seeing a breakout year, with its stock up over 750% since its June 5, 2025 IPO, fueled by the explosive growth of its USDC stablecoin and a new strategic partnership with payments giant Fiserv (NYSE: FI). On June 23, 2025, Fiserv announced a major integration deal with Circle to bring both USDC and its own upcoming stablecoin, FIUSD, to millions of merchants and banks. The partnership could potentially shake up the payments industry long dominated by Visa and Mastercard.
Stablecoins like USDC (Circle) and FIUSD (Fiserv’s forthcoming stablecoin) are digital currencies pegged 1:1 to the U.S. dollar, backed by reserves like cash or short-term Treasury bonds. Here’s how it works:
Deposit and Mint: You send $1 to Circle or Fiserv, and they issue 1 USDC or FIUSD token, fully backed by secure assets.
Invest and Earn: The issuer invests your dollar in low-risk assets, earning 4–5% annualized interest. This interest is their profit.
Transact Cheaply: You use USDC or FIUSD for payments, remittances, or DeFi on blockchains like Solana or Ethereum, with fees as low as 0.1–0.5%, compared to Visa’s 2–3%.
Transparency: Circle provides monthly attestations by Grant Thornton to verify USDC’s reserves. Fiserv, a regulated fintech, commits to similar oversight for FIUSD.
As of June 24, 2025, USDC’s market cap is $61.9 billion, holding 27% of the $225 billion stablecoin market, behind Tether’s USDT ($102 billion, per CoinMarketCap). Circle’s stock hit $298.99 on June 23, 2025, valuing the company at $63.9 billion, up from $6.9 billion at its June 5, 2025 IPO. Fiserv, with an $94.5 billion market cap, is now adopting this model with FIUSD, set to launch by December 2025.
CRCL-Fiserv Partnership – Stablecoins Go Mainstream
On June 23, 2025, Circle and Fiserv, Inc. announced a partnership to integrate USDC and FIUSD into Fiserv’s network of 10,000 financial institutions and 6 million merchant locations. This deal, reported by Bloomberg, is a turning point for stablecoin adoption:
USDC Access: Fiserv’s clients can use USDC for real-time, low-cost payments via Circle’s Circle Payments Network, slashing costs for cross-border transfers or merchant settlements.
FIUSD Launch: Fiserv’s FIUSD, built on Circle’s infrastructure and Solana’s blockchain, will launch by December 2025 and be interoperable with USDC, enabling seamless transactions.
Massive Scale: Fiserv processes $5 trillion in transactions annually, giving USDC and FIUSD access to millions of users, from community banks to global retailers.
Regulatory Trust: Circle’s New York BitLicense and Fiserv’s AML/KYC compliance align with the GENIUS Act, which mandates reserve audits and consumer protections.
The announcement drove CRCL’s stock up 9.6% to $263.45 and Fiserv’s by 4.3% to $170.21 on June 23, 2025 (Yahoo Finance).
Disrupting Visa and Mastercard – A Cheaper, Faster Alternative
Visa and Mastercard process over $20 trillion annually but charge merchants 2–3% per transaction, totaling $100 billion+ in fees yearly. USDC and FIUSD offer a disruptive alternative –
Low Fees: Stablecoin transactions cost 0.1–0.5% on blockchains like Solana. For example, a $1,000 sale via USDC costs a merchant $1–$5, versus $20–$30 with Visa (based on my analysis of blockchain fees).
Instant Settlements: Unlike card networks’ 1–3-day delays, stablecoins settle in seconds, 24/7, ideal for merchants and consumers.
Global Reach: USDC and FIUSD enable borderless payments without 1–2% currency conversion fees, supporting use cases like remittances.
The CRCL-Fiserv partnership could bring USDC and FIUSD to 6 million merchants, rivaling card networks. A retailer using Fiserv’s platform could accept USDC at checkout, saving thousands annually. As Circle’s CEO Jeremy Allaire tweeted on June 23, 2025,
“USDC is digital cash for the internet age – fast, cheap, global.”
Stablecoins vs. Banks – Simpler, But Riskier
Stablecoins operate like a “debit card bank” with fewer rules than traditional banking:
No Lending: The GENIUS Act prohibits stablecoin issuers from lending reserves, unlike banks that use deposits for loans. Circle and Fiserv earn only from interest, simplifying the model but capping revenue.
Lighter Regulation: Circle’s BitLicense and Fiserv’s fintech compliance provide oversight, but stablecoins lack FDIC insurance, leaving users vulnerable if reserves are mismanaged.
However, crypto’s history raises red flags. Collapses like FTX, Celsius (2022), and Terraform Labs’ UST ($40 billion loss) show the sector’s volatility. While USDC’s audited reserves and Fiserv’s regulated status reduce risks, a market crash or reserve mismanagement could spark panic.
My Insight: Reviewing SEC filings and CoinMarketCap data, I found USDC’s reserves are fully backed, unlike Terra’s failed UST, but users must stay vigilant about audits.
Skeptics question whether stablecoins are a scam. Here’s a balanced view:
Concerns
Profit Asymmetry: Issuers keep the interest, while users bear risks like hacks or insolvency, as seen in BlockFi’s 2022 bankruptcy.
Crypto Failures: Scams like Bitconnect (2018) and Terra/Luna (2022) fuel distrust. A reserve failure could disrupt USDC or FIUSD.
No Insurance: Stablecoin holdings aren’t FDIC-insured, unlike bank deposits.
Reassurances
Transparency: Circle’s monthly attestations and Fiserv’s regulated status ensure accountability, unlike Tether’s past opacity.
Regulatory Progress: The GENIUS Act mandates audits and protections, boosting trust.
Proven Utility: USDC powers $2 trillion in annual transactions (CoinMarketCap), from remittances to DeFi. Fiserv’s adoption signals institutional confidence.
No Leverage: USDC and FIUSD are 1:1 backed, reducing collapse risks compared to algorithmic stablecoins.
The model isn’t a scam but requires due diligence. Check audits and understand risks before using stablecoins.
Fiserv (NYSE: FI)-Company Overview
Aspect
Details
Company Name
Fiserv, Inc. (NYSE: FI)
Founded
1984
Headquarters
Milwaukee, Wisconsin
Revenue (2024)
$19.1 billion
Market Cap
~$94.5 billion (June 2025)
Key Services
Core processing, digital banking, payment solutions
Network
10,000 financial institutions, 6 million merchant locations
Key Partnerships
Circle (USDC/FIUSD), Paxos, PayPal (PYUSD), Visa, Mastercard
Regulatory Status
Compliant with AML/KYC
This article is for informational purposes only and should not be considered financial advice. Investing in stocks, cryptocurrencies, or other assets involves risks, including the potential loss of principal. Always conduct your own research or consult a qualified financial advisor before making investment decisions. The author and publisher are not responsible for any financial losses incurred from actions based on this article. While efforts have been made to ensure accuracy, economic data and market conditions can change rapidly. The author and publisher do not guarantee the completeness or accuracy of the information and are not liable for any errors or omissions. Always verify data with primary sources before making decisions.
With over 3 years of experience in financial markets, we focus on simplifying global and Indian markets through clear, practical insights. Our expertise also extends to the evolving landscape of digital finance, including blockchain, stablecoins, and decentralized finance (DeFi).
Circle Internet Group Inc. (NASDAQ: CRCL) thrilled markets on Monday, closing up 9.64% at $263.45, a gain of $23.17 from the previous session. The stock surged nearly 25% intraday, touching a high of $298.99, before swiftly retreating 12% from its peak. With pre-market trading pointing to a modest – 1.27% dip at 260.10, one question remains to be answered that Is a correction toward $200 inevitable?
The day’s dramatic move was catalyzed by Fiserv’s (NASDAQ: FI) announcement of a strategic partnership with Circle to develop stablecoin-powered financial tools. The fintech giant also revealed plans to launch its own stablecoin, FIUSD, by year-end – leveraging Circle’s infrastructure alongside Paxos.
This news comes on the heels of the U.S. Senate passing a federal regulatory framework for stablecoins, a move expected to mainstream digital dollar alternatives and provide legal certainty for companies like Circle. The one-two punch of regulatory clarity and enterprise adoption sent CRCL shares soaring.
CRCL’s 750% Run Since IPO
Since its IPO on June 5, 2025, at $31 per share, CRCL has delivered a jaw-dropping +749.84% return – crushing the S&P 500’s modest 2.44% year-to-date gain. The company’s reach spans stablecoin issuance (via USDC), AI infrastructure, and early-stage tech investing, drawing attention from retail traders and institutional funds alike.
Market Cap
$63.9 Billion
Trailing P/E
3,020
Price/Sales (TTM)
31.02
Price/Book (MRQ)
78.70
EV/Revenue
30.59
EV/EBITDA
197.04
These metrics suggest premium pricing, even by high-growth tech standards, and indicate heightened downside risk if growth expectations are not met.
Technical Outlook: Is Volatility Here to Stay?
Monday’s trading range, from $232.48 to $298.99, underscored the volatility dominating CRCL. The inability to hold above $295 suggests heavy profit-taking near resistance.
Currently, CRCL is range-bound between $250 and $270. If the crucial support level of $250 is breached, the stock may crash with a high probability, potentially falling toward $200.
Conversely, if CRCL breaks and sustains above the $270 zone, it may resume its upward rally.
However, the fundamentals tell a different story. With such an elevated P/E ratio, the stock appears overheated and may require a correction to slow down and trade closer to its mean valuation.
The stock has dramatically outpaced the broader market, but history shows such parabolic moves often correct sharply.
What’s Next for Circle?
Despite short-term volatility, Circle’s fundamentals remain solid. It remains the primary issuer behind USDC, the second-largest stablecoin, and is expanding aggressively into institutional and fintech partnerships. The Fiserv deal and the anticipated FIUSD stablecoin launch further cement Circle’s role in the digital finance space.
Still, the elevated valuation and fast-paced gains introduce caution for new entrants.
Investors should monitor:
Key Support Zones: $210–$190 could provide a technical floor.
Catalysts: More partnerships or global adoption of USDC may reignite buying.
Macro Sentiment:Crypto and fintech sector moves will influence the stock.
This article is for informational purposes only and should not be considered financial advice. Investing in stocks, cryptocurrencies, or other assets involves risks, including the potential loss of principal. Always conduct your own research or consult a qualified financial advisor before making investment decisions. The author and publisher are not responsible for any financial losses incurred from actions based on this article. While efforts have been made to ensure accuracy, economic data and market conditions can change rapidly. The author and publisher do not guarantee the completeness or accuracy of the information and are not liable for any errors or omissions. Always verify data with primary sources before making decisions
With over 3 years of experience in financial markets, we focus on simplifying global and Indian markets through clear, practical insights. Our expertise also extends to the evolving landscape of digital finance, including blockchain, stablecoins, and decentralized finance (DeFi).
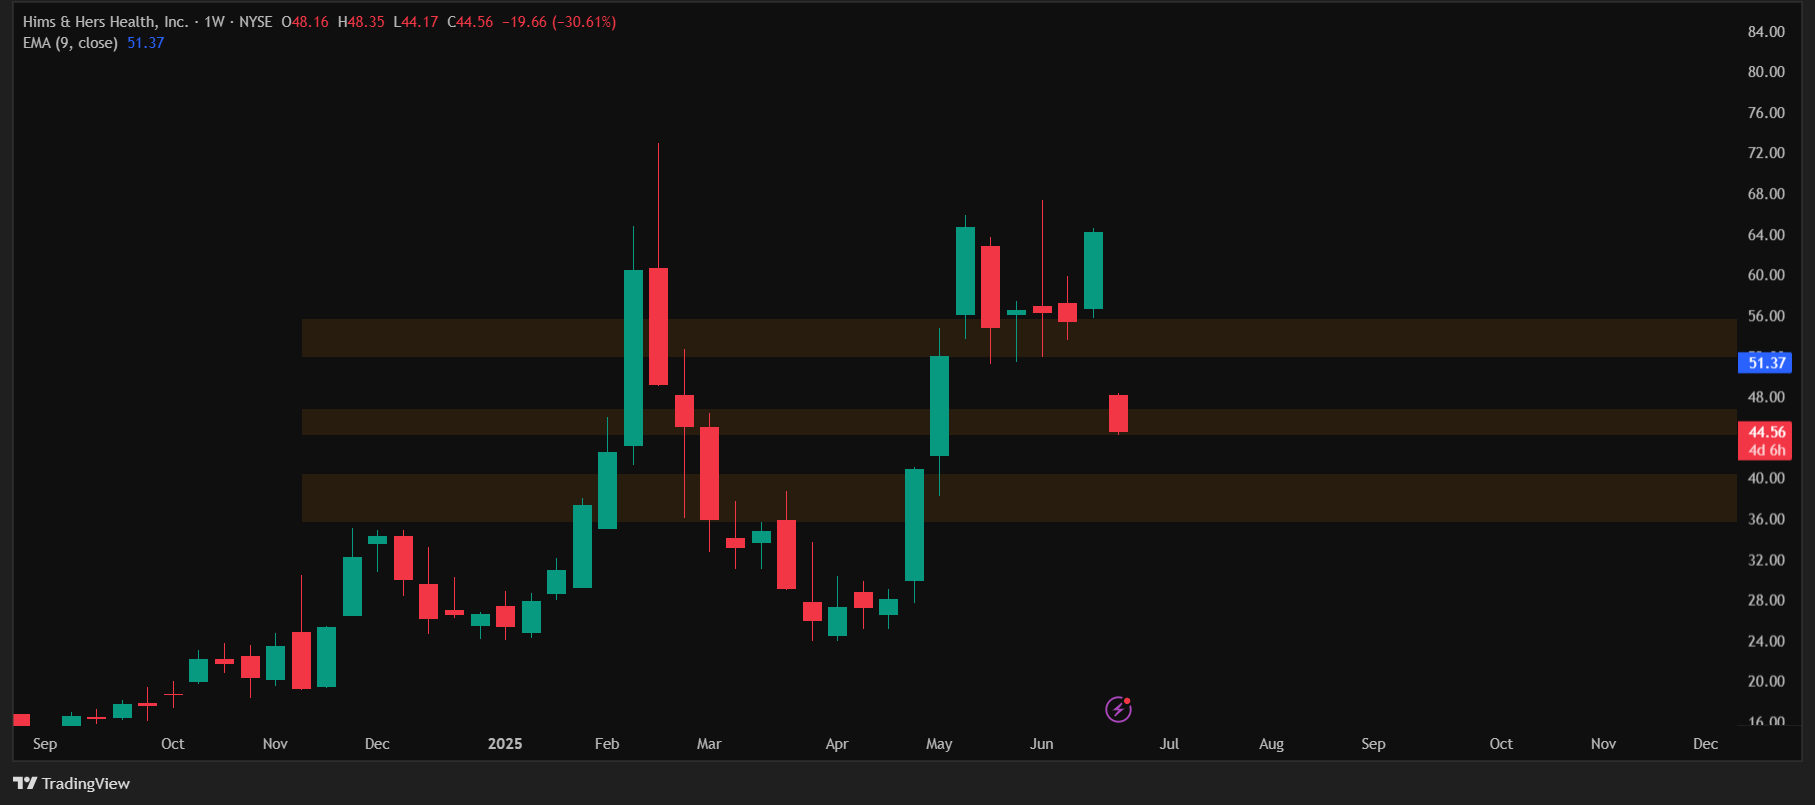
New York || 10:39 AM ET – plunging 30.7% to $43.00, down from Friday’s close, after Novo Nordisk abruptly terminated a critical partnership.
Trading volume surged to 39.90 million shares, nearly matching the three-month average, reflecting investor alarm. Despite the plunge, HIMS remains up 83.30% year-to-date (YTD), highlighting its volatile rally.
Why is Hims & Hers Falling Today?
The sell-off is driven by fundamental blows to Hims & Hers’ weight-loss business.
Novo Nordisk (NYSE: NVO) ended a monthlong partnership formed in April 2025 to transition patients from compounded versions of its blockbuster GLP-1 drug Wegovy to branded prescriptions.
Novo Nordisk alleged Hims engaged in “illegal mass compounding” and “deceptive promotion” of unapproved Wegovy knockoffs, which violated laws prohibiting mass sales of compounded drugs under the guise of personalization. The Danish drugmaker, whose own stock dipped 5.15%, stated it would no longer allow Wegovy to be bundled with Hims’ $599/month membership, a key growth driver.
The partnership’s collapse threatens Hims’ $725 million 2025 weight-loss revenue target, with compounded semaglutide accounting for ~25% of 2024 sales ($225 million).
Regulatory risks compound the issue: the FDA’s February 2025 removal of semaglutide from its shortage list, followed by a crackdown on compounders, already disrupted Hims’ GLP-1 supply. Hims’ pivot to oral medications and generic liraglutide has underperformed, per Leerink analyst Michael Cherny.
Additionally, Hims issued a surprise guidance cut on June 23, lowering its 2025 EBITDA forecast by 18% due to a 15% year-over-year rise in customer acquisition costs (CAC) and a 200-basis-point margin decline. Competition from Teladoc and GoodRx has squeezed Hims’ 2.4 million subscriber base (up 38% YoY), slowing core revenue growth from 45% in Q3 2024 to 29% in Q1 2025.
Hims & Hers’ financials reflect its high-risk profile:
Metric
Value
Market Cap
$9.98 Billion
EPS (TTM)
$0.68
Forward EPS (2025E)
$0.65(Est)
YTD Performance
83.30%
Shares Outstanding
213.73M*
Beta
3.22
The P/E ratio stands at 65.78, meaning investors are willing to pay $65.78 for every $1 of earnings.
Hims and Hers Health Stock Outlook June 2025
As of 10:39 AM, bearish sentiment prevails.
The stock’s RSI of 39 indicates oversold conditions, but the compounding scandal and guidance cut deter buyers.
HIMS is trading at its $45 support level; a breach could drive it to the next crucial support zone at $39–$36. If it recovers, $52–$54 may act as resistance, potentially leading to rangebound trading between $36 and $52 for several days. These technical levels are speculative and not investment advice.
A shift to oral medications or European growth via ZAVA could spur recovery, but for now, the compounding scandal keeps HIMS a high-risk play.
This article is for informational purposes only and not financial advice. Investing in stocks involves risks, including potential loss of principal. Conduct your own research or consult a qualified financial advisor before investing. The author and publisher are not liable for losses from actions based on this article. Data accuracy is not guaranteed due to changing market conditions.
With over 3 years of experience in financial markets, we focus on simplifying global and Indian markets through clear, practical insights. Our expertise also extends to the evolving landscape of digital finance, including blockchain, stablecoins, and decentralized finance (DeFi).