
From All-Time High to 20% Down – 5 Real Reasons Behind Bitcoin’s Sudden Fall

why is bitcoin dropping

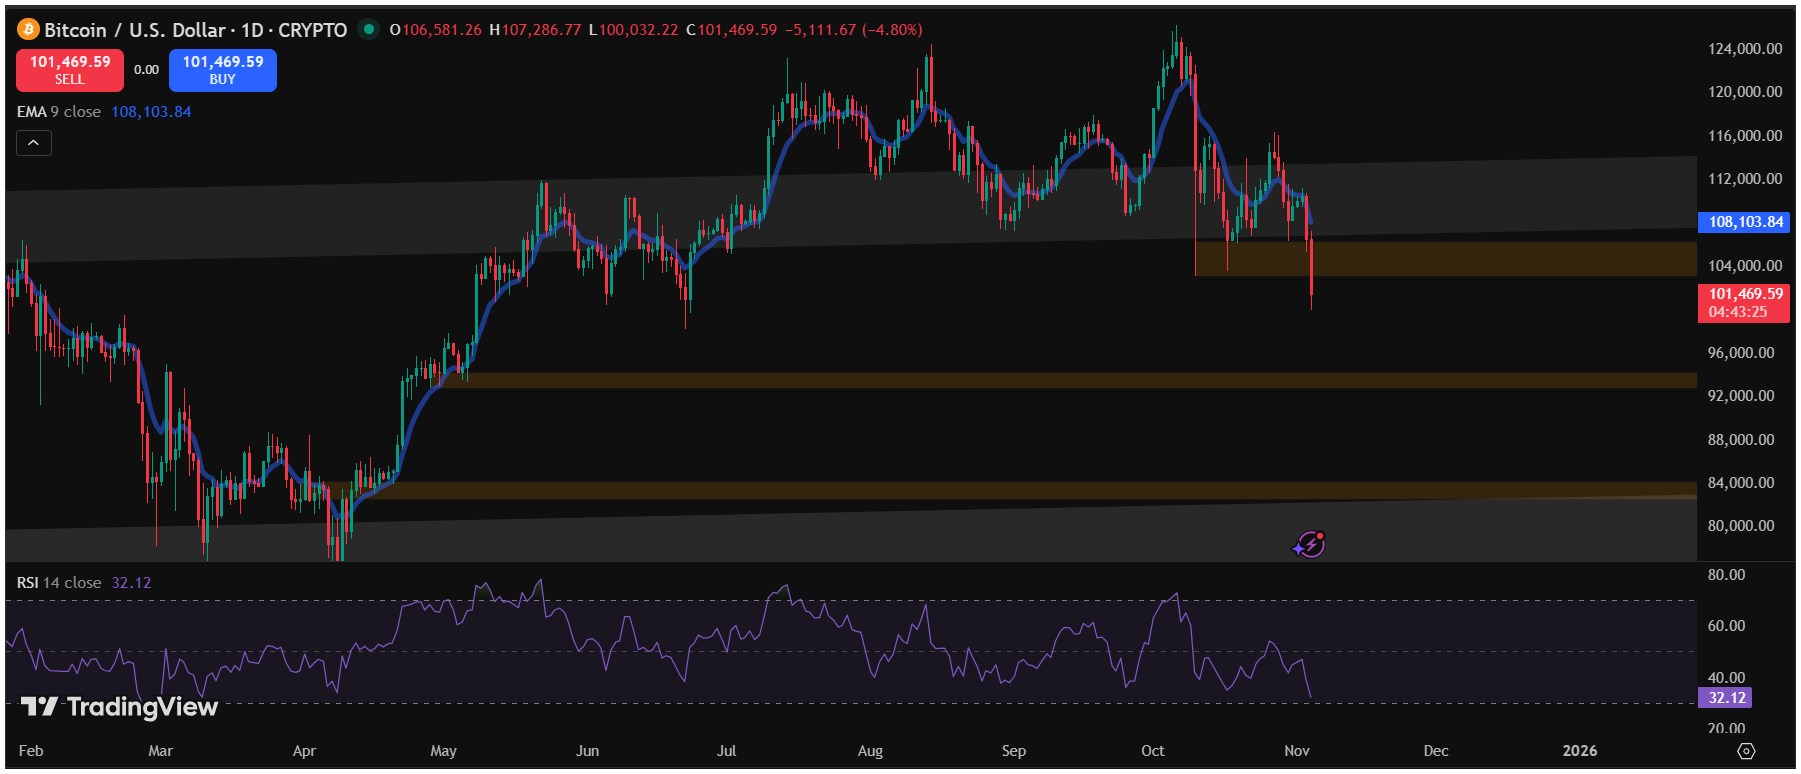
Bitcoin is trading around $100,032 after many months since June 2025. It is currently tumbling from its all-time high. From a peak of roughly $1,260,230, the price has fallen about 20.75% at the time of writing.

Let’s look at five major reasons behind this drop — and what’s really happening beneath the charts and headlines.


1. Institutional Demand Weakening

One strong reason is that big investors and institutions are stepping back. Spot Bitcoin ETFs have recorded significant outflows recently. Sales from such funds mean fewer big-money buyers backing Bitcoin, which takes away a key support.

When the “big guys” reduce exposure, that creates fear among smaller investors and can trigger a cascade of selling.


2. Macro-/Monetary Policy Headwinds

Another major reason is the stance of the central banks and global economic conditions. The Federal Reserve (Fed) signalled that further rate cuts aren’t guaranteed, and the U.S. dollar is firming. That makes risky assets like Bitcoin less attractive.

Also, macro uncertainty – trade tensions, inflation concerns – adds risk-off mood to markets. When people are worried, they shift out of speculative assets.

Also Read – Circle Internet Group Monthly Outlook- November 2025 Technical Analysis


3. Technical Breakdown

On the technical side, Bitcoin is trading well below the 9 EMA across major timeframes like monthly, weekly, and daily – signaling strong bearish momentum. If selling dominance continues, Bitcoin may crash further toward the $84,000–$82,500 zone, which acts as the next major support area. In the short term, support lies around $93,000–$94,000, while resistance levels are seen near $103,000 and $106,000. The RSI on the daily timeframe is around 32, indicating an oversold zone, which aligns with the short-term support area.


4. Profit-Taking After a Big Rally

Bitcoin’s recent run up created a lot of gains for holders. With prices high and some uncertainty creeping in, many of them chose to book profits – that is sell to lock in gains. This sort of behaviour often comes after strong rallies.

When lots of people do this around the same time, it adds to downward pressure.


5. Leveraged Positions & Liquidations

Finally: there were large liquidations of leveraged positions (traders using borrowed money to bet). When price starts dropping and leveraged bets go bust, those forced sells push price down further.

This is like a domino effect: a drop triggers liquidations which trigger more drop.


Conclusion

So in short: Bitcoin’s drop is not due to one factor but a mix of weaker institutional demand, less favourable macro/monetary backdrop, chart breakdowns, profit-taking, and leveraged liquidations.

Also Read – 3 Important Differences Between Cryptography and Blockchain

This article is for informational purposes only and should not be considered financial advice. Investing in stocks, cryptocurrencies, or other assets involves risks, including the potential loss of principal. Always conduct your own research or consult a qualified financial advisor before making investment decisions. The author and publisher are not responsible for any financial losses incurred from actions based on this article. While efforts have been made to ensure accuracy, economic data and market conditions can change rapidly. The author and publisher do not guarantee the completeness or accuracy of the information and are not liable for any errors or omissions. Always verify data with primary sources before making decisions.

6 Reasons Palantir (PLTR) Is Soaring – Technical Analysis for November 2025

PLTR stock chart - daily time frame

Palantir Technologies (ticker: PLTR) has been on a powerful upward run, drawing strong attention from both retail and institutional investors. The stock’s rally isn’t just a product of hype – it’s backed by solid business developments, expanding contracts, and a decisive technical breakout.

Let’s break down the six major reasons why Palantir is soaring in November 2025, with both fundamental and technical insights.


1. Revenue Explosion in U.S. Commercial Business

Palantir’s U.S. commercial segment jumped 121% year-over-year to US$397 million, with a 29% sequential growth. Moreover, the company’s remaining performance obligations (RPO) surged by 66% to US$2.6 billion, signaling a robust pipeline of future revenue.


2. Q2 2025 Revenue Up 48% and Full-Year Outlook Raised

Palantir’s Q2 results stunned the market with 48% year-over-year growth, pushing quarterly revenue past US$1 billion. The company also raised its full-year revenue outlook to US$4.14–4.15 billion, up from the previous guidance of around US$3.91 billion.


3. U.S. Army Enterprise Agreement Worth Up to US$10 Billion

A massive win came when Palantir secured a U.S. Army enterprise contract valued up to US$10 billion over 10 years. This agreement consolidates several previous deals into a single, scalable framework.

4. Strategic Partnership in Nuclear Energy Sector

Palantir recently partnered with The Nuclear Company to develop and deploy NOS, an AI-driven real-time software system designed for nuclear plant construction and operations. The announcement pushed PLTR shares to record highs.


5. NATO Acquisition of Palantir’s Maven Smart System

In a major milestone, NATO acquired Palantir’s Maven Smart System, an advanced AI platform designed for defense intelligence and decision-making. The deal was completed in just six months, which is unusually fast for defense procurement.


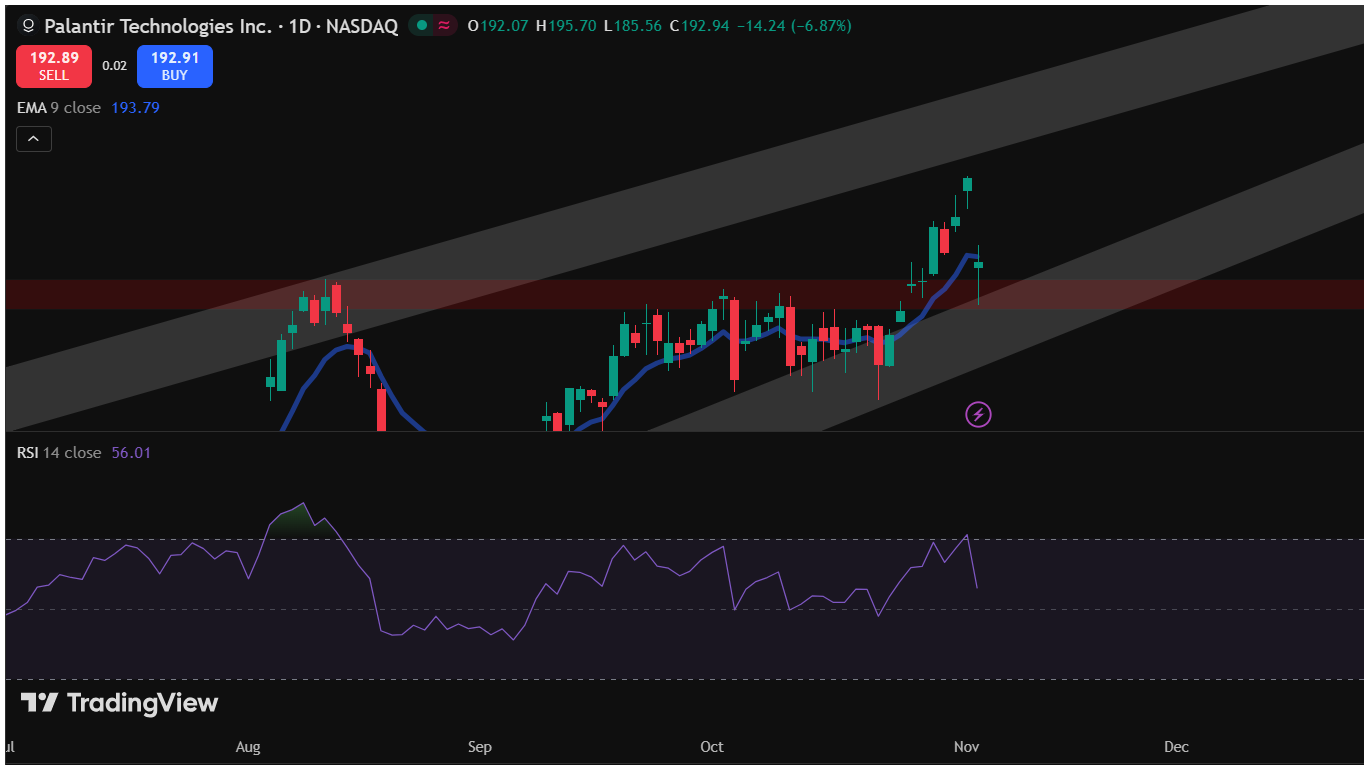
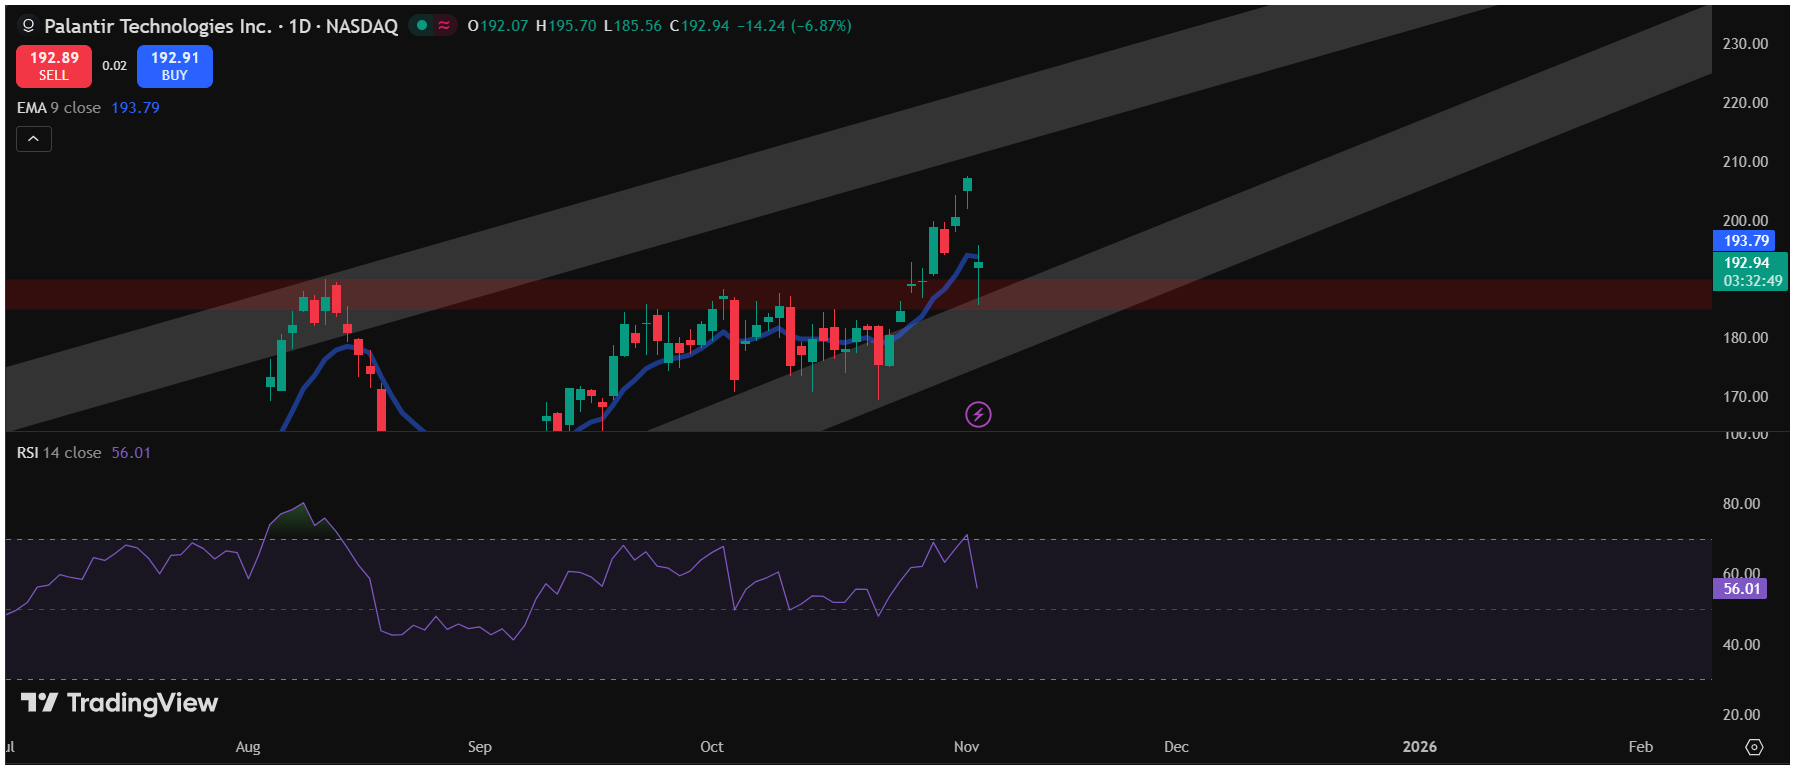
6. Technical Breakout Above the 184–190 Resistance Zone

Beyond the fundamentals, technical indicators confirm bullish momentum. PLTR has broken out above the 184–190 resistance zone, which had previously acted as a strong supply area. Post-breakout, the stock has sustained higher highs and strong volume confirmation, signaling institutional buying.

PLTR - Daily TF

The breakout above the 184–190 range represents a shift from accumulation to expansion.

Also Read – 3 Important Differences Between Cryptography and Blockchain

Technical Analysis for November 2025

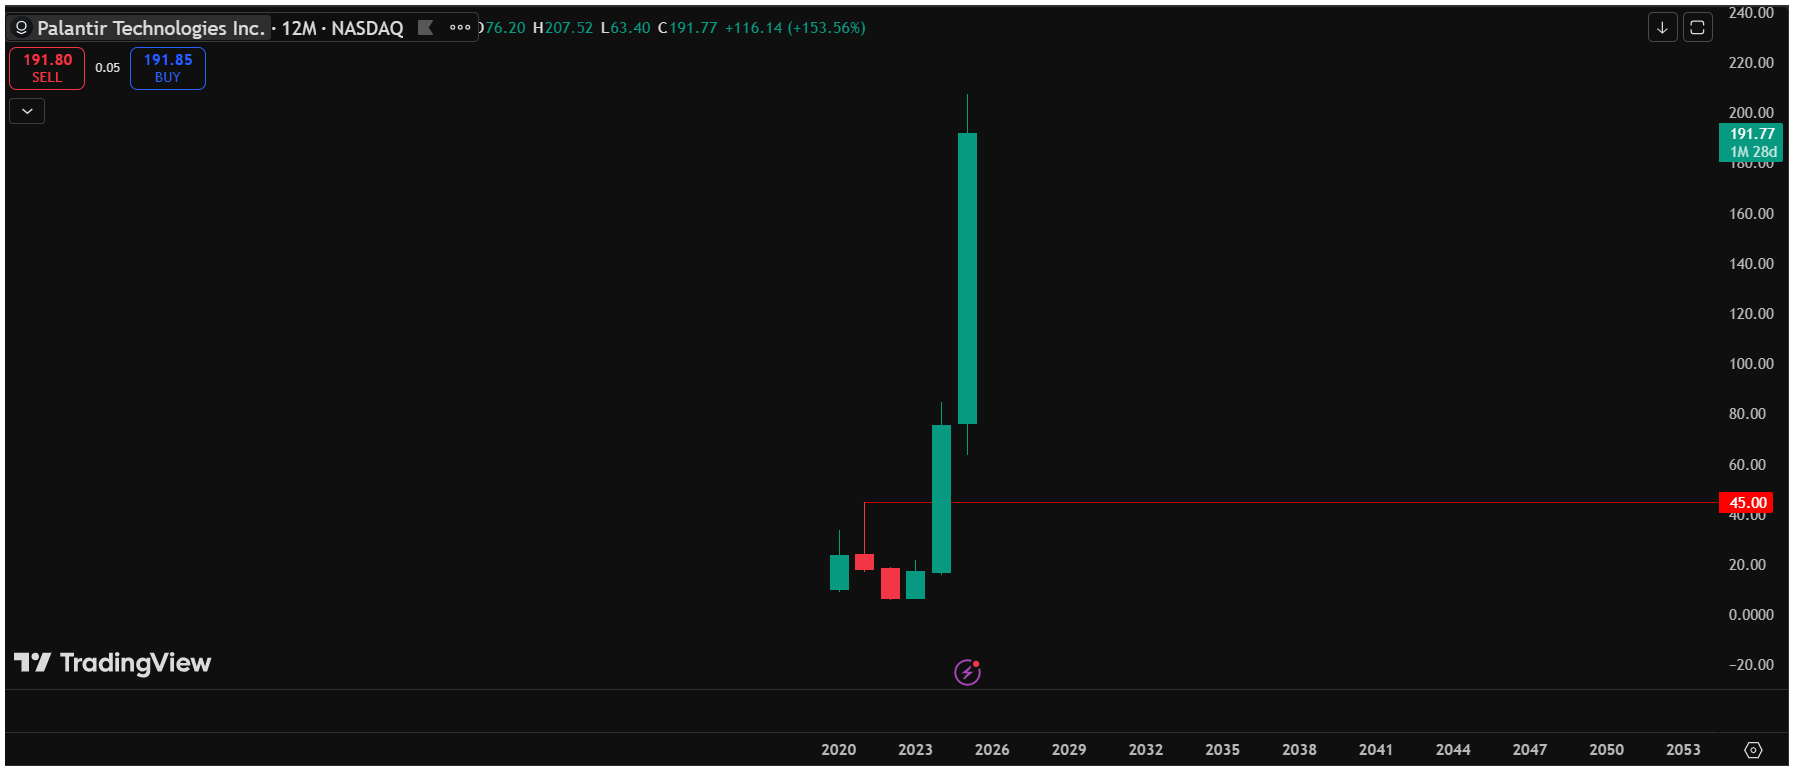
Palantir has been in a strong bull run since 2023, and the long-term chart continues to reflect this steady momentum.

PLTR Yearly Chart

If we analyze the yearly trend, it’s clear that the stock has maintained higher highs and higher lows, supported by sustained institutional demand. However, for the ongoing rally to stay healthy, a retracement may be necessary – allowing bulls to accumulate at more efficient buying zones below current levels.


  • Timeframe: 1 Week (Weekly Candles)

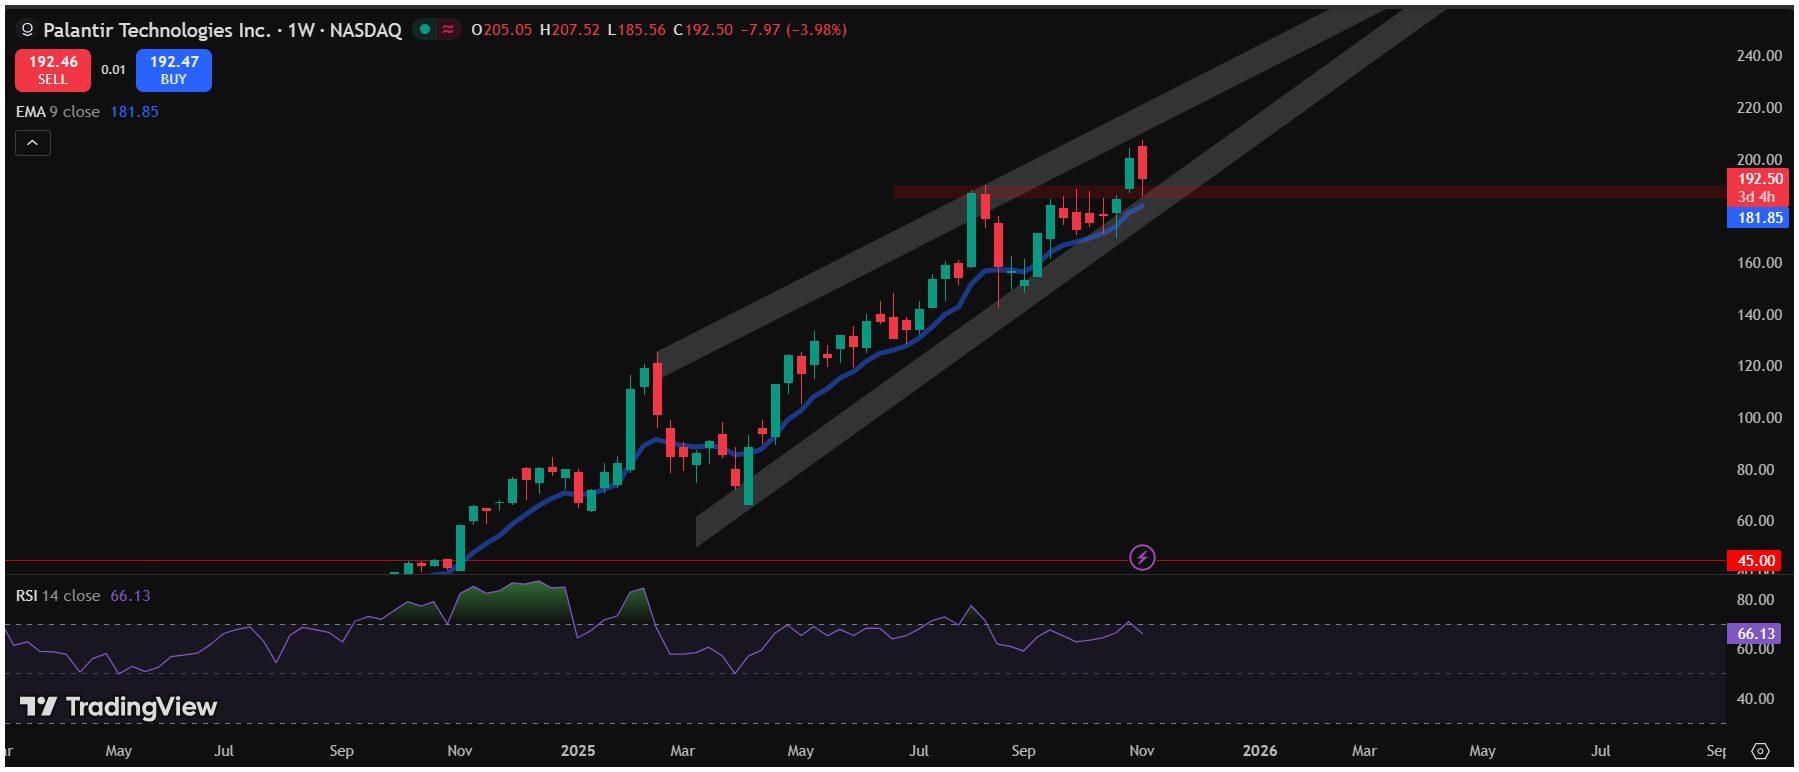
Palantir’s price action shows a clear long-term uptrend within a rising parallel channel. Both the upper and lower boundaries of this channel have been well respected for several months, confirming a disciplined bullish structure.

  • The current weekly candle shows some bearish pressure near the upper boundary, signaling mild profit booking or short-term exhaustion. Despite the pause, the broader trend remains decisively upward.

As of writing, PLTR is trading above the 9 EMA on the weekly timeframe.

In summary, Palantir continues to trade within a structurally bullish channel, but minor corrections are expected as part of normal trend behavior.


Support & Resistance Levels

Level TypeZone (USD)Technical Context
Immediate Resistance$205–$210Upper trendline + recent rejection zone
Immediate Support$180–$185Midline support + EMA confluence
Major Channel Support$160–$165Lower channel trendline (long-term support)

These levels indicate that any retracement toward $180–$185 could present a high-probability accumulation area, as it aligns with both the mid-channel and the dynamic EMA zone.

A weekly close below the EMA could trigger a short-term correction, possibly toward the midline of the channel around $180.

Also Read – Circle Internet Group Monthly Outlook- November 2025 Technical Analysis

This article is for informational purposes only and should not be considered financial advice. Investing in stocks, cryptocurrencies, or other assets involves risks, including the potential loss of principal. Always conduct your own research or consult a qualified financial advisor before making investment decisions. The author and publisher are not responsible for any financial losses incurred from actions based on this article. While efforts have been made to ensure accuracy, economic data and market conditions can change rapidly. The author and publisher do not guarantee the completeness or accuracy of the information and are not liable for any errors or omissions. Always verify data with primary sources before making decisions.

Top 10 Circle / USDC News Stories for November 2025

As November 2025 kicks in, the stablecoin space is heating up with big moves and regulatory shifts. At the centre is Circle, issuer of USDC, making strong plays in transparency, cross-border payments, and adoption of stablecoins in mainstream finance.

Also Read – Circle Internet Group Monthly Outlook- November 2025 Technical Analysis

Here are the ten top stories so far, from newest to oldest, summarised for you.


1. Circle Eyes EU MiCA Compliance Boost with New Reserve Disclosures

Circle announced enhanced transparency for its USDC reserves in light of the incoming Markets in Crypto-Assets (MiCA) regulations in Europe. The firm said over 99% of USDC is backed by short-term U.S. Treasuries and cash equivalents. A new dashboard will provide real-time attestations of the reserves. The move follows increased scrutiny from European regulators and is aimed at easing USDC’s broader use on European DeFi platforms.

Also Read – Important Facts to Know About USDC in 2025


2. USDC Surpasses $35 Billion in Circulation Amid BlackRock ETF Speculation

Circle reported that USDC’s total supply has reached a record $35.2 billion, driven by institutional inflows tied to rumours of a BlackRock-backed USDC ETF.

Analysts say the surge reflects growing confidence in stablecoins as a bridge between traditional finance and crypto. Circle’s CEO, Jeremy Allaire, hinted at “exciting collaborations” in a social audio session. Trading volumes on major exchanges spiked by about 15% overnight.


3. Circle Partners with Visa for Cross-Border USDC Remittances in Asia

In a landmark collaboration, Circle announced a deal with Visa to enable cross-border remittances using USDC in Southeast Asia. The integration aims to simplify instant, low-cost transfers via Visa’s global network, targeting the approx. $700 billion regional remittance market.

Pilot programs in the Philippines and Indonesia have already processed over $10 million in transactions. Circle emphasised that blockchain rails give cost and speed advantages over traditional systems.


4. Regulatory Green Light: Circle Secures Full U.S. Banking Charter Push

At the beginning of November, Circle submitted formal applications for a national trust bank charter under the Office of the Comptroller of the Currency (OCC) in the U.S. The move signals its ambition to operate as a full-fledged bank – which would significantly enhance USDC’s utility in payments and custody.

Regulatory insiders predict approval could come by Q1 2026, and this could accelerate USDC’s integration into mainstream payment infrastructure.


5. USDC Yield Program Launches with 5% APY for Institutional Holders

Though announced at the end of October, the impact carried strongly into November. Circle launched a yield-bearing USDC variant offering 5% APR (backed by Treasury yields) for institutional holders. Over $2 billion in assets were reported to have shifted within the first 24 hours.

DeFi protocols such as Aave quickly integrated the new variant, boosting total value locked across chains. The move drew comparisons with rival stablecoins but emphasised Circle’s transparency & regulatory posture.


6. Circle Acquires Stake in Solana-Based Stablecoin Competitor

Circle quietly took a minority stake (~$50 million) in a Solana-native stablecoin project, aimed at expanding USDC’s multi-chain presence and countering Ethereum’s dominance. Early testnet builds launched in November, with full mainnet support expected mid-month. The strategy reflects Circle’s multi-chain ambition and desire to secure compatibility across evolving blockchain ecosystems.


7. USDC Integrates with Apple Pay for Seamless Crypto On-Ramps

Circle rolled out USDC top-ups via Apple Pay in the U.S. and EU, making stablecoin entry as easy as digital wallet reloads. According to Circle metrics, over 100,000 new users were onboarded via this channel. Privacy advocates raised questions about KYC implications, but the convenience boost appears strong. The rollout carried into early November and is expected to expand further.


8. Market Jitters: USDC Holds Steady During Bitcoin Dip

Amid an 8% drop in Bitcoin last week, USDC proved its stability by maintaining its peg with zero de-peg events. Circle published a stress-test report attributing the steady peg to diversified reserves.

Traders moved into USDC pairs for safety, pushing daily volumes past $20 billion – a trend that has exhibited carryover strength into November.


9. Circle Ventures Invests $100M in Web3 Payments Startups

Circle’s VC arm announced a $100 million injection into five early-stage firms building USDC-native payment and treasury solutions. Featured projects include a blockchain invoicing platform for SMEs and a privacy-focused mixer.

These investments underline Circle’s long-term vision for USDC to power broader “internet finance” infrastructure. Portfolio companies are set to demo at November’s crypto dev conference in Bangkok.


10. Global Expansion: USDC Goes Live on TON Blockchain

Closing the pre-November slate, Circle announced that USDC is now live on the TON (The Open Network), the blockchain tied to Telegram. The integration unlocks access to ~900 million users within the TON ecosystem. Initial transfers reached about 500,000 within hours. Circle highlighted sub-second settlement speeds. Early November metrics show about 20% month-on-month growth in USDC flows on TON.

Also Read – The Very First Post You Should Read to Learn Cryptocurrency


What It All Means

Together these developments show that Circle is doubling down on three big pillars:

  1. Transparency & Regulation: With reserve disclosures, bank charter moves and multi-chain rollout, Circle is putting regulatory compliance front-and-centre.
  2. Adoption & Payments: From Visa remittances to Apple Pay on-ramps and blockchain expansions, USDC is increasingly positioned as a global payments rail, not just a trading asset.
  3. Ecosystem & Infrastructure: Investments in Web3 payments, multi-chain support and strategic stakes in other stablecoin rails illustrate Circle’s drive to build an infrastructure platform around USDC, not merely issue a coin.

For industry watchers this means we may be entering a phase where stablecoins move from speculative crypto-assets into backbone infrastructure of global finance. That shift brings opportunities but also regulatory and operational risks: reserve mismanagement, regulatory clamp-downs or interoperability failures remain potential flashpoints.


Outlook for the Rest of November

With this momentum, keep an eye on:

  • Whether the bank charter application is approved and how quickly Circle acts on it.
  • Institutional product launches (like an ETF or large-scale treasury use of USDC).
  • New cross-border payment flows especially in Asia/Africa.
  • Reserve disclosures and audit results in light of increasing regulatory focus on stablecoins.
  • Any peg stress events or large-scale redemptions which could test USDC’s stability further.

This article is for informational purposes only and should not be considered financial advice. Investing in stocks, cryptocurrencies, or other assets involves risks, including the potential loss of principal. Always conduct your own research or consult a qualified financial advisor before making investment decisions. The author and publisher are not responsible for any financial losses incurred from actions based on this article. While efforts have been made to ensure accuracy, economic data and market conditions can change rapidly. The author and publisher do not guarantee the completeness or accuracy of the information and are not liable for any errors or omissions. Always verify data with primary sources before making decisions.

How the Lenskart IPO Is Testing Investors’ Logic? – A $8 Billion Tag on Thin Profits?

lenskart ipo - profit logic

The Indian eyewear brand Lenskart is about to go public and many people online are raising their eyebrows. The company has fixed its IPO price band between ₹382 and ₹402 per share and is targeting a valuation of around ₹69,000-₹70,000 crore (about US $7.9 billion). Netizens are shocked because the valuation works out to over 230–240 times its earnings (P/E) for FY25.

To simplify, investors would be paying ₹235 for every ₹1 the company earned in profit last year. For perspective, that’s the kind of multiple you expect from a fast-scaling tech disruptor, not a retail eyewear brand.

So the big question is – is this huge price tag really justified, or are we seeing a hype-driven listing?

While the majority of Lenskart’s business still comes from India, the company has made a strategic push into the United States. It currently operates physical stores in California, Texas, New York, and New Jersey, with more outlets planned for Chicago, Florida, and the East Coast.

The idea is to attract young working professionals who want fashionable eyewear at accessible prices—an approach that mirrors Warby Parker’s model, but with an Indian supply chain advantage. Lenskart’s early U.S. performance has been modest -it’s building brand awareness and customer trust, not chasing short-term profits. In other words, it’s laying the foundation rather than generating strong financial returns yet.

The Reality Behind FY25 Profits

Lenskart reported a net profit of ₹297 crore in FY25, marking its first profitable year. But that number needs context – it’s not entirely from regular business activities.

Non-Cash Gains Skew the Numbers

Out of the ₹297 crore profit, ₹167.2 crore came from a non-cash gain related to its Owndays acquisition. This gain was a paper adjustment arising from the revaluation of assets after acquiring Owndays. It didn’t come from actual eyewear sales or operations. These kinds of gains can make the income statement look stronger than the underlying business really is.

When you exclude this one-time item, Lenskart’s normalized profit falls to ₹130.1 crore, leaving a thin 1.96% net margin, compared to the reported 4.24%. This means that the bulk of the company’s profits in FY25 were accounting-based, not operational. The timing of such adjustments helped Lenskart report a profit on paper, but they don’t reflect sustainable earnings power.

What Happens If We Only Count Operational Profits?

If investors value Lenskart solely on its operational profit of ₹130.1 crore, the price-to-earnings (P/E) ratio shoots up dramatically – well beyond 500×.

In simpler terms, investors would be paying more than ₹500 for every ₹1 the company actually earns from its core business. That’s an extremely steep multiple even by global growth standards, especially for a retail business with low margins and high competition.

Also Read – Circle Internet Group Monthly Outlook- November 2025 Technical Analysis


The Valuation Debate – Paying for “Vision,” Not Value

At a P/E of 235×, Lenskart’s valuation already looks high. But if you only count the normalized profits (excluding accounting gains), the effective P/E skyrockets. This suggests investors are not buying into current performance – they’re paying for the promise of what Lenskart might achieve in the future.

Adding to the concern is the IPO structure itself. Most of the issue is an Offer for Sale (OFS), where existing investors and promoters will sell their shares. That means the company isn’t raising new capital—it’s more of an exit opportunity for early backers at inflated prices.

For U.S. investors familiar with listings like Warby Parker, Allbirds, or even Peloton, this might feel like déjà vu: strong branding, huge ambitions, but weak fundamentals.


The Indian Parallel: Paytm, Nykaa, and Zomato

We’ve seen this play out before in India. IPOs like Paytm, Nykaa, and Zomato all debuted with massive hype and aggressive valuations. But soon after listing, reality set in – their share prices fell sharply once investors realized earnings didn’t match the lofty promises.

Lenskart’s IPO appears to echo that same storyline. It’s a consumer brand with undeniable potential, yet its financials don’t justify the steep valuation it’s seeking. The big question isn’t whether Lenskart has vision – it’s whether that vision is profitable.

Grey Market Premium

According to a recent report by The Economic Times, Lenskart’s IPO is drawing strong interest in the unlisted market. On Day 2, the issue was subscribed 2×, signaling healthy investor appetite. The company’s shares were last quoted with a grey market premium (GMP) of ₹85, suggesting that investors expect a solid debut.

Based on the upper price band of ₹402, this GMP translates to an estimated listing price of around ₹487 per share – an expected gain of roughly 21.14%.

In simple terms, early investors in the grey market are betting that Lenskart will list at a premium despite valuation concerns. However, such optimism could be short-lived if post-listing numbers fail to justify the high price.

This article is for informational purposes only and should not be considered financial advice. Investing in stocks, cryptocurrencies, or other assets involves risks, including the potential loss of principal. Always conduct your own research or consult a qualified financial advisor before making investment decisions. The author and publisher are not responsible for any financial losses incurred from actions based on this article. While efforts have been made to ensure accuracy, economic data and market conditions can change rapidly. The author and publisher do not guarantee the completeness or accuracy of the information and are not liable for any errors or omissions. Always verify data with primary sources before making decisions.

Tesla Monthly Outlook – November 2025 | Technical Analysis, Forecast & Price Prediction

 IMAC Holdings issues secured $210,000 promissory note for $150,000 purchase as part of short‑term financing arrangement.

Tesla Inc. has been one of the most closely watched stocks this year, and November 2025 brings a new wave of technical activity as the stock continues to trade near the upper end of its range.

In this monthly analysis, we’ll explore Tesla’s current chart setup, key technical levels, market sentiment, and the potential forecast for the coming weeks.


Major News & Events Impacting Price

Tesla’s stock performance in recent months has been shaped by several notable developments. The company’s Q3 earnings beat market expectations on margins, though production figures hinted at a temporary slowdown due to ongoing factory upgrades. EV sector sentiment remains upbeat, supported by growing global demand for electric vehicles and regulatory incentives in major markets.

Additionally, Tesla’s expanding presence in AI-driven autonomous systems has attracted strong investor attention, while the broader tech sector’s rebound has lifted sentiment across growth names. A series of positive reports on Tesla’s energy storage business and new charging infrastructure partnerships have also provided medium-term optimism.

However, increased competition from Chinese EV makers and potential U.S. trade restrictions on battery components have created short-term uncertainty. Overall, these mixed developments have made Tesla’s chart behavior highly sensitive to investor mood shifts.


Fundamental Snapshot

MetricValue
EPS (TTM)4.86
Market Cap$1.45 Trillion
P/E Ratio82.5
Trailing P/E83.2
Forward P/E59.7
Outstanding Shares3.19 Billion
Stock Implied Volatility47.8%

Tesla continues to maintain premium valuations relative to its peers, reflecting high growth expectations from investors. Its forward P/E ratio has moderated compared to the trailing metric, signaling potential earnings expansion in upcoming quarters.


Technical Overview

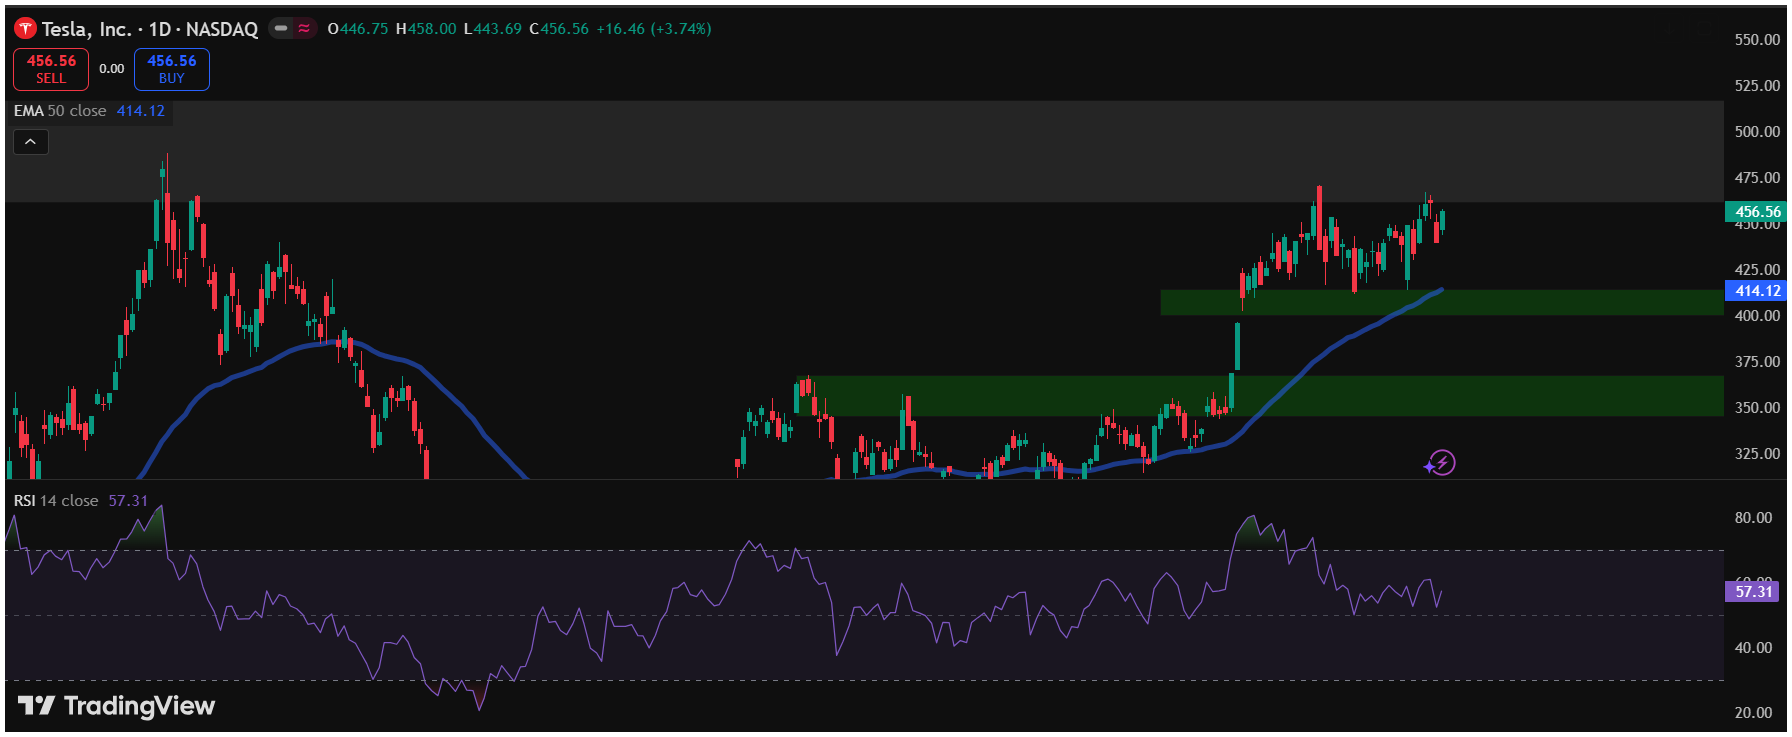
Tesla’s stock is currently trading in a range between $461 and $488, where it faces immediate resistance near the $488 level and visible support around $414–$400. The 50-day EMA stands at $414, while the 200-day EMA sits much lower at $349.21, reflecting a strong bullish structure but with rising chances of a pullback.

On the weekly timeframe, RSI reading of 69.03 suggests that Tesla is nearing overbought territory, hinting at a potential pause or short-term retracement.

The candlestick setup indicates that the price might correct toward the $361 zone, aligning with the monthly 9 EMA, which could serve as a strong dynamic support zone.

Currently, in the daily chart, Tesla is hovering near the highs of its existing range. This signals exhaustion in near-term momentum, and traders may await a healthy retracement before expecting a renewed breakout attempt.

Also Read – Amazon post-earnings technical analysis – November 2025 review and what comes next


Price Forecast & Target

From a price action perspective, Tesla could see a retracement toward $345–$367 in the short term before resuming its next leg higher. This potential dip may serve as a re-accumulation phase, allowing larger market participants to enter at more favorable levels.

If the stock sustains above $414–$420, the broader outlook remains bullish with possible upside targets near $515–$530 by mid-December.

Conversely, a breakdown below $400 could expose it to a deeper test toward the $349–$361 support region.

This analysis reflects a technical forecast rather than a trading recommendation.


Market & Investor Sentiment

Investor sentiment around Tesla remains strong despite overextended technical readings. Social media discussions on Reddit and X continue to reflect optimism about Tesla’s long-term leadership in EV and AI segments.

Institutional investors, too, have shown steady interest, though many appear to be waiting for lower entries after recent rallies.

Analyst commentary from major banks like JPMorgan and Goldman Sachs remains mixed – with neutral short-term ratings but a bullish tilt for the next 12–18 months.

Also Read – Circle Internet Group Monthly Outlook- November 2025 Technical Analysis


Long-Term Outlook

In the long-term view, Tesla’s chart structure and expanding market presence indicate sustained bullish bias. The company’s innovation edge, expanding energy division, and dominance in autonomous technology continue to support a strong multi-year narrative.

However, the near-term volatility and high valuation levels suggest that investors should anticipate periodic corrections. Such retracements are likely part of Tesla’s natural price discovery process and could provide more favorable accumulation zones for patient long-term investors.

This article is for informational purposes only and should not be considered financial advice. Investing in stocks, cryptocurrencies, or other assets involves risks, including the potential loss of principal. Always conduct your own research or consult a qualified financial advisor before making investment decisions. The author and publisher are not responsible for any financial losses incurred from actions based on this article. While efforts have been made to ensure accuracy, economic data and market conditions can change rapidly. The author and publisher do not guarantee the completeness or accuracy of the information and are not liable for any errors or omissions. Always verify data with primary sources before making decisions.

Circle Internet Group Monthly Outlook- November 2025 Technical Analysis

CRCL's technical analysis

Circle Internet Group has remained one of the most closely watched stocks in the fintech and crypto-related segment since its much-anticipated listing. As the issuer of the USDC stablecoin, Circle sits at the intersection of blockchain finance and traditional markets. November 2025 brings a mix of consolidation and uncertainty, making this month’s technical analysis crucial for investors and traders.

Also Read – USDC vs. RLUSD vs. USDT – Key Differences and Why They Matter

Company Overview

Circle Internet Group operates as a blockchain-based financial technology company known primarily for issuing the USD Coin (USDC), a widely used stablecoin pegged to the US dollar. The company’s business model revolves around reserve management, transaction services, and infrastructure for digital payments. It has grown rapidly alongside the crypto sector’s expansion, though it remains heavily influenced by regulatory shifts and macroeconomic conditions.

As of the latest data, Circle holds a market capitalization of around 30 billion dollars with revenue nearing 2 billion dollars in trailing twelve months. The company is not yet profitable, but its strategic position in digital finance continues to attract significant institutional and retail attention.

Technical Overview and Price Action

The stock has shown considerable volatility since its IPO, trading within wide ranges that attract both short-term traders and long-term investors.

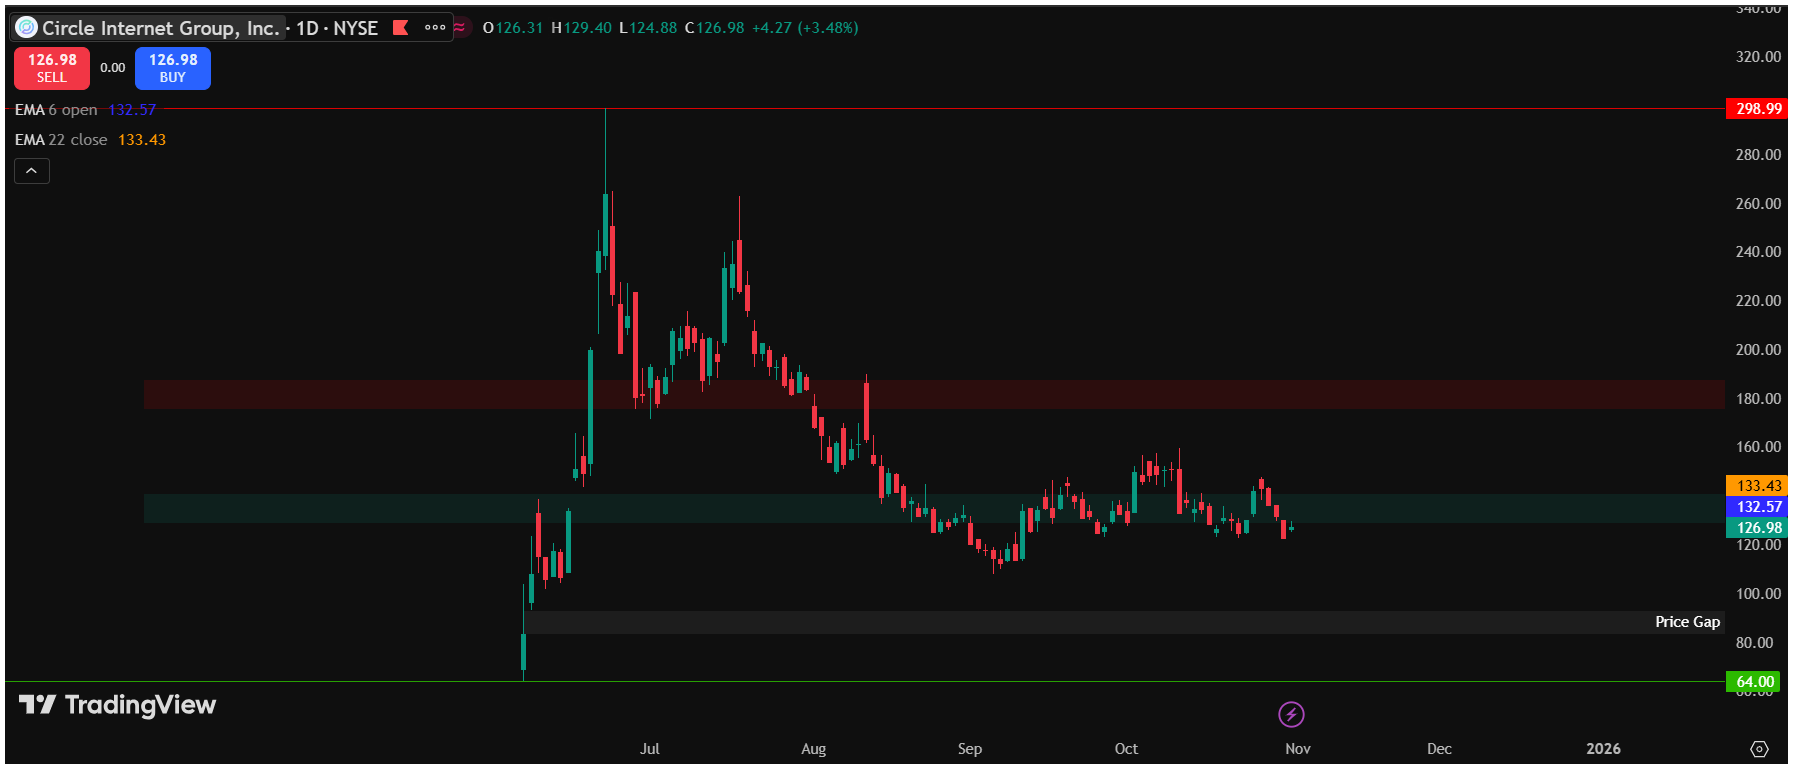
During October 2025, Circle’s price hovered between 128 and 140 dollars, signaling indecision among market participants. The candlestick structure on the monthly chart reflects a balanced sentiment, creating a 50-50 situation for the near term.

There is a visible price gap between 92.95 and 83.23 dollars, which may act as a strong support zone on the downside. Historically, such gaps tend to attract price action either for a retest or to form a base for recovery. While the current structure remains ambiguous, the broader overview suggests that the price could see an upward move after either touching the gap zone or consolidating above the current range.

If the price sustains above 135 dollars for an extended period, the next target could extend toward 175 dollars, which stands as a major resistance zone. Failure to hold above 135 could result in the price revisiting lower support areas, including the gap region.

The Relative Strength Index (RSI) [44.93] and volume patterns indicate moderate momentum without clear dominance from either bulls or bears.

Also Read – Amazon post-earnings technical analysis – November 2025 review and what comes next

Major News & Events Impacting Price

Over the past few months, several key developments have influenced Circle Internet Group’s stock performance and investor sentiment heading into November 2025.

Sector Momentum: Overall blockchain and fintech sentiment has improved due to regulatory advancements, supporting Circle’s long-term positioning.

Stablecoin Regulation Progress: The U.S. Senate continued discussions on the long-awaited stablecoin bill, which directly affects Circle’s core business model. This legislative clarity has kept investors optimistic about USDC’s long-term adoption.

Institutional Expansion: Circle announced new partnerships with several financial institutions, expanding its presence in cross-border settlement and digital payments infrastructure.

Earnings Update: The company’s last quarterly results showed consistent revenue growth, though profitability remains elusive. Revenue from interest earned on USDC reserves continues to play a significant role.

Market Volatility in Crypto Sector: Broader crypto market swings during October have influenced sentiment toward Circle, as USDC circulation volume often mirrors overall crypto activity.

Rising Competition: New entrants in the stablecoin and blockchain payments segment have intensified competition, slightly weighing on short-term investor sentiment.

Institutional Accumulation Signals: Several market trackers have indicated potential accumulation by large funds, suggesting growing long-term confidence in the stock.

Macroeconomic Conditions: Falling U.S. interest rates have mixed implications for Circle – beneficial for liquidity but potentially reducing its interest income from reserves.

Investor Coverage Initiation: Multiple investment banks began coverage on Circle, with mixed ratings ranging from “Hold” to “Outperform,” reflecting both opportunity and risk.

Integration with Payment Networks: Circle’s progress in integrating USDC payments with mainstream payment rails has been viewed as a positive development.

Also Read – I Created the Best Bitcoin Guide You’ll Ever Read

Market Sentiment and Investor View

Sentiment around Circle remains divided. On one hand, short-term traders see opportunity in volatility; on the other, long-term investors continue to show confidence in Circle’s future due to its strong market position in stablecoin issuance. The recent regulatory clarity around digital assets has helped improve the medium-term outlook, although macroeconomic uncertainty still influences investor confidence.

From an investor’s perspective, Circle remains bullish in the long term. The company’s ecosystem growth and partnerships within blockchain finance are viewed positively. However, this optimism must be balanced with caution, as technical indicators show possible pullbacks before any strong breakout. The current phase could also represent a period of accumulation where larger investors, or what traders call “big bulls,” might be seeking discounted entry levels before a potential next leg upward.

This article is for informational purposes only and should not be considered financial advice. Investing in stocks, cryptocurrencies, or other assets involves risks, including the potential loss of principal. Always conduct your own research or consult a qualified financial advisor before making investment decisions. The author and publisher are not responsible for any financial losses incurred from actions based on this article. While efforts have been made to ensure accuracy, economic data and market conditions can change rapidly. The author and publisher do not guarantee the completeness or accuracy of the information and are not liable for any errors or omissions. Always verify data with primary sources before making decisions.

Amazon post-earnings technical analysis – November 2025 review and what comes next

Balkrishna Industries Limited – stock latest audited financial results news

Amazon (NASDAQ: AMZN) reported third-quarter results for the period ended September 30, 2025. Revenue came in at $180.2 billion, up about 13% year-over-year, and EPS was $1.95, comfortably above expectations. The quarter was driven by a strong Amazon Web Services showing with roughly 20% year-over-year growth.

The market cheered the print and Amazon stock opened with a big gap higher, rising roughly 12–13% on the earnings reaction.


1. Introduction & company snapshot

Company profile. Amazon is a global e-commerce and cloud computing company. Its core businesses are online retail, third-party marketplace services, subscription services (Prime), digital advertising, and Amazon Web Services (AWS), the company’s cloud platform. Amazon operates across consumer retail, cloud, digital media, logistics, and advertising.

Primary sector: Technology / Consumer Discretionary with large exposure to cloud computing and digital advertising.

Recent performance (context). Over the last quarter Amazon lagged some peers but showed accelerating cloud growth in this report. The earnings beat and strong AWS growth produced the sharp post-earnings gap up of about 12–13% which pushed the stock to fresh highs. That gap is the immediate context for the technical read below.

Latest news highlights (top items).

  • Q3 revenue $180.2B and EPS $1.95.
  • AWS grew about 20% year over year.
  • Company signaled materially higher capital expenditures tied to AI and data center expansion.
  • Amazon disclosed workforce reductions of about 14,000 corporate roles as part of cost actions.
  • Management gave a Q4 revenue guide range that investors will monitor for sustainability of the momentum.

Analyst sentiment- The immediate analyst reaction was broadly positive. Several firms raised estimates and price targets after the AWS beat and the AI investment signal. That shift is one reason the market moved aggressively higher. Specific recent price target moves differ by firm so check the broker notes you follow for exact numbers.


2. Fundamental analysis – company financial health

Key financials (Q3 2025).

  • Revenue: $180.2 billion.
  • EPS: $1.95.
  • AWS contribution: fastest cloud growth since 2022 at about 20% y/y.

Valuation notes. Amazon’s market cap expanded meaningfully on the rally. With an earnings beat and higher profitability this quarter the trailing and forward P/E will change quickly as analyst estimates update. For actionable valuation comparisons use the latest consensus EPS and shares outstanding from the IR site or your data provider.

Special holdings. Not applicable in the sense of material crypto treasuries. Amazon’s earnings are driven by its operating businesses and investment gains including some non-operating gains disclosed in the release.


3. Technical analysis – what the charts are saying

Below I fold your technical observations into a structured TA narrative with cleaned grammar and clarity.

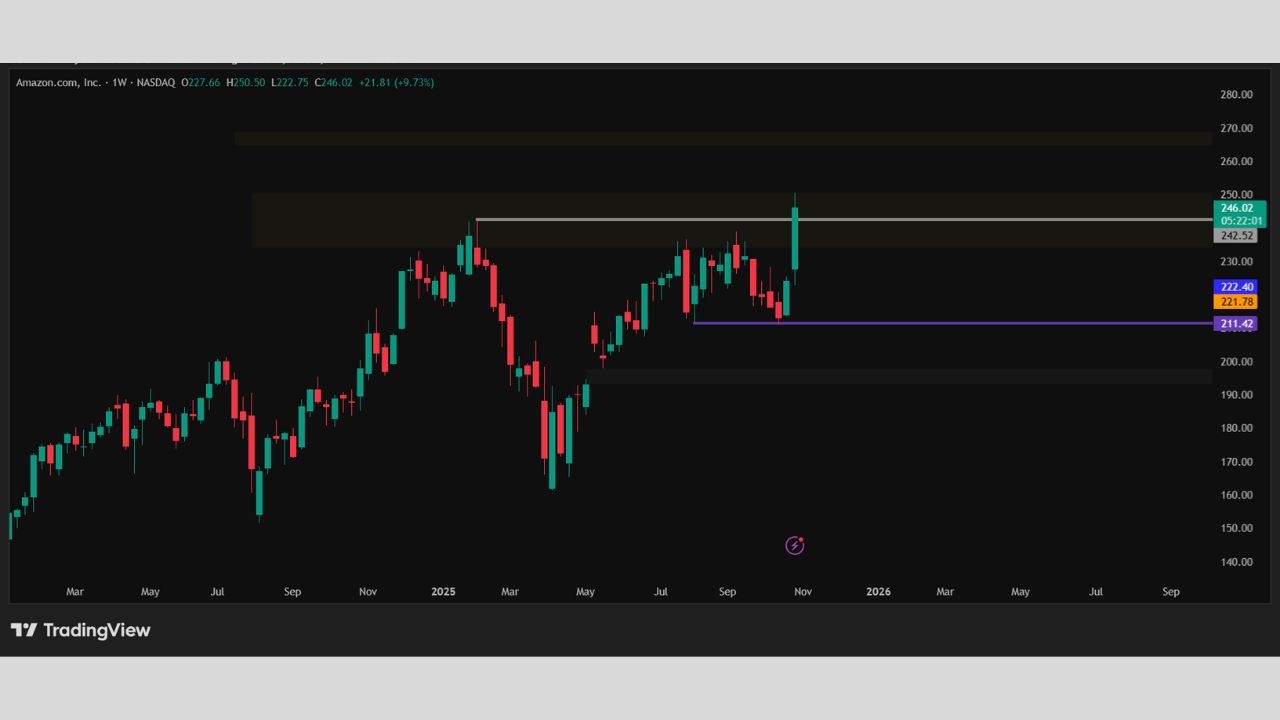
Monthly trend (big picture). The monthly chart shows a strong uptrend that accelerated after this earnings beat and gap higher. The new all-time highs mean prior resistance levels are now the reference for support on any retracement. The long term trend is bullish while also structurally vulnerable to sharp mean reversion because large gaps and vertical moves often attract profit taking.

Short term (daily / weekly). The weekly RSI is 64.84, which is below the overbought threshold but indicates firm bullish momentum. Weekly momentum is positive. The daily action after the gap shows a rapid run higher with thin consolidation. That type of move often creates “retail froth” near the highs which can fail without a healthy pullback.

Key levels to watch

  • Immediate resistance: 264–268. This is the near term supply zone to watch on any rally.
  • Gap zone: 193–197. Gaps often act as magnets and support or resistance. The 193–197 gap is a logical area where price may revisit.
  • Support band: 170–178 is identified as strong support.
  • Retracement target range you proposed: 206–189 as the zone where the price may retrace to allow “big bulls” to build positions at more efficient prices.

These levels create a short term map: if price holds above the 193–197 gap and reclaims 206 quickly then bullish momentum can resume. If the gap fills and 170–178 remains intact then the long term uptrend stays valid. If 170 breaks then the risk profile shifts materially.

50 EMA / 200 EMA relationship. After a gap that takes price to new highs the 50 EMA will trail above the 200 EMA and remain bullish until a crossing occurs. Monitor any acceleration of moving averages as a confirmation or a warning sign.

Volume. The earnings session saw high volume and conviction. Future volume on pullbacks will tell whether the move is a healthy consolidation or a distribution. Higher volume on down moves would warn that the run may be topping.

Chart patterns. The rapid breakout to ATH with little resistance suggests a spike top risk and a higher probability of at least a moderate retracement. Look for reversal candlestick patterns and increased selling volume near resistance to signal weakness.

Also Read – Fed Interest Rates vs Gold Prices


4. Market sentiment & volatility

Social media and retail sentiment. After the beat social chatter turned exuberant on X and Reddit. That elevated retail enthusiasm increases the chance of a short term pullback as newer buyers chase the move.

Investor sentiment & macro. The broader market is sensitive to AI and cloud narratives. Positive AI signals and durable cloud growth create a favorable macro tailwind for Amazon relative to broader cyclicals.

Implied volatility. IV spiked into earnings and usually declines afterward. Elevated option IV means the market expects bigger moves in the near term. Traders using options should account for premium decay if IV compresses from here.


5. Forecast & conclusion – September outlook and trade-map

Probabilities and scenario framing.

  • Base case (highest probability given current structure). A pullback into the 206–189 zone to clear retail froth and let institutional buyers scale in.
  • Bull case. Price holds above the 193–197 gap and reclaims 264–268 resistance. Continued AWS strength and positive guidance push price higher.
  • Bear case. The gap fills and price breaks 170–178 support. That would invalidate the near term bullish thesis and open larger downside.

Targets and watchlist. Use the support and resistance zones above as intra-month targets. Watch volume and day-session price action immediately after the gap. Pay attention to management language on capex and AI. Continued robust AWS updates are the single largest fundamental tailwind for a sustained rally.

Final verdict for September. Given the sharp gap up and the retail froth around the highs it is reasonable to expect a retracement into the 206–189 zone in November before the bulls can establish a stronger and more sustainable base. This is a probability view not a certainty.


This analysis is for educational purposes only. It is not investment advice. We do not provide buy or sell recommendations. The analysis may be incorrect. Always do your own due diligence and consult a licensed financial professional before acting.


This article is for informational purposes only and should not be considered financial advice. Investing in stocks, cryptocurrencies, or other assets involves risks, including the potential loss of principal. Always conduct your own research or consult a qualified financial advisor before making investment decisions. The author and publisher are not responsible for any financial losses incurred from actions based on this article. While efforts have been made to ensure accuracy, economic data and market conditions can change rapidly. The author and publisher do not guarantee the completeness or accuracy of the information and are not liable for any errors or omissions. Always verify data with primary sources before making decisions.

At What Time Will the Fed Release Its Decision on Interest Rates?

The Federal Reserve (Fed) meeting decision is coming today, Wednesday, October 29, 2025.

The most anticipated moment for global markets is here. The U.S. Federal Reserve (Fed) will soon release its latest decision on interest rates, concluding its two-day Federal Open Market Committee (FOMC) meeting.

Traders, investors, and economists around the world are on edge, as this announcement will set the tone for the next phase of global monetary policy.

When Will the Fed Announce Its Interest Rate Decision?

Mark your trading calendars and set your alarms because the timing is crucial.

  • Interest Rate Decision: The FOMC statement—which includes the decision on the Federal Funds Rate, the key benchmark for short-term interest rates—will be released at 2:00 PM Eastern Daylight Time (EDT) on Wednesday, October 29, 2025.
  • Press Conference by Chair Jerome Powell: At 2:30 PM EDT, Fed Chair Jerome Powell will hold his post-meeting press conference. This half-hour session often triggers the most intense market reactions, as Powell’s tone and comments give clues about the Fed’s future direction—whether it leans toward further rate cuts or rate hikes in the coming months.
Following the announcement, Fed Chair Jerome Powell will hold a press conference to discuss the decision and the central bank's economic outlook.

Analysts and the CME FedWatch Tool currently indicate strong expectations for a 25 basis point (bps) rate cut, which would bring the target range to 3.75%–4.00%.


Why This Decision Matters Globally?

Many wonder why a single decision made in Washington, D.C. can ripple through every major economy.

The reason lies in the U.S. dollar’s role as the world’s reserve currency and the Fed’s control over its base interest rate.

Here’s how the decision affects the world:

1. Global Borrowing Costs

When the Fed raises rates, borrowing in U.S. dollars becomes more expensive for foreign governments and corporations. A rate cut does the opposite—it reduces global financing costs, often sparking investment and credit growth in emerging markets.

2. Currency and Capital Flows

A rate cut usually weakens the dollar, prompting investors to move funds toward higher-yielding emerging markets. A rate hike, on the other hand, strengthens the dollar and draws capital back to the U.S., often leading to declines in other major currencies.

3. Commodity Prices

Commodities like gold, oil, and copper are priced in U.S. dollars. When the dollar weakens after a rate cut, commodity prices tend to rise since it becomes cheaper for other countries to buy them. Conversely, a stronger dollar from a rate hike can suppress global commodity demand.

Also Read – Fed Interest Rates vs Gold Prices

This article is for informational purposes only and should not be considered financial advice. Investing in stocks, cryptocurrencies, or other assets involves risks, including the potential loss of principal. Always conduct your own research or consult a qualified financial advisor before making investment decisions. The author and publisher are not responsible for any financial losses incurred from actions based on this article. While efforts have been made to ensure accuracy, economic data and market conditions can change rapidly. The author and publisher do not guarantee the completeness or accuracy of the information and are not liable for any errors or omissions. Always verify data with primary sources before making decisions.

What If a Company Issues More Than Authorized Capital?

Authorized Capital

Authorized capital, also called authorized share capital or nominal capital, is the maximum amount of equity a company is legally permitted to issue.

It is recorded in the company’s Memorandum of Association when the firm is incorporated. The authorized figure is a ceiling, not an indication that the capital has already been raised. A company may initially issue only a fraction of the authorized amount as paid up capital and leave the balance unissued as headroom for future fundraises, stock grants, or corporate actions.

The practical effect of the number is simple. If a company needs more equity than the paid up capital allows, it can issue new shares only up to the authorized limit. To go beyond that limit the company must follow a formal process to increase its authorized capital. That process typically involves board action, shareholder approval, and regulatory filings. The requirement creates transparency and forces public record of any planned expansion of the equity base.

Why the limit exists?

Authorized capital exists for several overlapping reasons that together create checks and balances around share issuance. First, it protects investors by giving them a clear view of how much the equity base can expand. Second, it prevents management from unilaterally issuing unlimited shares that could dilute existing owners and distort control. Third, it creates a formal path to increase capital that triggers corporate governance steps and external scrutiny. Finally, in many jurisdictions registration fees, stamp duty and other government charges are calculated with reference to authorized capital, which discourages companies from setting an artificially high ceiling without a real business reason.

Those controls are especially important because the potential for misuse of share issuance is real and varied. The next section lays out how equity issuance can be abused and why the authorized-capital limit is an essential guardrail.

How equity issuance can be abused?

One problem that the authorized-capital limit helps prevent is uncontrolled dilution of existing shareholders. Imagine a company with 10,000 outstanding shares where an investor holds 5,000 shares and therefore 50 percent of the voting power. If management were able to issue 20,000 new shares without constraint or shareholder consent, the original investor’s stake would fall to 5,000 of 30,000 shares, or roughly 16.7 percent. That dramatic loss of ownership and voting influence can happen quickly if there is no legal ceiling or if the process to issue new stock is weak. The result is a shift in control and an immediate change in the value proposition for the original investors.

A related risk is a backdoor or hostile takeover engineered through selective share issuance. Issuing new shares to a friendly party can be a way to install a new controlling block without the broader shareholder body having a proper say. For example, a promoter group that wants to replace the board could arrange for a tranche of fresh equity to be subscribed by a related investor. If that stock issue is large enough, it can make the new subscriber the dominant shareholder and change the board through normal governance mechanisms while effectively bypassing prior owners.

Issuing shares at an unusually low price to related parties is another form of abuse. If management can create a large number of new shares and allocate them to insiders at a discount to market value, the insiders capture immediate value and the existing shareholders see the book and market value of their holdings diluted. This transaction shifts wealth from the public or outside investors to those on the inside and often raises questions about fairness, conflicts of interest, and disclosure.

Companies without strict limits can also be tempted to create an appearance of larger capital than truly exists. That can take the form of issuing shares that are not properly paid up or recording capital that misleads lenders and potential investors about the firm’s real equity base. The effect is to distort credit decisions and investor expectations. Financial statements and filings are meant to be reliable. When share capital is used to create a misleading picture of strength or liquidity, the damage can go beyond individual shareholders to creditors and the wider market that relies on accurate disclosures.

Because these abuses are possible, jurisdictions require formal steps to issue new shares beyond ordinary board authority. Share issuance that materially affects ownership should be visible to shareholders and regulators. That visibility creates friction. Friction means management must get approvals, make public disclosures, and in many cases offer shares to existing shareholders first. Those processes reduce the likelihood that share issuance will be used as a stealth mechanism to transfer control or value to insiders.

What happens if a company issues more than its authorized capital?

Issuing shares beyond the authorized limit is a legal breach in most jurisdictions. Such an act is typically treated as ultra vires, meaning beyond the powers of the company as defined by its constitutional documents. When shares have been issued in excess of the authorized capital the issuance can be declared void or voidable. Investors who received those shares may find their title insecure. Regulators may impose penalties on the company and on officers who authorized the transaction. Existing shareholders can sue for relief and seek to have the improper issuance set aside or ratified after the fact only through proper procedures.

Remediation is possible in many cases, but it usually involves formalizing the position through post-facto shareholder approval, amending the Memorandum of Association, and filing required disclosures with corporate registries and securities regulators. In extreme cases of deliberate deception or fraud, directors and officers may face civil liability and, where laws provide, criminal charges. Beyond legal penalties, such an episode typically damages the company’s reputation with investors and lenders and makes future capital raising more difficult and costly.

Why authorized capital still matters in modern markets?

Some observers assume the concept is archaic given the range of financing tools available today. But authorized capital remains a practical governance mechanism. It forces an explicit decision when a company wants to expand its equity base. That explicit decision comes with a record. For listed companies it also triggers securities-law disclosures and, in many markets, preemptive rights that require giving existing shareholders the opportunity to buy new shares before outsiders do. Those layers of protection are designed to keep markets fair and to make dilution a transparent, debated corporate decision rather than a private move by management.

From the perspective of founders and executives, leaving headroom under the authorized cap is sensible. It preserves flexibility to grant employee stock options, to make acquisitions paid for with stock, or to raise capital quickly when conditions are favorable. From the perspective of outside investors, knowing the authorized ceiling and the company’s track record on share issuance provides an important input to any valuation or ownership decision.

How far IPOs typically are from their maximum authorized capital?

When a company lists via an IPO it commonly uses only a portion of its authorized capital. The pattern is straightforward. Before listing most firms have issued a portion of the authorized shares as paid-up capital to founders, early investors, and employees. At IPO the company issues a new tranche to public investors and leaves the remainder unissued to preserve flexibility. That unissued portion acts as strategic headroom for future equity compensation plans, rights issues, follow-on offerings, or acquisitions.

As a hypothetical example, a firm with an authorized capital of $50 million might have $20 million in issued and paid-up equity before the IPO. The IPO might add $10 million more, leaving $20 million unissued. The company thus uses 60 percent of the authorized ceiling and retains 40 percent as a buffer. The precise split varies widely by company size, industry, jurisdiction and strategic plan. The key takeaway is that most IPOs do not max out the authorized capital; they treat it as a governance and planning tool.

Conclusion

Authorized capital is more than a technical filing line. It is an institutional brake on unilateral equity expansion and a transparency mechanism that protects investors, creditors and the market. The cap and the formal process to increase it make abusive equity tactics harder to execute and easier to detect. For investors and founders alike, the authorized-capital figure and how much of it is already issued reveal a company’s governance posture and its room to maneuver in future capital markets.

This article is for informational purposes only and should not be considered financial advice. Investing in stocks, cryptocurrencies, or other assets involves risks, including the potential loss of principal. Always conduct your own research or consult a qualified financial advisor before making investment decisions. The author and publisher are not responsible for any financial losses incurred from actions based on this article. While efforts have been made to ensure accuracy, economic data and market conditions can change rapidly. The author and publisher do not guarantee the completeness or accuracy of the information and are not liable for any errors or omissions. Always verify data with primary sources before making decisions

Top 10 Stocks That Could Benefit from Trump’s $15 Billion Farm Bailout

Trump's $15 Billion Farmer Bailout - 10 Ag Stocks Primed for a Harvest of Gains

President Donald Trump’s promised $10 to $15 billion bailout for U.S. farmers, designed to ease the pain of his trade war with China, has faced delays due to the ongoing government shutdown. The announcement, expected this week, missed its deadline. However, the package could still roll out soon. The plan aims to inject liquidity into the agricultural sector, especially soybean producers and other commodity growers hit by reduced exports and rising production costs.

Despite the delay, anticipation has already lifted agricultural stocks. Shares of Archer-Daniels-Midland and Corteva Agriscience moved higher, while the VanEck Agribusiness ETF gained 1.2 percent amid broader market uncertainty.


Economic Backdrop

Farm production costs are projected to reach around 467.4 billion dollars in 2025, which is an increase of about 12 billion dollars from last year. Rising input prices and trade disruptions have pressured farmers’ profit margins. The bailout, funded partly by tariff revenues, is similar to the 28 billion dollars in aid released during Trump’s first term. That earlier plan had stabilized the sector and pushed agricultural stocks higher for a while.

Analysts believe the current bailout could provide a five to eight percent boost to agricultural stocks if the funds are released before the end of the month. Joe Glauber, former USDA chief economist, described the move as more than just relief. He said it is also a spending stimulus for the entire agricultural ecosystem.


Also Read – The Majority of Money, Not People, Drives Market Momentum

Top Agricultural Stocks Expected to Benefit

Archer-Daniels-Midland (ADM)

This soybean processing company could see its margins widen as government aid prevents farmers from dumping crops at low prices. The stock rose 1.5 percent and has a forward price-to-earnings ratio of 11.2 with a dividend yield of 3.4 percent.

Bunge Global (BG)

Bunge, a major grain trader, could benefit as stabilized exports from supported farms boost trading volumes. The company’s shares rose 1.8 percent with a forward price-to-earnings ratio of 9.8 and a dividend yield of 3.3 percent.

Corteva (CTVA)

Corteva, a leader in seeds and crop protection, stands to gain from deregulation and higher demand for inputs. The stock rose 2.1 percent and has a forward price-to-earnings ratio of 15.4 with a dividend yield of 1.0 percent.

Deere & Co. (DE)

Deere, a leading farm equipment manufacturer, could see a rise in sales as farmers reinvest their bailout funds into machinery. The stock rose 1.3 percent and has a forward price-to-earnings ratio of 14.2 with a dividend yield of 1.6 percent.

Nutrien (NTR)

Nutrien, a top fertilizer producer, could see a jump in demand as more acreage receives subsidies. The company’s shares rose 0.9 percent with a forward price-to-earnings ratio of 10.1 and a dividend yield of 3.7 percent.

FMC Corporation (FMC)

FMC, a chemical producer, could benefit from intensified planting as aid reduces cost pressures on farmers. Its shares rose 1.1 percent with a forward price-to-earnings ratio of 11.8 and a dividend yield of 6.2 percent.

The Mosaic Company (MOS)

The Mosaic Company, a phosphate supplier, could gain from the need for balanced nutrients in bailout-backed farms. The stock rose 0.7 percent with a forward price-to-earnings ratio of 9.2 and a dividend yield of 2.8 percent.

CF Industries (CF)

CF Industries, which specializes in nitrogen-based fertilizers, could benefit directly from a recovery in corn and soybean planting. The stock rose 1.0 percent and has a forward price-to-earnings ratio of 12.3 with a dividend yield of 2.5 percent.

Tyson Foods (TSN)

Tyson Foods could profit from lower feed costs as the bailout stabilizes grain prices. The company’s shares rose 0.6 percent and have a forward price-to-earnings ratio of 13.6 with a dividend yield of 3.6 percent.

Scotts Miracle-Gro (SMG)

Scotts Miracle-Gro could experience an indirect benefit as healthier farm operations increase demand for turf and specialty fertilizers. The stock rose 1.4 percent with a forward price-to-earnings ratio of 14.1 and a dividend yield of 4.2 percent.

These companies have deep ties to the Midwest, where soybean losses exceed five billion dollars annually due to China’s retaliatory tariffs.


Also Read – Everything You Need to Know About the Dollar Index in 2025

How the Bailout Works?

The proposed bailout is modeled after the 2018 Market Facilitation Program, which provided direct payments to farmers who suffered export losses. Soybean growers, whose exports to China have fallen by nearly half, are expected to be the main beneficiaries.

The specific allocation between soybean, corn, and dairy producers is still undecided. However, the initiative reflects Washington’s effort to support rural communities ahead of midterm elections. Past examples show similar moves have lifted agricultural stocks. After the 2018 program was announced, Archer-Daniels-Midland rose seven percent, and Deere gained ten percent due to increased machinery orders.

Despite potential benefits, some farmers remain cautious. Iowa soybean grower Mark Smith said it feels like a Band-Aid on a broken arm, adding that without trade deals, the aid only delays deeper financial pain.


Policy Implications

The Trump administration’s broader agricultural policy could further influence these outcomes.

Biotech deregulation may accelerate approval of genetically modified seeds developed by companies like Corteva. Lower corporate taxes could enhance profit margins across the agricultural supply chain.

Additionally, tariff-funded subsidies may offset short-term trade disruptions, giving temporary support to the sector.


Challenges and Risks

The government shutdown, now in its third week, has halted USDA operations and delayed the release of aid. If the situation continues, disbursements may not start until November, which could reduce the short-term boost to the market.

Another major risk is the potential escalation of tariffs. Trump’s proposal of a 60 percent tariff on Chinese goods could further damage exports and undercut the very relief this bailout seeks to provide.

This article is for informational purposes only and should not be considered financial advice. Investing in stocks, cryptocurrencies, or other assets involves risks, including the potential loss of principal. Always conduct your own research or consult a qualified financial advisor before making investment decisions. The author and publisher are not responsible for any financial losses incurred from actions based on this article. While efforts have been made to ensure accuracy, economic data and market conditions can change rapidly. The author and publisher do not guarantee the completeness or accuracy of the information and are not liable for any errors or omissions. Always verify data with primary sources before making decisions