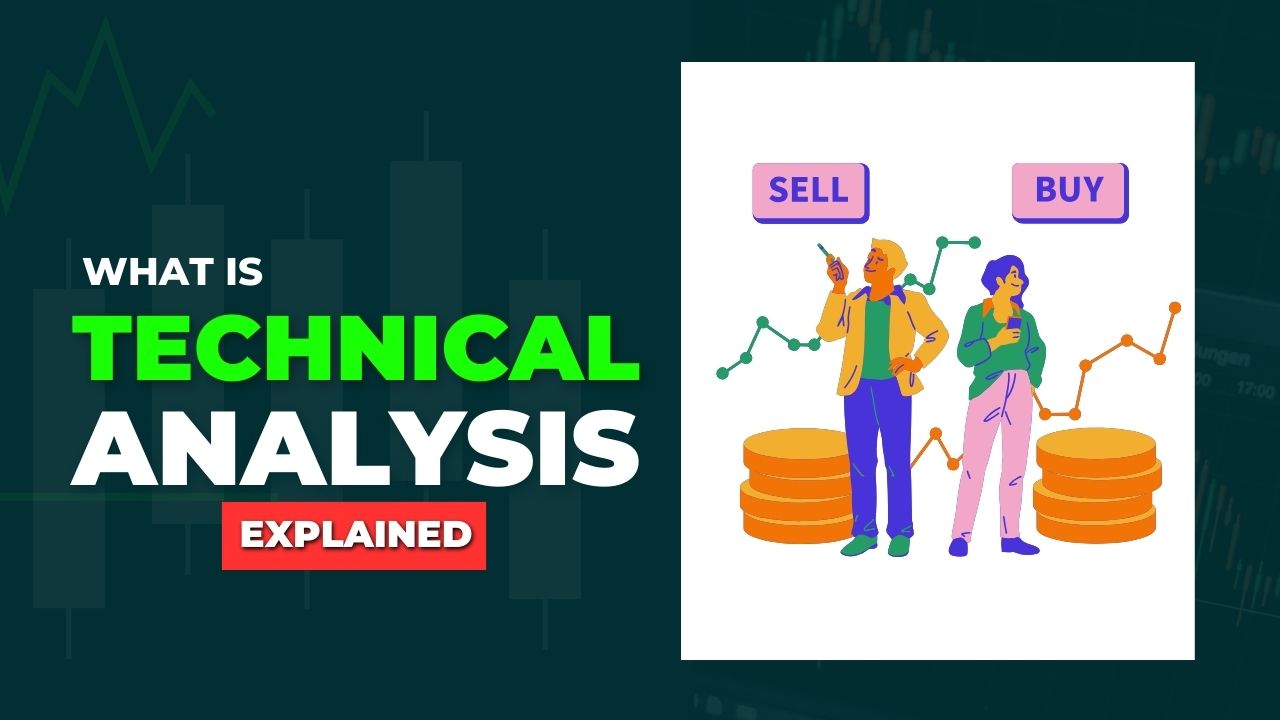
Stocks (or any financial instrument that is traded on financial markets) are commonly analyzed using two main approaches: Fundamental Analysis and Technical Analysis. Technical analysis is a method used to evaluate and predict the future price movements of financial assets such as stocks, currencies, and commodities by examining past market data, primarily price and volume. Unlike fundamental analysis, which looks at the intrinsic value of an asset, technical analysis focuses on identifying patterns and trends from historical data to guide trading decisions.
Table of Contents
Connecting the dots
Before making investments, financial instruments such as stocks, cryptocurrency, forex, and commodities are studied. Generally, two main methods are used to analyze these instruments: fundamental analysis and technical analysis.
Technical analysis focuses on charts where price and volume are studied. The goal is to predict future price movements based on past prices and volumes.
Types of Technical Analysis
There are two methods for conducting technical analysis:
- price action
- Indicators
Price action involves studying price movements alone. Though price action can be studied using many types of charts but candlestick charts are used prominently. Price movements are analyzed using candlestick chart patterns.
What are Chart Patterns?
- Chart patterns are shapes and formations that appear on price charts. Examples include head and shoulders, double tops, and triangles. These patterns can indicate whether the price is likely to continue in its current direction or reverse.
Technical Indicators:
Indicators are based on price and volume data. However, indicators are considered lagging because they reflect price changes only after they have occurred.
But what are indicators?
- Technical indicators are mathematical calculations based on price, volume, or open interest. Examples include moving averages, relative strength index (RSI), and Bollinger Bands. These indicators help traders understand market conditions like momentum, volatility, and potential price changes.
Who is the father of technical analysis?
Charles Dow is widely regarded as the father of technical analysis. He co-founded Dow Jones & Company and created the Dow Jones Industrial Average. His work laid the foundation for modern technical analysis through the development of the Dow Theory, which remains influential today.
What are the four basics of technical analysis?
- Price Action: The core tool in technical analysis is the asset’s price, reflecting all known information and market sentiment.
- Volume: Analyzing trading volume helps confirm trends and reversals. High volume indicates strong interest and conviction behind a price movement.
- Trend Analysis: Identifying the market’s direction, whether up, down, or sideways, is crucial. Trends can be classified as short-term, intermediate-term, or long-term.
- Support and Resistance: These levels indicate where the price tends to stop and reverse. Support is a price level where a downtrend can pause due to demand concentration, while resistance is a level where an uptrend can pause due to supply concentration.
Why do traders use technical analysis?
Traders use technical analysis to:
- Identify Trends: It helps traders see whether the price is in an uptrend (rising), downtrend (falling), or moving sideways.
- Time Entries and Exits: Technical indicators and chart patterns can signal optimal points to enter or exit trades.
- Manage Risk: Understanding support and resistance levels helps traders set stop-loss orders to manage risk.
- Enhance Decision-Making: Technical analysis provides data-driven insights that complement other forms of analysis.
Is technical analysis useful?
Yes, technical analysis is useful for many traders and investors. It provides a framework for making trading decisions based on historical price patterns and market psychology. However, it is not foolproof and should be used alongside other forms of analysis and risk management strategies.
What are some of the best practices for technical analysis?
- Combine with Other Analysis: While technical analysis is useful, it’s most effective when combined with other forms of analysis, such as fundamental analysis (which looks at a company’s financial health and performance).
- Risk Management: Always use robust risk management practices. This means setting stop-loss orders to limit potential losses and not investing more than you can afford to lose.
Which technical analysis method is used the most?
Price Action is the most used technique along side moving averages, RSI, MACD, Bollinger Bands, and Fibonacci retracement levels. Among these, moving averages and RSI are particularly popular due to their simplicity and effectiveness.
Is technical analysis used for short term?
Technical analysis can be used for both short-term and long-term trading. While it is often associated with short-term trading due to its focus on price movements and patterns, many technical tools are also applicable to longer time frames.
Do professional traders use Technical Analysis?
Yes, professional traders use technical analysis. It is a critical component of the trading strategies employed by many professional traders, hedge funds, and investment firms. They often combine technical analysis with fundamental analysis and other strategies to make informed decisions.
Conclusion
Technical analysis is a valuable tool for anyone looking to trade or invest in financial markets. It provides insights into price trends and market behavior by analyzing historical data. By using techniques like chart patterns and technical indicators, and combining them with other analysis methods and strong risk management, traders can improve their chances of making successful trades.

