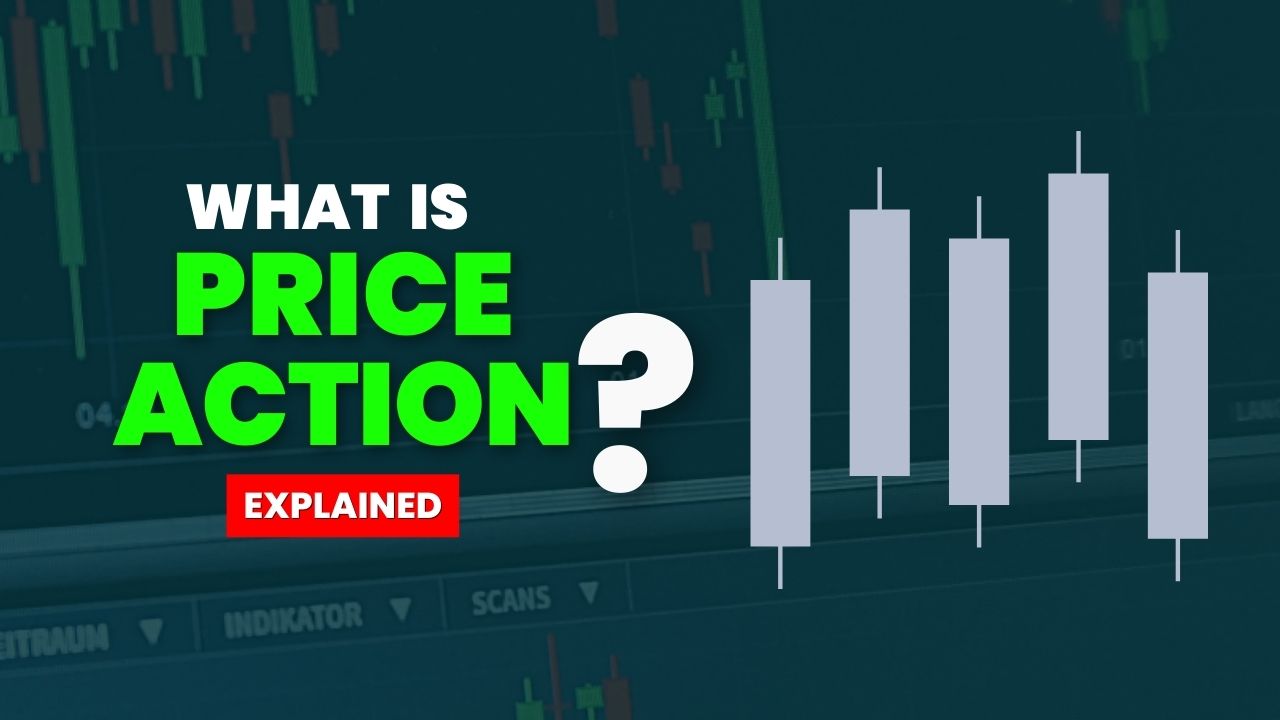
Ever wondered how traders make decisions without indicators? Price action trading might be the answer. It is considered a subset of technical analysis. In this article, we’ll break down what price action is, why it matters, and how you can use it to improve your trading decisions.
Table of Contents
What is the meaning of price action?
Price action in trading simply means looking at how the price of a stock, cryptocurrency, or any financial asset moves up and down over time. Instead of relying on complicated indicators or news, traders who use price action focus directly on these price movements shown on charts. They believe that by studying how prices behave at different levels, like when they go up or down sharply or bounce off certain points, they can predict where prices might go next. This approach helps traders make decisions based on what the price itself is doing, rather than on other factors.
Who is the father of price action?
While price action trading has evolved over time with contributions from many traders, Steve Nison is often credited with popularizing candlestick charting techniques in the Western world, which are integral to price action analysis.
What is the Difference Between Price Action and Technical Analysis?
- Price action is the movement of a stock’s price over time. Traders look at price action to make decisions based purely on the price movements.
- Technical analysis is a broader method of studying stock prices. It includes price action, charts, patterns, and technical indicators to predict future price movements.
So, price action is just one part of technical analysis.
What is the principle of price action?
The core principle of price action is that all market information is reflected in the price, and by studying how prices move and react at different levels, traders can forecast future price movements with greater accuracy.
Traders aim to identify trends, support and resistance levels, and candlestick patterns to determine entry and exit points.
Is price action good for trading?
Yes, many traders find price action analysis effective because it simplifies decision-making and can be applied to any market or timeframe. It emphasizes understanding market psychology and interpreting candlestick patterns, chart patterns, and support/resistance levels to anticipate future price movements.
How to read price action?
To read price action, traders observe patterns in candlestick charts, such as engulfing patterns, pin bars, and inside bars, which indicate potential reversals or continuations. They also analyze trends, volatility, and volume to gauge market sentiment and make informed trading decisions.
Which indicator is best for price action?
Price action traders typically avoid traditional indicators and instead focus on interpreting raw price data. However, some use simple tools like moving averages or Fibonacci retracement levels to complement their analysis without relying heavily on them.
Which chart is best for price action?
The most commonly used charts for price action trading are candlestick charts due to their clarity in displaying price movements and patterns. These charts provide visual cues about market sentiment and help traders identify potential trade setups.
What is the best time for price action trading?
Price action strategies can be applied to any timeframe, from minutes to months, depending on a trader’s preferences and trading style. Shorter timeframes, such as 1 minute, 3 minutes, 5 minutes, 15 minutes, or even 1 hour, may offer more frequent trading opportunities but also come with many traps. On the other hand, longer timeframes, like 4 hours, daily, weekly, monthly, or even quarterly, tend to provide more reliable signals. Patterns in higher timeframes are not easy to manipulate. The higher the timeframe, the higher the probability of the pattern working
How many types of price action are there?
Price action can be categorized into various patterns and setups, such as:
- reversal patterns (like head and shoulders, pinbars etc)
- continuation patterns (such as triangles, marubozu pattern etc)
Each type provides different insights into market sentiment and potential price movements.
What is the primary advantage of using price action in stock trading?
The main advantage of price action trading is its simplicity and effectiveness. Price action trading is based on the idea that everything you need to know about a stock’s future direction is already shown in its price movements. This method avoids relying on complicated indicators or news, focusing instead on what the price itself is doing to make decisions. It’s straightforward and can be applied to various types of stocks and timeframes, making it a popular choice among traders.
Do professional traders use price action?
Yes, many professional traders use price action as a key part of their trading strategies. They appreciate its ability to provide clear signals and insights into market behavior without relying on complex methods. Professional traders often combine price action with other forms of analysis to enhance their trading decisions, making it an essential tool in the financial markets.
Conclusion
Price action trading is a way to trade stocks or other assets by focusing on how their prices move. Instead of using complicated indicators or news, price action traders look directly at how prices go up and down over time. They learn to spot patterns and understand why prices might change, which helps them predict where prices could go next. It takes practice to get good at this method, but once traders understand it, they can use it in different markets to make smarter trading choices. Whether you’re new to trading or have been doing it for a while, price action can be a useful approach because it’s straightforward and works across various types of markets.

