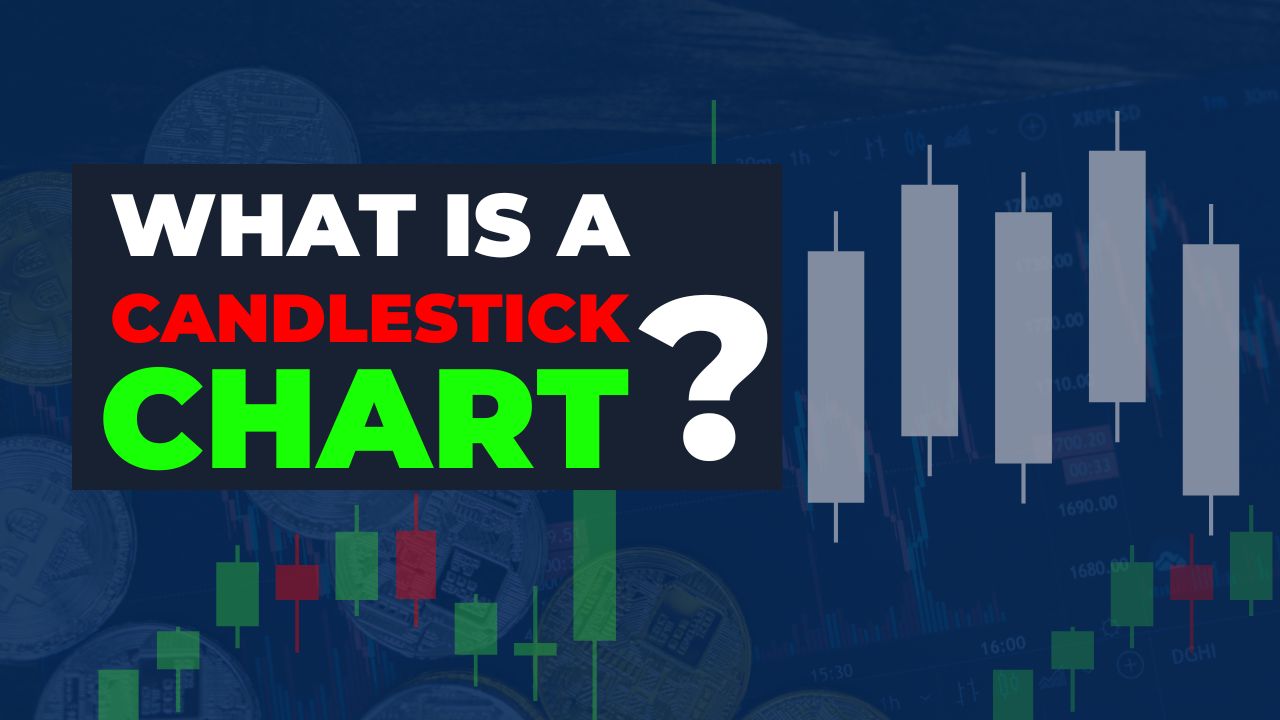
Candlestick charts are often considered the best tool for predicting price action. Many successful traders have mastered price action using candlestick charts. In this article, we will learn about candlesticks and how they visually represent prices. Let’s get started!
Table of Contents
What is a candlestick in trading?
Stock trading is all about price, and one way to study stocks is through technical analysis. Within technical analysis, we have price action and many price and volume-based technical indicators. However, people generally prefer price action first. Price action simply means the movement of price within the chart. It involves closely analyzing how the price behaves at certain levels. The visual representation of the price is done through charts. There are different types of charts like line charts, Heikin-Ashi charts, bar charts, and candlestick charts. Out of all these, candlestick charts are something special. They are used by most traders worldwide along with some indicators.
But what’s so special about these candlestick charts?
A candlestick is a packed representation of price over a given period of time.
Let’s simplify it more.
A candlestick has 4 price points in it:
Open, High, Low, and Close. It is called OHLC in short.
Candlesticks and Time Frame
Candlesticks come in every time frame, like we can have a candlestick of 1 hour, 1 day, 1 week, 1 year, 2 weeks, 2 years, 1 minute, 5 minutes, 30 minutes, 3 minutes, 1 second, 5 seconds, 10 seconds, and so on. Now you might have an idea that a candlestick can be made for any time period. Since time is an infinite thing, we can never run out of units of time and so of candlesticks.
It all comes down to the point that price has a fractal nature.
How is a candlestick formed?
You have a time period of, say, 6 months. You can make a candlestick representation of the prices within that 6 months. But for that, you must know what the opening price (initial price simply) was for that 6-month period, what the highest price was within that period, what the lowest price was, and at the end of that 6 months, what the last price was. So, this is it. I think this is the simplest explanation of price representation through a candlestick.
History of Candlestick Charts
Now, where did this price representation through candlesticks come from? It all started in Japan. There was a trader called Munehisa Honma, who is known as the father of candlestick charts. Japanese rice traders used candlestick charts for their trading. Then, it spread to the Western world, gradually to America, and finally into the stock markets and financial markets.
What is the importance of Candlestick Charts?
But why are these candlestick charts so important? Why are these charts prioritized over other methods of price representation? Because candlestick charts show the collective emotion of the crowd much better than other methods. These emotions are seen through the Open, High, Low, and Close prices in a given interval of time.
Types of Candlesticks
A candlestick is just a visual representation of price and has no inherent types. However, based on past price action and candlestick behavior, people have categorized some candlesticks by their patterns and formations.
While there is no exhaustive list of candlestick patterns, some commonly recognized ones include Doji, Hammer, and Engulfing. These types are based on their patterns and formations. These patterns help traders interpret market movements, though traders can also create and name their own unique patterns.
How to Read Price Action in Candlestick Charts?
To read price action in candlestick charts:
Start by understanding that each candlestick represents a specific time period and shows four key price points: Open, High, Low, and Close (OHLC). Here’s how to do it:
- Identify Candlestick Patterns: Look for common patterns like Doji, Hammer, and Engulfing. These patterns can indicate potential market trends and reversals.
- Analyze the Body and Wicks: The body of the candlestick shows the range between the opening and closing prices. The wicks (or shadows) show the highest and lowest prices during the period.
- Observe Trends: Look at a series of candlesticks to see if there are any trends. An upward trend (bullish trend) is indicated by a series of candlesticks with higher highs and higher lows. A downward trend (bearish trend) is indicated by lower highs and lower lows.
- Watch for Support and Resistance Levels: These are price levels where the stock tends to find support as it falls or resistance as it rises. Candlestick patterns at these levels can be significant indicators of future price movements.
- Use Volume: Volume can confirm price action. High volume on a bullish candlestick can indicate strong buying interest, while high volume on a bearish candlestick can indicate strong selling pressure.
By combining these elements, you can effectively read price action in candlestick charts and make informed trading decisions.
ALSO READ – What is the meaning of Market Price in the Stock Market?
The Bottom Line
Candlestick charts play an important role in trading. Their simplicity makes them popular among traders. However, these charts can be misleading if you are not fully aware of the other factors involved in trading. Therefore, it is important to learn how to read price action through candlestick charts before moving ahead. Happy trading!

