The History of Options Trading in India

https://feelthecandlesticks.com/history-of-options-trading-in-india/

In this article, we will go through the history of options trading and how it became popular in India. Options trading is an interesting part of the financial markets. It’s a way for people to invest and manage risks. To really understand options trading today, it’s helpful to look at its history. Knowing where it started and how it evolved can give us valuable knowledge about how it works now.

Origin of Options Trading

  1. Ancient Beginnings: Options trading has a long history that started with forward contracts in ancient civilizations. In ancient Greece, farmers used these contracts to agree on selling crops at a set price for a future date. This helped them avoid the risk of price drops.
  2. Evolution Over Time: Over time, these basic contracts evolved into more flexible financial tools called options. By the Middle Ages in Europe, options trading became more formal. The Dutch were pioneers in using options to manage risks in their tulip markets.
  3. 18th and 19th Century Developments: In the 18th and 19th centuries, options trading grew more structured with formal markets emerging. This made options trading more organized and accessible to more people.
  4. 20th Century Growth: In the early 20th century, the creation of organized exchanges and standardized options contracts made trading easier and more accessible. The establishment of the Chicago Board Options Exchange in 1973 was a major milestone. It created a dedicated platform for trading standardized options and made the market more transparent and regulated.

When did options trading start in India?

Options trading in India officially started in June 2001.

  • June 4, 2001: The Bombay Stock Exchange (BSE) launched index options on the Sensex.
  • July 2, 2001: The National Stock Exchange (NSE) launched index options on the Nifty 50.

Later, stock options (options on individual company shares) were introduced on July 2, 2001, by the NSE.

So, options trading in India began with index options, and then very soon after, stock options were also made available.

The Growth of Derivatives Trading

After the introduction of Index and Stock Options, the Indian market saw the launch of Stock Futures in November 2001. This addition provided investors with more tools to manage their investments. In December 2002, sectoral indices were also allowed for derivatives trading. This meant that investors could trade options and futures on specific sectors like banking or IT.

Mini Derivative Contracts

A significant development came in December 2007 when SEBI, the Securities and Exchange Board of India, permitted mini derivative contracts on major indices like Sensex and Nifty. These mini contracts made it easier for small investors to participate in the derivatives market. It was a step towards making the market more inclusive and accessible.

The Introduction of Bank Nifty Options

Bank Nifty options trading started in India in 2009. This allowed investors to trade options specifically on the banking sector index. The introduction of Bank Nifty options provided more opportunities for investors to hedge their positions and benefit from the movements in the banking sector.

The Rise of Options Trading in India

Today, the Indian stock market offers options trading on a wide range of stocks. There are many stocks with options available, giving investors plenty of choices to diversify their portfolios. Options trading has grown significantly since its introduction, becoming an integral part of the Indian financial market.

Why Options Trading Was Introduced in India

Options trading was introduced in India to provide investors with more tools to manage their risks and enhance their returns. It allows investors to hedge their positions, speculate on market movements, and generate income through various strategies. The introduction of options trading has added depth and liquidity to the Indian stock market, making it more robust and efficient.

The First Listed Stock Options

The first listed stock options in India were on 31 stocks, which included major companies like Reliance, Infosys, and State Bank of India. These stock options gave investors the ability to trade options on individual stocks, providing more flexibility and opportunities in the market.

Modern Options Trading

Today, technology has a huge impact on options trading. With the advent of computers and the internet, trading has become faster and more efficient. Online trading platforms allow people to trade options from anywhere in the world. This has made options trading accessible to a much larger audience.

Significant regulatory changes have also shaped modern options trading. Regulations help ensure that options markets are fair and transparent. They protect investors and maintain the integrity of the markets.

Recent developments and current trends show that options trading is still evolving. New financial instruments and strategies continue to emerge. Options trading remains a dynamic and exciting part of the financial world.

The Bottom Line

The history of options trading is a journey from ancient times to modern markets. From early forms of derivatives in ancient Greece to the sophisticated trading platforms of today, options trading has come a long way. Understanding its history helps us appreciate the evolution and importance of options trading.

For modern traders, knowing the history of options trading is valuable. It provides context and insights into how the market works today. It’s a reminder that while the tools and technology may change, the fundamental principles of options trading remain the same. Whether you’re a seasoned trader or just starting out, understanding the history of options trading can help you navigate the market more effectively.

Social Share Buttons

Understanding the CASA Ratio: Important Points to Know

https://feelthecandlesticks.com/what-is-the-casa-ratio-in-the-stock-market/

While analyzing the financial results of banking sector stocks, we often come across the term CASA ratio. In this article, we will understand this concept in detail and explore its significance in the banking sector. So, let us begin.

What is the CASA Ratio?

The CASA ratio stands for Current Account and Savings Account ratio. It’s a key metric used by banks to measure the amount of money deposited in current and savings accounts compared to the total deposits.

CASA Ratio Formula
CASA Ratio = (Current Account Balances + Savings Account Balances) / Total Deposits

Where:

Current Account Balances = The total amount of money held in current accounts

Savings Account Balances = The total amount of money held in savings accounts

Total Deposits = The total amount of deposits held by the bank

This ratio helps banks understand the proportion of low-cost funds (current and savings accounts) they have, which is crucial for their profitability.

Why is the CASA Ratio Important?

Banks prefer a high CASA ratio because:

  1. Lower Cost of Funds: Interest paid on current and savings accounts is lower compared to fixed deposits. This means the bank’s cost of acquiring funds is less.
  2. Higher Profit Margins: With lower costs, banks can maintain higher profit margins.
  3. Liquidity: Money in current and savings accounts is more liquid, meaning it can be easily used for lending and other banking activities.

Understanding through a Scenario

Let’s consider a simple scenario to understand the CASA ratio better.

Suppose Bank ABC has the following deposits:

  • Current Account Deposits: ₹2 crore
  • Savings Account Deposits: ₹3 crore
  • Fixed Deposits: ₹5 crore
CASA Ratio Calculation

First, let’s calculate the total deposits:

Total Deposits = Current Account Deposits + Savings Account Deposits + Fixed Deposits

Using the values provided:

Total Deposits = ₹2 crore + ₹3 crore + ₹5 crore = ₹10 crore

Now, we can calculate the CASA ratio:

CASA Ratio = (₹2 crore + ₹3 crore) / ₹10 crore = ₹5 crore / ₹10 crore = 0.5 or 50%

So, Bank ABC has a CASA ratio of 50%. This means that half of the bank’s deposits come from current and savings accounts, which is favorable for the bank.

ALSO READ – Understanding Dabba Trading and CFDs: What’s the Deal?

Real-Life Application

Let’s look at a real-life example to see how the CASA ratio affects a bank’s operations.

Example: Bank XYZ

Bank XYZ has been working on increasing its CASA ratio. Initially, the bank had a CASA ratio of 30%, which means that only 30% of its deposits were in current and savings accounts. The remaining 70% were in fixed deposits, which are more expensive for the bank due to higher interest payments.

Bank XYZ decided to launch new savings account schemes with attractive features and better interest rates. They also introduced special current account services for businesses. As a result, more customers started opening current and savings accounts.

After a year, Bank XYZ’s efforts paid off. Their CASA ratio increased to 45%. This improvement meant that the bank’s cost of funds decreased because a larger portion of their deposits were now in lower-cost accounts. With reduced costs, Bank XYZ could offer more competitive loan rates and increase its profitability.

Is a High CASA Ratio Good?

Yes, a high CASA ratio is generally considered good for banks. It indicates a higher proportion of deposits in current and savings accounts, which typically carry lower interest costs compared to fixed deposits. This lower cost of funds can enhance the bank’s profitability and financial stability.

Why Do Banks Want to Increase CASA?

Banks strive to increase their CASA ratio for several reasons:

  1. Lower Cost of Funds: Current and savings accounts usually offer lower interest rates compared to fixed deposits. This reduces the bank’s overall interest expense.
  2. Higher Profit Margins: With a lower cost of funds, banks can achieve higher profit margins on the loans they provide.
  3. Improved Liquidity: Funds in CASA accounts are more liquid and can be easily accessed for lending and other operational needs.
  4. Stable Funding: CASA deposits are considered more stable compared to fixed deposits, which might be withdrawn after maturity.

What Does a Low CASA Ratio Mean?

A low CASA ratio means that a smaller proportion of the bank’s deposits are in current and savings accounts, while a larger proportion is in fixed deposits. This can have several implications:

  1. Higher Cost of Funds: Since fixed deposits typically offer higher interest rates, a low CASA ratio indicates higher interest expenses for the bank.
  2. Lower Profit Margins: Higher cost of funds can reduce the bank’s profit margins.
  3. Potential Liquidity Issues: Fixed deposits are less liquid compared to CASA deposits, which might affect the bank’s ability to meet sudden withdrawal demands.
  4. Increased Financial Risk: A higher reliance on fixed deposits can make the bank more vulnerable to changes in interest rates and economic conditions.

In summary, a high CASA ratio is beneficial for banks as it reduces their cost of funds and increases profitability, while a low CASA ratio indicates higher costs and potential liquidity challenges.

Conclusion

The CASA ratio is a critical metric for banks, indicating the proportion of low-cost funds they have. A higher CASA ratio means lower costs and better profitability for banks. Understanding this ratio helps us appreciate the strategies banks use to manage their deposits and maintain financial health.

In summary, a bank’s CASA ratio is like a health check-up. The healthier the ratio, the better the bank’s ability to generate profits and offer competitive services.

You Can Check HDFC Bank’s CASA Ratio Here

What is the full form of CASA?

The full form of CASA is Current Account and Savings Account.

What is the casa formula?

CASA Ratio = [Current Account Deposits + Saving Account Deposits / Total Deposits]

Which Indian bank has highest CASA ratio?

Bank of Maharashtra has the highest CASA ratio of more than 50%. (Until December 2023 quarter)

This textile company announces a share buyback worth ₹278 crore – Shareholders could see significant gains?

https://feelthecandlesticks.com/this-textile-company-announces-a-share-buyback-worth-₹278-crore-shareholders-could-see-significant-gains/

Welspun Living Ltd., a prominent name in the textile industry, has recently made a couple of important announcements. They have approved a buyback of their own shares and also shared their financial results for the June quarter. Let’s dive into what this means for the company and its shareholders.

What is a Share Buyback?

A share buyback is when a company decides to purchase its own shares from the market. This is usually done to reduce the number of shares available in the market, which can help boost the share price. In Welspun Living’s case, they plan to buy back up to 1.26 crore shares at ₹220 each. This price is 26% higher than the closing price of the shares on Tuesday.

Why is the Buyback Important?

Welspun Living is set to buy back these shares for a total amount of ₹278 crore. This buyback will cover about 7.87% of the company’s total equity. The record date for this buyback is August 5, 2024. This means that if you own shares of Welspun Living by this date, you are eligible to participate in the buyback.

The buyback will follow a “tender offer” procedure. This means that shareholders can offer their shares to the company at the fixed price of ₹220. DAM Capital Advisors has been hired to manage this buyback process.

About Welspun Living

Welspun Living is a major textile manufacturer based in Mumbai. It was previously known as Welspun India and was founded in 1985.

What does Welspun Living do?

The company exports its home textile products to over 50 countries. It is a key supplier to many top global retailers. The company’s manufacturing facilities in Gujarat are equipped with advanced technology to produce a vast amount of textiles each year.

Welspun Living’s Financial Performance

Along with the buyback announcement, Welspun Living also shared its financial results for the June quarter. Here’s a quick overview:

  • Revenue: The company earned ₹2,536.5 crore, which is a 16% increase compared to the same period last year.
  • EBITDA: Earnings Before Interest, Tax, Depreciation, and Amortisation (EBITDA) rose by 10% to ₹342 crore.
  • EBITDA Margin: This margin fell slightly from 14.2% last year to 13.5% this year.

Despite challenges from global economic conditions and shipping issues in the Red Sea, Welspun Living saw a 20% growth in its exports. This positive news was highlighted by Chairman BK Goenka.

Also Read – Government Hikes LTCG, STCG, STT: But What Do These Taxes Mean for You?

Share reaction after the announcement

Following these announcements, Welspun Living’s share price saw a jump. The shares touched a high of ₹181.70 and a low of ₹173.24 on the day of the announcement.

How to Participate in the Buyback?

If you are a shareholder, here’s how you can take part in the buyback:

  1. Shares in Demat Form: If your shares are in electronic form, inform your stockbroker about the shares you want to tender. You’ll need to transfer these shares to a special account set up for the buyback.
  2. Shares in Physical Form: If you have physical share certificates, you must present them along with any required documents to your broker. After verifying the documents, the broker will place an order for the buyback on your behalf.

The Bottom Line

In summary, Welspun Living’s share buyback is a significant move aimed at enhancing shareholder value. Coupled with strong financial performance and growth in exports, it’s an exciting time for the company and its investors.

Social Share Buttons

Government Hikes LTCG, STCG, STT: But What Do These Taxes Mean for You?

https://feelthecandlesticks.com/government-hikes-ltcg-stcg-stt-but-what-do-these-taxes-mean-for-you/

Finance Minister Nirmala Sitharaman recently announced an increase in the tax on trading futures and options (F&O) and on capital gains from both financial and non-financial assets. These changes impact key taxes like Long-Term Capital Gains (LTCG), Short-Term Capital Gains (STCG), and Securities Transaction Tax (STT). Understanding these taxes is crucial for investors as they significantly influence investment strategies and returns in the stock market. In this post, we’ll break down what these taxes mean and how the new rates could affect your investments.

What is Long Term Capital Gain Tax?

Long-Term Capital Gains (LTCG) tax is the tax you pay on the profit you make from selling an asset that you have held for more than a year. This includes assets like stocks, mutual funds, property, and other financial and non-financial assets.

Suppose you bought shares of a company for ₹10,00,000 and held them for two years. After two years, you decide to sell the shares for ₹15,00,000. The profit you made, ₹5,00,000, is considered a long-term capital gain because you held the shares for more than a year.

What is Short Term Capital Gain Tax?

This tax applies to the profit you make from selling an asset that you have held for less than a year. For instance, if you buy shares and sell them within six months for a higher price, the profit is a short-term capital gain and is subject to STCG tax. This applies to various types of assets, including stocks, mutual funds, and real estate.

The New Long-Term Capital Gains Tax and Short-Term Capital Gains Tax Rules

Finance Minister Nirmala Sitharaman proposed increasing the long-term capital gains (LTCG) tax on all financial and non-financial assets from 10% to 12.5%. She also announced that the short-term capital gains (STCG) tax on certain financial assets will now be 20%.

Example:

  • LTCG Example: If you sell a property or stocks after holding them for more than a year and make a profit of ₹10,00,000, you used to pay ₹1,00,000 as tax (10%). Now, you will have to pay ₹1,25,000 as tax (12.5%).
  • STCG Example: If you sell shares after holding them for less than a year and make a profit of ₹10,00,000, you used to pay ₹1,50,000 as tax (15%). Now, you will have to pay ₹2,00,000 as tax (20%).

What is Securities Transaction Tax (STT)

Securities Transaction Tax (STT) is a small fee you pay when you buy or sell stocks, futures, options, or other financial securities on the stock market.

STT is collected by the stock exchanges and paid to the government. This means the tax is automatically deducted when you execute a transaction.

The New Securities Transaction Tax (STT) Rule

While announcing the Union Budget for 2024-25, Finance Minister Nirmala Sitharaman proposed increasing the Securities Transaction Tax (STT) on trading futures to 0.02% and on options to 0.1%.

Example:

  • If you trade futures worth ₹10,00,000, the new STT will be ₹200 (0.02% of ₹10,00,000).
  • If you trade options worth ₹10,00,000, the new STT will be ₹1000 (0.1% of ₹10,00,000).

This means that for every ₹10 lakh you trade in futures, you will now pay ₹200 in tax, and for every ₹10 lakh you trade in options, you will pay ₹1000 in tax.

The Bottom Line

Understanding the different types of taxes on your investments, such as Long-Term Capital Gains (LTCG), Short-Term Capital Gains (STCG), and Securities Transaction Tax (STT), is crucial for effective financial planning. These taxes directly impact your net returns and can influence your investment strategy. With recent changes increasing the LTCG and STCG tax rates, it’s more important than ever to be informed about how these taxes work and how they affect your investments.

By staying informed and considering the tax implications of your investment decisions, you can better manage your portfolio and make more strategic choices. Whether you are trading frequently or holding assets for the long term, understanding these taxes will help you optimize your gains and achieve your financial goals

Greater Fool Theory and Its Impact on Investments in the stock market

https://feelthecandlesticks.com/greater-fool-theory-and-its-impact-on-investment/

The Greater Fool Theory is a concept that explains why some investors buy overpriced assets. The idea is simple: they hope to sell these assets to someone else, whom they consider a “greater fool,” for a profit. This behavior is particularly common during market bubbles, when prices are driven up by speculation rather than actual value.

The Psychology of Market Bubbles

Market bubbles happen when prices of assets, like stocks or real estate, go up a lot higher than their actual value. This is often driven by a mix of greed, fear of missing out (FOMO), and following what everyone else is doing (herd mentality). As prices keep rising, people start believing that they will continue to go up, which attracts even more investors. This creates a cycle where prices keep going higher and higher.

Regular investors, who might not have advanced financial knowledge, are especially vulnerable to these bubbles. The idea of making quick money can be very tempting, but it often leads to making hasty decisions. When the bubble bursts and prices crash, these investors can end up facing significant losses.

Lessons from the Dot-Com and Housing Market Bubbles

The dot-com bubble of the late 1990s and the housing market bubble of the 2000s are clear examples of the dangers of the Greater Fool Theory. In both cases, prices of stocks and houses skyrocketed to levels that couldn’t be sustained, fueled by overly optimistic and irrational thinking. When these bubbles burst, they caused major economic problems.

These events show how important it is to think long-term when investing. While short-term market changes can be very dramatic, focusing on the basic value of an investment can help investors get through tough times.

Conclusion

The Greater Fool Theory helps us understand why market bubbles happen, but it shouldn’t guide how you invest. This theory shows how people buy overpriced assets hoping to sell them to someone else for a higher price. Recognizing the psychological factors like greed and FOMO that drive these bubbles is important.

To protect your wealth and achieve long-term financial success, stick to solid investment principles. Remember, investing is a marathon, not a sprint. Patience, discipline, and focusing on the true value of investments will benefit you in the long run.

Paper Trading vs. Real Trading: Understanding the Differences

v-l-infraprojects-ipo-to-open tomorrow

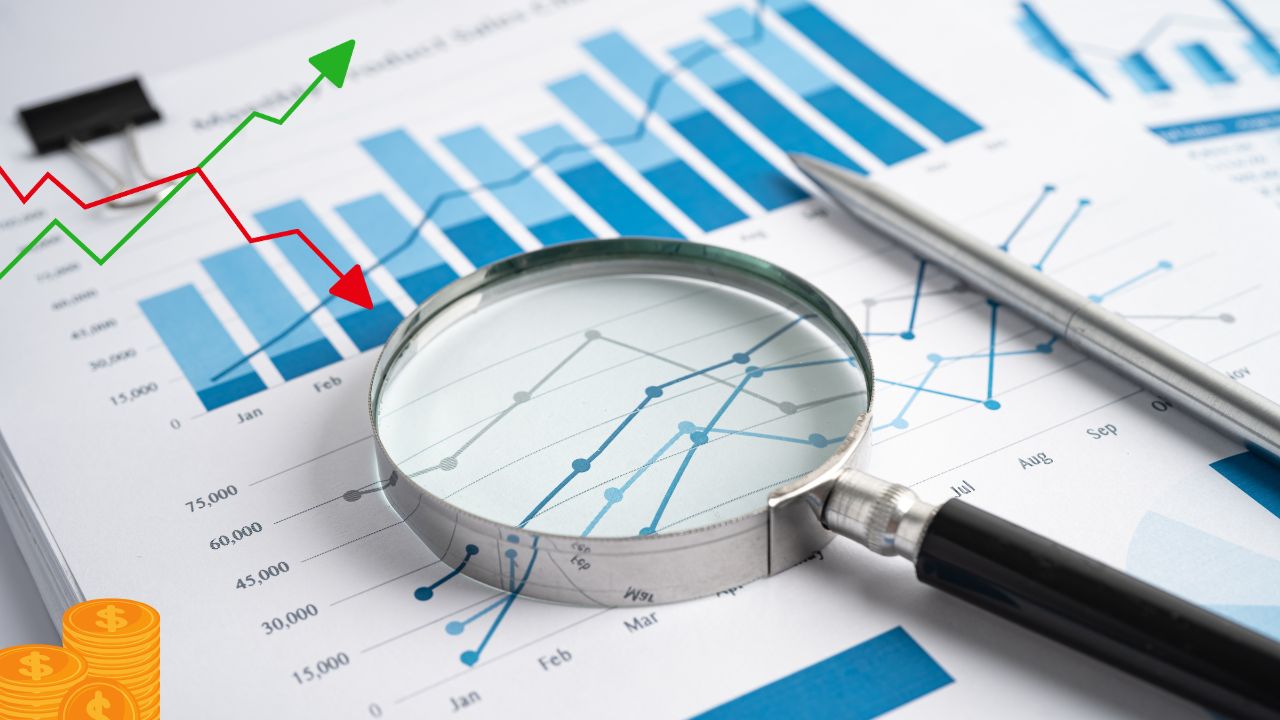
When it comes to learning about stock markets, many people start with paper trading. This approach seems like a safe and smart way to get familiar with trading without risking real money. But does it really prepare you for the real thing? Let’s dive into the differences between paper trading and real trading and understand why the emotional aspect of real trading is so important.

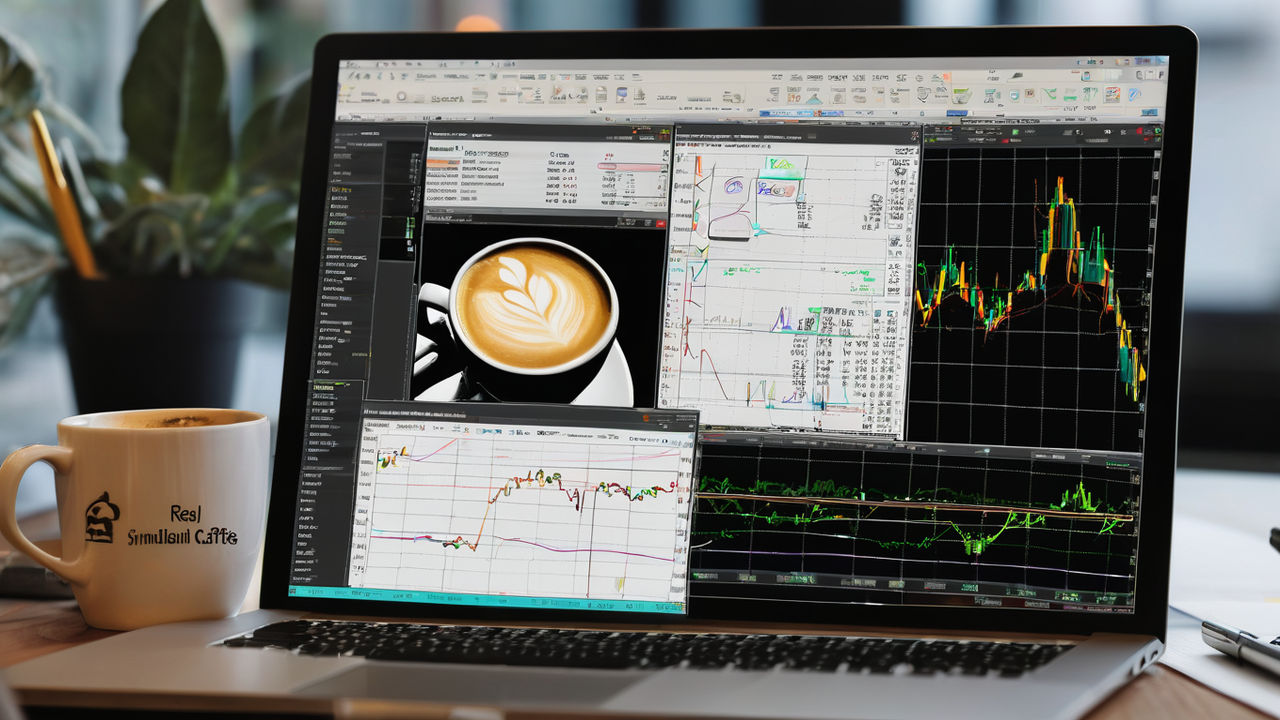
What is Paper Trading?

Paper trading, also known as mock trading, is like playing a stock market simulation game. You use virtual money to buy and sell stocks, which helps you learn the basics of trading. It’s a popular starting point because you can practice and gain experience without any financial risk.

The Benefits of Paper Trading

  • Safe Learning Environment: You can make mistakes without losing real money.
  • Understanding Mechanics: You get to know how trading platforms work and how trades are executed.
  • Strategy Testing: It allows you to test different trading strategies to see what might work without any real consequences.

The Limitations of Paper Trading

While paper trading is beneficial for beginners, it has some significant limitations:

  1. Lack of Emotional Impact: In paper trading, if you lose 20%, you might shrug it off. But in real trading, losing money can be stressful and can affect your decisions. Emotions like fear, greed, and anxiety play a huge role in real trading, but they are not experienced in paper trading.
  2. No Real Consequences: Because there’s no real money on the line, you won’t truly learn how to manage risk. In real trading, every decision can impact your financial well-being, making the stakes much higher.
  3. False Confidence: Success in paper trading can create a false sense of confidence. You might think you’re ready for real trading, but without experiencing the emotional highs and lows, you aren’t fully prepared.

Real Trading: The True Test

Real trading involves using your own money to buy and sell stocks. Here, the consequences are real, and every decision matters. This is where the real learning happens, as you deal with:

  • Emotional Reactions: Real trading tests your ability to manage emotions. For example, seeing a stock you own drop in value can be nerve-wracking, and making decisions under stress is part of the real trading experience.
  • Risk Management: You learn to handle losses and protect your capital. Cutting losses quickly, a lesson from legendary trader Jesse Livermore, is essential for long-term survival in the market.
  • Behavioral Insights: Your behavior changes when real money is at stake. You learn to be more disciplined and develop strategies that account for both market conditions and your emotional responses.

Also Read


Managing Money Wisely

One of the key aspects of successful trading is managing your money in such a way that your capital leads you to treat trading like paper trading while you are actually trading with real money. This means being disciplined, setting limits, and not letting emotions dictate your decisions. By doing so, you can approach real trading with a mindset that minimizes emotional stress and maximizes rational decision-making.

Why Emotions Matter

Stock markets are driven by human behavior, and emotions can significantly influence market trends. When the market is down, fear can lead to panic selling. Conversely, a rising market can cause greed, leading to hasty, risky decisions. Understanding and managing these emotions is crucial for successful trading.

Conclusion: The Real Value of Real Trading

While paper trading is a useful tool for learning the basics, it’s important to recognize its limitations. Real trading brings in the emotional and psychological aspects that are vital for becoming a successful trader. As Basant Maheshwari points out, understanding how you react to gains and losses, and learning to manage those reactions, is what ultimately prepares you for long-term success in the stock market.

So, if you’re serious about trading, start with paper trading to get your feet wet, but be prepared to dive into real trading to truly understand and succeed in the market. Remember, it’s not just about knowing the mechanics; it’s about managing your emotions and making informed decisions under pressure. And most importantly, manage your money in such a way that your capital leads you to treat trading like paper trading while you are actually trading with real money. This balanced approach will help you navigate the complexities of the stock market more effectively.

How to find hidden gems in the Indian Stock Market?

https://feelthecandlesticks.com/how-to-find-hidden-gems-in-the-stock-market/

Investing in the stock market can feel like navigating a maze. With so many ups and downs, it’s challenging to know where to put your money for the best returns. However, history shows that some companies, like Infosys, Wipro, and various pharmaceutical firms, have grown tremendously, transforming modest investments into substantial wealth. These companies are examples of hidden gems that can provide massive returns, even when the overall market seems stagnant.

The Reality of Uneven Prosperity

One key lesson from these success stories is that not everyone can become rich at the same time. The stock market does not distribute prosperity evenly. While some investors strike gold with certain stocks, others may not see the same level of success. This uneven distribution is a natural part of the market’s dynamics.

The Potential of Individual Stocks

Even when the overall market index, like the Nifty, seems to be going nowhere, individual stocks can still offer solid returns. This means that despite the Nifty’s dull performance over several years, there are always exceptional stocks that can provide impressive returns. For example, companies like Infosys and Wipro have grown significantly, even when the broader market was not performing well. These companies were innovating, expanding, and tapping into new markets, leading to substantial growth in their stock prices.

The Importance of Research and Strategy

Successful investing isn’t just about tracking the overall market. It’s about finding those standout companies with the potential to grow and deliver strong returns. Investors who do their research and stay informed can identify these hidden gems. This involves looking at a company’s fundamentals, such as its financial health, management quality, and growth prospects.

For instance, pharmaceutical companies have often been good investments due to their continuous innovation and the high demand for medical products. By understanding industry trends and individual company strategies, investors can make more informed decisions.

Periods of market stagnation, where the overall index doesn’t move much, can be frustrating for investors. However, these periods also present opportunities. When the market is stagnant, some investors may overlook solid companies that continue to perform well. By focusing on these companies, investors can still achieve significant returns.

Key Takeaways for Investors

  1. Look Beyond the Index: Don’t rely solely on the overall market performance. Focus on individual stocks with strong fundamentals and growth potential.
  2. Do Your Homework: Research is crucial. Understand the company’s financial health, management, and industry position. This knowledge helps in making informed investment decisions.
  3. Be Patient: Success in the stock market often requires patience. Even the best stocks can take time to deliver substantial returns.
  4. Diversify: While it’s important to find hidden gems, diversification helps manage risk. Don’t put all your money into one stock or sector.
  5. Stay Informed: Keep up with market trends and news. The stock market is dynamic, and staying informed helps you make timely decisions.

Conclusion

The stock market offers numerous opportunities, but it also comes with risks. Not everyone can become rich simultaneously, and prosperity is not evenly distributed. However, by focusing on individual stocks with strong potential, doing thorough research, and being patient, investors can navigate through market stagnation and still achieve impressive returns. The success stories of companies like Infosys, Wipro, and pharmaceutical firms show that with the right strategy, it’s possible to find hidden treasures in the stock market.

Understanding Dabba Trading and CFDs

https://feelthecandlesticks.com/what-is-dabba-trading/

Have you ever heard of “dabba trading”? It sounds a bit unusual, but it’s a serious issue in the trading world. Let’s break down what dabba trading is, how it relates to CFDs (Contracts for Difference), and whether it’s legal.

What is Dabba Trading?

Dabba trading is an illegal type of trading where deals are not recorded on the stock exchange. Instead, they happen secretly through untrustworthy brokers or websites.

These trades are not approved by any official rules, which makes them very risky and illegal.

‘Dabba’ means box. Brokers often used metal lunchboxes (called dabbas) to secretly record these off-market trades.

  • People started calling the secret stock bets “dabba trading” because the records of the trades were kept in a dabba (box) instead of being recorded by the stock market​

How Dabba Trading Works?

Dabba trading works by making stock market deals without using official stock exchanges like NSE or BSE. In this type of trading, the broker and the trader make a deal between themselves without recording it officially. No real buying or selling of shares happens. It is just a bet on the price movement.

In official stock exchanges, every trade is recorded properly, and it follows all government rules.

But in dabba trading, everything happens secretly without any record, making it illegal. Some people get involved in dabba trading by contacting local brokers who operate outside the legal system, but it is very risky and punishable by law.

Here is an easy example:


Imagine you and your friend are betting on a cricket match. Instead of going to an official place to place the bet, your friend just writes down who wins or loses. No real bet is placed anywhere. It is just between you two. This is similar to how dabba trading works. In dabba trading, no real buying or selling of shares happens on the stock market. Everything is done secretly without any official record.

What are CFDs?

Contracts for Difference (CFDs) are a type of financial product that allows traders to speculate on price movements of assets like stocks, commodities, or currencies, without actually owning the asset.

For example, if you think the price of gold is going to go up, you can enter a CFD that will pay you the difference between the current price and the future price if it does go up. If the price goes down, you pay the difference.

Dabba trading and CFDs are similar because, in both, you are betting on price changes without actually owning the assets. However, CFDs are legal and regulated in many countries, whereas dabba trading is not. Here’s how they are related:

  1. No Ownership: In both dabba trading and CFDs, you don’t actually own the underlying asset. You’re just betting on price movements.
  2. High Risk: Both involve high risk. In dabba trading, there’s the added risk of no legal recourse if things go wrong.
  3. Platform as Counterparty: In some CFD platforms, the platform itself acts as the counterparty to your trades, meaning they win when you lose. This is similar to how dabba traders operate, where they benefit from your losses.

The Dark Side of Dabba Trading

Some platforms misuse the concept of CFDs to carry out dabba trading. They attract traders with promises of easy profits and no brokerage fees, but in reality, they operate like a casino. The platform often manipulates prices, ensuring that traders lose more often than they win. These dabba trading platforms profit from client losses.

The Legality of Dabba Trading and CFDs

Dabba Trading: This is outright illegal in India. It bypasses official stock exchanges and regulatory oversight, leading to potential fraud and financial scams. Engaging in dabba trading can result in heavy penalties and legal action.

CFDs: CFDs, on the other hand, are legal in many countries but are heavily regulated. Regulators ensure that CFD providers operate fairly and transparently. However, in some regions, CFDs are banned or restricted due to their risky nature.

Why Should You Care?

Engaging in dabba trading or using unregulated CFD platforms can lead to significant financial losses. Here are some reasons to be cautious:

  1. Lack of Legal Recourse: If something goes wrong in dabba trading, you have no legal protection. Your money is essentially at the mercy of the broker.
  2. Price Manipulation: Unregulated platforms can manipulate prices to ensure you lose.
  3. High Losses: Both dabba trading and CFDs can lead to substantial losses, especially for inexperienced traders.

Final Thoughts

While dabba trading might seem like a quick way to make money, it’s illegal and full of risks. CFDs, although legal in many places, still carry high risks and require careful consideration and understanding before trading. Always trade on regulated platforms and be wary of offers that sound too good to be true. Remember, in trading, there’s no such thing as easy money.

What is Investing? – The Ultimate Beginner’s Guide

https://feelthecandlesticks.com/what-is-investing/

Investing is about growing your money over time by putting it into different assets like stocks, bonds, and real estate. The main goal is to make more money to achieve your future financial goals. This article explains how investing works, different types of investments, and important tips for beginners. By understanding these basics, you can start making informed investment decisions to build a secure financial future.

What is the real meaning of investing?

Investing is all about putting your money into something with the expectation that it will grow over time. It’s like planting a seed and hoping it will grow into a tree that bears fruit. The main idea is to put your money into things that will give you more money in return.

Imagine you buy a t-shirt from one market for ₹100 and sell it in another market for ₹250. You made a profit of ₹150, or you got a return of ₹150 on your ₹100 investment. This example shows that investing is about putting your money into something with the expectation of making a profit.

What is the general objective of Investing?

The primary goal of investing is to make money. While you can be passionate about investing, the ultimate goal is to earn more money. Everyone wants to make money to achieve their future goals.

Investing allows your money to grow over time, helping you fulfill your dreams and secure your financial future.

How Does Investing Work?

Investing works by putting your money into different financial products or assets, like stocks, bonds, real estate, or businesses. These investments can grow in value over time, and you can make money in two main ways:

  1. Appreciation: The value of the asset increases over time.
  2. Income: You earn money from the investment, like dividends from stocks or rent from real estate.

Types of Investing

There are various ways to invest your money, including:

  1. Stock Market: Buying shares of companies.
  2. Bonds: Lending money to companies or governments.
  3. Real Estate: Buying property.
  4. Mutual Funds: Pooling money with other investors to buy a diversified portfolio of stocks and bonds.
  5. Physical Assets: Investing in tangible items like gold or art.

Is the Stock Market a Good Investment?

Yes, the stock market can be a good investment. It’s considered a passive form of doing business because once you invest, your money works for you without you needing to manage the day-to-day operations of the companies you invest in.

The stock market can be a good place to invest because it offers the potential for high returns. However, it’s important to understand the risks and invest wisely.

How Does Investing in Stocks Work?

When you invest in stocks, you buy shares of a company. If the company does well, the value of your shares can increase, and you might also earn dividends, which are a portion of the company’s profits.

How to Start Investing in the Stock Market?

  1. Educate Yourself: Learn the basics of the stock market.
  2. Choose a Broker: Open a brokerage account to buy and sell stocks.
  3. Start Small: Begin with a small amount of money.
  4. Diversify: Invest in a variety of stocks to spread risk.
  5. Monitor Your Investments: Keep track of your investments and make adjustments as needed.

How to Invest Correctly?

  1. Invest Early: Starting early gives your money more time to grow and work for you, leading to potentially larger financial gains in the long run.
  2. Invest Regularly: Consistently put money into your investments.
  3. Invest for the Long Term: Focus on long-term growth rather than short-term gains.

The Bottom Line

Investing is about making your money work for you, helping you earn more and achieve your financial goals over time. By understanding the basics of investing and following key rules, you can make informed decisions and build a secure financial future.

Should a Beginner Invest in Stocks?

Yes, beginners can invest in stocks, but it’s important to learn the basics first and start with small amounts of money.

How Much Money Do I Need to Invest in Stocks?

You can start with a small amount, even as low as a few hundred rupees.

What is Price Action in trading?-12 Important Questions Answered

https://feelthecandlesticks.com/what-is-price-action-in-trading/

Ever wondered how traders make decisions without indicators? Price action trading might be the answer. It is considered a subset of technical analysis. In this article, we’ll break down what price action is, why it matters, and how you can use it to improve your trading decisions.

What is the meaning of price action?

Price action in trading simply means looking at how the price of a stock, cryptocurrency, or any financial asset moves up and down over time. Instead of relying on complicated indicators or news, traders who use price action focus directly on these price movements shown on charts. They believe that by studying how prices behave at different levels, like when they go up or down sharply or bounce off certain points, they can predict where prices might go next. This approach helps traders make decisions based on what the price itself is doing, rather than on other factors.

Who is the father of price action?

While price action trading has evolved over time with contributions from many traders, Steve Nison is often credited with popularizing candlestick charting techniques in the Western world, which are integral to price action analysis.

What is the Difference Between Price Action and Technical Analysis?

  • Price action is the movement of a stock’s price over time. Traders look at price action to make decisions based purely on the price movements.
  • Technical analysis is a broader method of studying stock prices. It includes price action, charts, patterns, and technical indicators to predict future price movements.

So, price action is just one part of technical analysis.

What is the principle of price action?

The core principle of price action is that all market information is reflected in the price, and by studying how prices move and react at different levels, traders can forecast future price movements with greater accuracy.

Traders aim to identify trends, support and resistance levels, and candlestick patterns to determine entry and exit points.

Is price action good for trading?

Yes, many traders find price action analysis effective because it simplifies decision-making and can be applied to any market or timeframe. It emphasizes understanding market psychology and interpreting candlestick patterns, chart patterns, and support/resistance levels to anticipate future price movements.

How to read price action?

To read price action, traders observe patterns in candlestick charts, such as engulfing patterns, pin bars, and inside bars, which indicate potential reversals or continuations. They also analyze trends, volatility, and volume to gauge market sentiment and make informed trading decisions.

Which indicator is best for price action?

Price action traders typically avoid traditional indicators and instead focus on interpreting raw price data. However, some use simple tools like moving averages or Fibonacci retracement levels to complement their analysis without relying heavily on them.

Which chart is best for price action?

The most commonly used charts for price action trading are candlestick charts due to their clarity in displaying price movements and patterns. These charts provide visual cues about market sentiment and help traders identify potential trade setups.

What is the best time for price action trading?

Price action strategies can be applied to any timeframe, from minutes to months, depending on a trader’s preferences and trading style. Shorter timeframes, such as 1 minute, 3 minutes, 5 minutes, 15 minutes, or even 1 hour, may offer more frequent trading opportunities but also come with many traps. On the other hand, longer timeframes, like 4 hours, daily, weekly, monthly, or even quarterly, tend to provide more reliable signals. Patterns in higher timeframes are not easy to manipulate. The higher the timeframe, the higher the probability of the pattern working

How many types of price action are there?

Price action can be categorized into various patterns and setups, such as:

  • reversal patterns (like head and shoulders, pinbars etc)
  • continuation patterns (such as triangles, marubozu pattern etc)

Each type provides different insights into market sentiment and potential price movements.

What is the primary advantage of using price action in stock trading?

The main advantage of price action trading is its simplicity and effectiveness. Price action trading is based on the idea that everything you need to know about a stock’s future direction is already shown in its price movements. This method avoids relying on complicated indicators or news, focusing instead on what the price itself is doing to make decisions. It’s straightforward and can be applied to various types of stocks and timeframes, making it a popular choice among traders.

Do professional traders use price action?

Yes, many professional traders use price action as a key part of their trading strategies. They appreciate its ability to provide clear signals and insights into market behavior without relying on complex methods. Professional traders often combine price action with other forms of analysis to enhance their trading decisions, making it an essential tool in the financial markets.

Conclusion

Price action trading is a way to trade stocks or other assets by focusing on how their prices move. Instead of using complicated indicators or news, price action traders look directly at how prices go up and down over time. They learn to spot patterns and understand why prices might change, which helps them predict where prices could go next. It takes practice to get good at this method, but once traders understand it, they can use it in different markets to make smarter trading choices. Whether you’re new to trading or have been doing it for a while, price action can be a useful approach because it’s straightforward and works across various types of markets.