With over 3 years of experience in financial markets, we focus on simplifying global and Indian markets through clear, practical insights. Our expertise also extends to the evolving landscape of digital finance, including blockchain, stablecoins, and decentralized finance (DeFi).
Order blocks are zones on price charts where big institutions place large buy or sell orders. These zones shape future price moves.
The recent investigation into Jane Street’s rapid derivatives trades shows how fast algorithms can mimic these order blocks. In this article we explain what order blocks are in simple words and how Jane Street’s microsecond trades mirror them.
Order blocks are key price zones where large players seek liquidity. Unlike the classic “last down-close candle before a rise,” true institutional order blocks often begin by inducing retail selling—creating a false bearish move to capture buy stop-losses above the high of that selling candle—then flipping into longs. Jane Street’s microsecond-level trades mirror this tactic: they engineer brief sell-off scenarios to trigger stops, then reverse into buy orders and profit from the ensuing rally.
Table of Contents
What Are Order Blocks?
Order blocks originate in Smart Money Concepts, which studies how institutions manipulate price to gain better fills and control market flow. In these concepts, an order block is a zone where smart money has clustered large buy or sell orders, leaving behind a liquidity imbalance that attracts future price tests.
Liquidity Pools Smart money hunts clusters of retail stop-loss and pending orders at obvious support or resistance levels.
Imbalance Creation When big orders execute, they leave more bids or offers on one side, setting up an imbalance that price will revisit.
Future Price Magnets Price often returns to these zones to fill remaining orders or induce further reactions.
Retail traders identify order blocks on candlestick charts using a simple pattern:
Down-Close Candle A single bearish candle that closes lower, marking where selling peaked.
Strong Reversal The next candles reverse sharply upward.
Block Zone The high or low of that first candle becomes a key support or resistance level.
Trading the Bounce When price revisits that zone, traders expect a bounce, believing institutions will defend it.
This works in slower markets but misses how institutions really exploit retail stops.
Stop-Loss Hunting: The Institutional Trap
Rather than waiting for a natural reversal, institutions often hunt stop-losses by creating brief false moves. This process has three steps:
Induce Retail Selling Institutions push price down to a known support area. Retail traders sell, placing their stop-loss orders just above the high of the bearish candle.
Trigger Buy Stops After traders commit to shorts, institutions reverse and drive price up to hit those buy stop-loss orders clustered there. This creates sudden liquidity.
Flip into Long Positions With buy stops triggered, institutions accumulate long positions at a better average price and let the market continue upward.
This is the true “order block” behavior: create a fake bearish zone, trap shorts, then go long.
Corrected Algo Order Block: Step-by-Step
Phase
Institutional Action
Retail Reaction
Sell-Off Trap
Place large sell orders at a support level to push price down into a known demand zone.
Traders short the dip, setting stop-loss orders above the bearish candle’s high.
Stop-Hunt Rally
Reverse: buy aggressively to lift price back above the candle high and trigger buy stops.
Short-position stop-losses are triggered, adding more buy orders and fueling the upswing.
Long Accumulation
Use the liquidity from triggered stops to build a significant long position at a good price.
Retail traders miss the move or cover shorts too late, suffering losses.
Continuation or Exit
Allow the market to drift higher or exit positions after creating a new support zone.
Traders look to the former candle zone now turned support—a textbook order block bounce.
This cycle can occur in milliseconds when driven by high-frequency algorithms.
Jane Street’s Microsecond Manipulation
In early 2025 the National Stock Exchange began probing certain F&O trades by Jane Street Singapore Pte. Its surveillance system flagged a series of rapid trades where positions were opened and then reversed with the same counterparties within seconds. These reversals occurred at prices markedly above or below the prior trade price.
The NSE issued a notice in January to the custodian bank overseeing Jane Street’s trades. In their reply both the custodian and Jane Street explained these were fully automated algorithmic trades with no human intervention and asserted there was no malicious intent.
Sources indicate that fast trading firms often rely on multiple AI models. Sometimes different models take opposing views on microsecond price moves, resulting in quick flip trades. Jane Street is not alone—several other foreign portfolio investors have received similar notices and are responding to the exchange.
Meanwhile Jane Street’s India business has grown rapidly. Its funds now carry large exposures in Indian derivative markets. This probe highlights how high‑speed trading algorithms can produce sudden, large order flows that attract regulatory scrutiny.
Why This Matters for Retail Traders
Invisible Zones Micro-order blocks live and die in milliseconds. Standard charting tools won’t show them.
Unseen Manipulation Traders assume the “last down-close candle” is genuine institutional activity. In fact, it may be a crafted trap.
True institutional order blocks are not just zones of past bulk orders. They often begin with a false bearish move designed to trigger buy stop-losses above a selling candle’s high. The resulting liquidity lets smart money flip into long positions at optimal prices. Jane Street’s microsecond strategies embody this concept, highlighting how speed and intent shape modern markets.
Disclaimer: This article is provided for informational and educational purposes only and is not intended as an inducement or recommendation to trade. Always conduct your own research and consult a qualified financial advisor before making any investment or trading decisions.
With over 3 years of experience in financial markets, we focus on simplifying global and Indian markets through clear, practical insights. Our expertise also extends to the evolving landscape of digital finance, including blockchain, stablecoins, and decentralized finance (DeFi).
Imagine a bank that not only manages your money but also rewards you for trusting it. A bank that consistently performs well year after year and quietly shares its success with its loyal investors.
Well, one of India’s top PSU banks has done just that. It recently declared its Q4 results for FY2024-25 and announced a dividend that could make shareholders smile.
Let’s first understand why this dividend announcement is so important — and then we’ll reveal the bank and all the details you need to know.
About the Bank
This bank is widely trusted in India, especially in rural and semi-urban areas. With a market capitalisation of around ₹1.15 lakh crore, it has continued to deliver steady growth and take care of its shareholders through consistent dividends.
Now let’s come to the big reveal.
Bank of Baroda Declares ₹8.35 Dividend for FY2024-25
Yes, it’s Bank of Baroda — the public sector giant that has again impressed with solid profits and a rewarding dividend.
Here’s what the bank announced:
Company Name
Bank of Baroda (BoB)
Sector
Public Sector Bank
Dividend Declared
₹8.35 per share
Face Value
₹2 per share
Dividend Type
Final Dividend
Ex-dividend Date
5 June 2025
Record Date (Cut-off Date)
6 June 2025
Dividend Status
Awaiting approval in AGM
AGM (Annual General Meeting)
29th AGM
Only shareholders who hold shares as on 6th June 2025 will be eligible for this dividend.
Bank of Baroda’s Q4 performance shows resilience and consistency, even in a competitive banking space:
Metric
Q4FY25
Q4FY24
Change
Net Profit
₹5,048 crore
₹4,886 crore
+3.3%
Interest Income
₹30,642 crore
₹29,583 crore
+3.6%
Net Interest Income (NII)
₹11,020 crore
₹11,793 crore
–6.6%
While NII dipped slightly, overall profit still improved — which shows better operational efficiency and profitability.
What’s the Difference Between Interest Income and Net Interest Income?
Interest Income refers to the total money a bank earns from lending activities like loans, advances, etc.
Net Interest Income (NII) is the difference between the interest earned from loans and the interest paid to depositors.
Bank of Baroda Dividend History (Past 5 Years)
Ex-Date
Dividend Amount (₹/share)
28 June 2024
₹7.60
30 June 2023
₹5.50
17 June 2022
₹2.85
22 June 2017
₹1.20
16 June 2015
₹3.20
This clearly shows a steady rise in dividend payouts, especially in the last 3 years.
Will I Have to Pay Tax on the Dividend?
Yes. Here’s how taxation works:
The dividend will be added to your total income.
It will be taxed as per your income tax slab.
If total dividend income exceeds ₹5,000 per year, TDS at 10 percent will be deducted.
Final Thoughts
Bank of Baroda continues to prove itself as a strong and stable PSU stock. It has a combination of consistent growth, improving profits, and generous dividends.
Disclaimer: This article is purely intended for informational and educational purposes. It does not constitute financial advice or a recommendation to buy, sell, or hold any financial instrument. The author is not a SEBI-registered financial advisor. Readers are strongly advised to consult with a certified financial advisor before making any investment or financial decisions.
With over 3 years of experience in financial markets, we focus on simplifying global and Indian markets through clear, practical insights. Our expertise also extends to the evolving landscape of digital finance, including blockchain, stablecoins, and decentralized finance (DeFi).
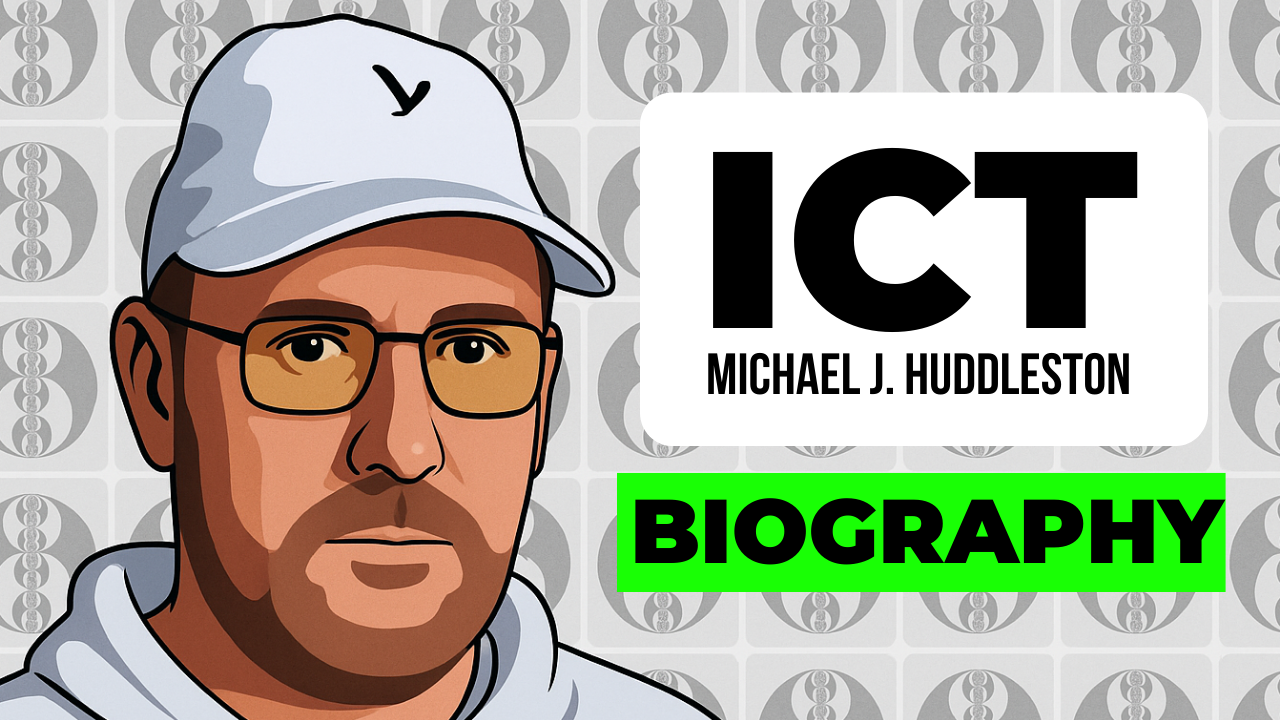
Michael J. Huddleston is better known as The Inner Circle Trader or ICT. He calls himself mentor of mentors in forex and price action. He created the Smart Money Concepts (SMC) methods. He has over 30 years of experience. He shares free lessons on YouTube and his website. Many traders use his ideas in forex and crypto. This article covers his real name, background, SMC ideas, and how they apply to Bitcoin.
The Inner Circle Trader is a popular name in trading. His real name is Michael J. Huddleston. He teaches how to read market moves with simple rules. He calls his approach Smart Money Concepts or SMC. This helps traders see where big players act.
Completed high school; studied trading under Larry Williams, Richard Dennis
Early Life
Grew up in St. Joseph, Michigan
Wife
Not publicly disclosed
Children
1. Caleb 2. (to be updated)
Michael J. Huddleston grew up in St. Joseph, Michigan. After finishing high school, he worked various jobs, including servicing vending machines.
His uncle introduced him to futures and options trading, inspiring his first steps in finance. Intrigued by the potential to build wealth, Huddleston enrolled in trading courses taught by experts such as Larry Williams and Richard Dennis. Although he faced losses in his early trades, he persevered by studying market patterns and refining his skills.
Who invented ICT concepts?
Michael J. Huddleston developed his own unique style of reading price action. Over time, his teachings became known as ICT concepts or ICT-SMC concepts. So, without any doubt, he can be called the inventor of ICT concepts.
What is ICT’s real name?
ICT stands for Inner Circle Trader. But his real name is Michael J. Huddleston. He chose ICT as his brand name.
The Inner Circle Trader-YouTube Channel
ICT runs a free YouTube channel with over one million subscribers as of 2025. He shares videos on order blocks, fair value gaps, and market structure.
He often says, “I am the mentor of your mentor.”
How Much Does ICT (Michael J. Huddleston) Earn from YouTube?
There is no exact information available about the YouTube earnings of ICT (Michael J. Huddleston), but we can make a rough estimate using a tool called Social Blade. Social Blade is a free online platform that gives data about YouTube channel performance, such as total views and estimated income.
According to Social Blade, ICT’s channel gets around 3 million views every month, and his estimated monthly earnings range between $1,000 and $12,000. This range is based on general ad revenue estimates.
But we can try to guess a more accurate number. ICT’s channel is in the finance or trading category, and channels in this niche usually earn more per 1,000 views. This rate is called RPM (Revenue Per Mille), which means how much a creator earns for every 1,000 views.
In the United States, finance-related YouTube channels can earn anywhere from $5 to $25 RPM, depending on factors like where the audience is from, how they engage with the content, and what kind of ads are shown.
If we assume a conservative RPM of $5, and multiply that by 3 million views, ICT could be earning around $15,000 per month from YouTube ads alone.
So it’s fair to say that he likely earns more than $12,000 per month just from YouTube advertisements.
Smart Money Concepts (SMC)
Smart Money Concepts are a series of rules that reveal how large institutions operate in the markets. The main ideas include:
Market Structure: ICT teaches how to identify trends, consolidation, and key levels by studying swing highs and lows. Proper structure analysis helps traders align themselves with the dominant market direction.
Order Blocks: These are specific zones where banks and hedge funds place large buy or sell orders. When price returns to these zones, it often reverses or accelerates in the original direction.
Fair Value Gaps (FVGs): Also called voids, FVGs are gaps between candles on a chart. They represent areas where price moved too quickly, leaving behind unfilled orders. Traders expect price to revisit these zones before continuing.
Liquidity Pools: These are areas just above swing highs or below swing lows where many stop orders accumulate. Institutions often trigger these pools to fuel larger moves.
Does ICT-SMC Work in the Stock Market?
ICT’s core principle lies in the concept of liquidity, also known as stop-loss hunting. Whether in the US stock market (Dow Jones, S&P 500, NASDAQ), Indian markets (Bank Nifty, Nifty 50 F&O), or European markets (FTSE 100), ICT-SMC applies everywhere. One needs to practice well in live markets and develop an intuition for what each candle is telling you.
By applying these tools, traders learn to enter and exit positions with greater confidence and precision.
Does ICT SMC Apply to Bitcoin?
ICT does not trade crypto himself. He is usually negative on crypto trading. Despite that, many students use his SMC ideas on Bitcoin charts.
They track Order Blocks and liquidity. Traders say the rules still work on crypto, but some think not all rules fit the volatile crypto markets.
Michael J. Huddleston, the Inner Circle Trader, transformed how retail traders view price action by revealing the hidden moves of institutional players. His Smart Money Concepts offer a step-by-step roadmap for spotting high-probability trade setups. While no method guarantees success, countless traders credit ICT’s teachings for improving their confidence and results. Whether you trade forex, stocks, or Bitcoin, understanding SMC can be a powerful addition to your toolkit.
What is ICT?
ICT means Inner Circle Trader. It is Michael Huddleston’s brand.
Who is Michael J. Huddleston?
He is a trader and mentor from Michigan with over three decades of market experience.
Who owns the ICT strategy?
Michael J. Huddleston owns ICT and the SMC methods
This article was compiled with the utmost care but does not guarantee complete accuracy. Details like age, net worth, education, and personal life may be incomplete or change over time. Corrections or updates will be made whenever new or more accurate information becomes available.
This article is for informational purposes only and should not be considered financial advice. Investing in stocks, cryptocurrencies, or other assets involves risks, including the potential loss of principal. Always conduct your own research or consult a qualified financial advisor before making investment decisions. The author and publisher are not responsible for any financial losses incurred from actions based on this article. While efforts have been made to ensure accuracy, economic data and market conditions can change rapidly. The author and publisher do not guarantee the completeness or accuracy of the information and are not liable for any errors or omissions. Always verify data with primary sources before making decisions.
With over 3 years of experience in financial markets, we focus on simplifying global and Indian markets through clear, practical insights. Our expertise also extends to the evolving landscape of digital finance, including blockchain, stablecoins, and decentralized finance (DeFi).
Skechers U.S.A., Inc. (NYSE: SKX) has announced a landmark $9.4 billion acquisition by investment firm 3G Capital, marking its transition to a privately held company. The deal, set to reshape the footwear giant’s future, will lead to its delisting from the New York Stock Exchange. Here are five critical details shareholders and investors need to know:
Table of Contents
1. Acquisition Triggers Delisting
3G Capital will acquire Skechers for $63.00 per share in cash, a 30% premium over its 15-day average stock price. The transaction, approved unanimously by Skechers’ board, is expected to close in Q3 2025. Post-closure, Skechers’ shares will be delisted, ending its 30-year run as a publicly traded company. The move reflects a growing trend of firms opting for private ownership to avoid public market pressures.
2. Shareholder Options: Cash or Equity in a Private Entity
Shareholders have two payment options:
$63.00 per share in cash (immediate liquidity).
$57.00 in cash + one unlisted, non-transferable equity unit in the new private parent company.
Notably, founder Robert Greenberg and family have committed to the mixed payment, signaling confidence in Skechers’ private future. However, the equity units lack liquidity, meaning shareholders cannot trade them publicly—a key consideration for investors seeking flexibility.
3. Leadership and Strategy Remain Unchanged
Skechers will continue under CEO Robert Greenberg and its current management team, with headquarters staying in Manhattan Beach, California. The company plans to maintain its focus on international expansion, direct-to-consumer growth, and innovation. Going private may allow Skechers to pursue long-term strategies without quarterly earnings scrutiny, potentially accelerating initiatives like global distribution and technology investments.
4. Strong Financials and Deal Rationale
Skechers reported record 2024 revenue of $9 billion ($640 million net earnings), underscoring its robust market position. The acquisition at a premium suggests 3G Capital sees untapped value, possibly in Skechers’ 15% revenue exposure to China and its wholesale growth potential. Delisting could provide operational flexibility amid challenges like U.S. tariffs (not addressed in the release) and shifting trade dynamics.
5. Navigating Risks as a Private Company
While privatization offers advantages, Skechers faces external headwinds:
Trump-era tariffs impacting shoemaking costs.
Dependence on China for 15% of revenue (per FactSet).
As a private entity, Skechers may mitigate these risks through strategic adjustments away from public scrutiny. However, shareholders opting for equity units must trust management’s ability to navigate these challenges without the transparency of public reporting.
Skechers’ stock surged 25% pre-market to $61.78 following the announcement.
The deal underscores confidence in the brand’s resilience and growth prospects.
Shareholders must decide between immediate cash or illiquid equity by the Q3 2025 closure.
As Skechers transitions to private ownership, stakeholders should weigh liquidity needs against long-term faith in the company’s vision. For the broader market, this acquisition highlights the evolving landscape where firms increasingly seek refuge from public market volatility.
Disclaimer: The views and opinions expressed in this article are solely those of the author and are intended for informational purposes only. They do not constitute financial, investment, or trading advice. Any stock price predictions mentioned are purely speculative and based on personal analysis. Past performance is not indicative of future results. Readers are advised to conduct their own research and, if necessary, consult a certified financial advisor before making any investment decisions. The author does not accept any liability for financial losses or gains arising from the use of this content.
What is 3G Capital?
3G Capital is a global private investment firm known for acquiring and managing consumer-focused brands with long-term growth potential. Founded in 2004, it has built a reputation for partnerships with iconic companies, emphasizing operational efficiency, cost discipline, and strategic expansion.
With over 3 years of experience in financial markets, we focus on simplifying global and Indian markets through clear, practical insights. Our expertise also extends to the evolving landscape of digital finance, including blockchain, stablecoins, and decentralized finance (DeFi).
The Board of Directors of Kalyani Steels met on 5 May 2025 and recommended a final dividend of ₹ 10.00 per equity share (face value ₹ 5), or 200% of face value, for the financial year 2024-25. Below are all the key details you need to know.
Company Overview
Field
Details
Company Name
Kalyani Steels Limited
Stock Symbol
BSE: 542976 · NSE: KSTEEL
IPO Year
2003
Stock Exchange
BSE, NSE
Market Cap
₹ 6,500 crore (approx. May 2025)
Founder
Bharat Forge Group
Incorporation
2003
Headquarters
Pune, Maharashtra, India
Sector
Metals & Mining
Industry
Steel Manufacturing
Specialization
Alloy Steels, Stainless Steels
Kalyani Steels is part of the Bharat Forge Group. It produces high-strength alloy and stainless steel. The company serves automotive, oil, gas and engineering sectors globally.
Table of Contents
Kalyani Steels Dividend 2025 – Important Dates
Kalyani Steels Dividend 2025 Announcement Date
5 May 2025
Kalyani Steels Dividend Type
Final Dividend
Kalyani Steels Dividend Amount
₹ 10.00 per equity share
Kalyani Steels Ex-Dividend Date
to be updated
Kalyani Steels Record Date
to be updated
Kalyani Steels Payment Date
to be updated
Record Date: The cut-off date set by the company to determine which shareholders are eligible to receive the dividend. Only those who own shares on this date get the dividend.
Ex-Dividend Date: Usually one business day before the Record Date. If you buy shares on or after the Ex-Dividend Date, you will not be eligible for the dividend.
Note: Shareholders on record by the Record Date are eligible for the dividend.
Since April 2020, dividends are taxable in the hands of shareholders. If your total dividend income exceeds ₹ 5,000 in a year, Kalyani Steels will deduct 10% TDS at source. You can submit a lower‑tax deduction certificate if eligible. Make sure to include all your dividend income when filing your annual tax return.
Q4 FY25 Results – Highlights
Particulars
Q4 FY25
Q4 FY24
Profit After Tax
₹ 79.28 crore
₹ 62.53 crore
Profit Before Tax (PBT)
₹ 107.14 crore
₹ 84.39 crore
Revenue from Operations
₹ 544.33 crore
₹ 503.15 crore
Total Expenses
₹ 449.94 crore
₹ 431.40 crore
Other Expenses
₹ 278.76 crore
₹ 209.43 crore
Raw Material Costs
₹ 112.30 crore
₹ 103.58 crore
Employee Benefit Expenses
₹ 58.88 crore
₹ 52.79 crore
Kalyani Steels reported a 26.75% rise in net profit. Revenue grew by 8.25%, while expenses increased 4.28%. Other costs jumped sharply by 33.10%.
Key Financial Metrics
Metric
Value
Market Capitalisation
₹ 6,500 crore
Return on Equity (ROE)
15.10%
Price-to-Earnings (P/E) Ratio
12.00
Price-to-Book (P/B) Ratio
1.80
Industry P/E Ratio
14.50
Industry P/B Ratio
2.10
EPS (TTM)
₹ 48.50
Kalyani Steels delivered strong margins and improved profitability in Q4 FY25. Its valuation ratios remain attractive compared to industry peers.
Disclaimer: This article is purely intended for informational and educational purposes. It does not constitute financial advice or a recommendation to buy, sell, or hold any financial instrument. The author is not a SEBI-registered financial advisor. Readers are strongly advised to consult with a certified financial advisor before making any investment or financial decisions.
With over 3 years of experience in financial markets, we focus on simplifying global and Indian markets through clear, practical insights. Our expertise also extends to the evolving landscape of digital finance, including blockchain, stablecoins, and decentralized finance (DeFi).
Along with its audited financial results for the fourth quarter (Q4 FY25) and the year ended 31 March 2025, Mahindra & Mahindra Ltd. has approved a final dividend of ₹ 25.30 per equity share (face value ₹ 5), or 506% of face value. Below are all the key details you need to know.
Company Overview
Company Name
Mahindra & Mahindra Ltd.
Stock Symbol
BSE: 500520 · NSE: M&M
IPO Year
1945 (as a tractor manufacturer)
Stock Exchange
BSE, NSE
Market Cap
₹ 1.85 lakh crore (approx. May 2025)
Founder
J.C. Mahindra & K.C. Mahindra
Incorporation
1945
Headquarters
Mumbai, Maharashtra, India
Sector
Automobiles & Farm Equipment
Industry
Automotive & Agricultural Machinery
Key Products & Services
SUVs, Tractors, Commercial Vehicles, Electric Vehicles
Mahindra & Mahindra is a leading Indian automaker and farm-equipment maker. It has a global presence in over 100 countries. It makes SUVs, tractors, and electric vehicles. The company is known for innovation and a strong market share.
Table of Contents
Mahindra Dividend 2025 – Important Dates
Mahindra & Mahindra Dividend 2025 Announcement Date
5 May 2025
Mahindra & Mahindra Dividend Type
Final Dividend
Mahindra & Mahindra Dividend Amount
₹ 25.30 per equity share
Mahindra Dividend 2025 Ex-Dividend Date
3 July 2025
Mahindra Dividend 2025 Record Date
4 July 2025
Mahindra Dividend 2025 Payment Date
After 31 July 2025
Note: Shareholders recorded in the books by the Record Date are eligible to receive the dividend.
Mahindra & Mahindra has steadily increased dividends over recent years. It shows the company shares profits with its investors.
How to Receive Your Dividend
You do not need to apply separately. Your depository and the company will handle it automatically.
Beneficial Owners: Names on the NSDL/CDSL list as of 4 July 2025.
Registered Members: If your shares are held in physical form, then your name must be in the company’s official Register of Members by 4 July 2025. This requires that any transfer requests were fully processed by that date.
After 31 July 2025, Mahindra & Mahindra will credit the dividend to your bank account or dispatch a cheque.
Book Closure Period
The Register of Members and Share Transfer Books will remain closed from 5 July 2025 to 31 July 2025 (both days inclusive).
Any valid transfer requests must reach the Registrar by 4 July 2025 to be processed before book closure.
Mahindra & Mahindra reported a 13.34% rise in profit after tax. Revenue grew by 20.5%. Expenses also increased. Vehicle sales rose 18% and tractor sales increased 23% compared to Q4 FY24.
Key Financial Metrics
Metric
Value
Market Capitalisation
₹ 1,85,000 crore
Return on Equity (ROE)
12.50%
Price-to-Earnings (P/E) Ratio
18.00
Price-to-Book (P/B) Ratio
3.20
Industry P/E Ratio
26.10
Industry P/B Ratio
3.75
5-Year Stock Return
210.00%
EPS (TTM)
₹ 140.50
Mahindra & Mahindra has shown consistent growth and strong returns in recent years. When compared to the industry averages, its P/E ratio is lower, which could mean the stock is relatively undervalued. Similarly, its P/B ratio is also below the industry average, indicating potentially better value for long-term investors.
Why This Matters A high dividend reflects strong profits and rewards investors. It can also attract new buyers to the stock.
Disclaimer: This article is for informational purposes only. It does not constitute financial advice. Consult a certified financial advisor before making investment decisions.
With over 3 years of experience in financial markets, we focus on simplifying global and Indian markets through clear, practical insights. Our expertise also extends to the evolving landscape of digital finance, including blockchain, stablecoins, and decentralized finance (DeFi).
Warren Buffett, who is now 94 years old, shared both investing insights and personal advice at the 2025 Berkshire Hathaway annual meeting. While his investment lessons remind us to stay patient and focused on value, his life lessons push us to prioritize happiness, pursue work we love, and surround ourselves with the right people. These tips can transform how we think about our careers and personal well-being.
Table of Contents
Event Highlights
The 2025 Berkshire Hathaway annual meeting took place on May 3, 2025, in Omaha, Nebraska. Known as the “Woodstock for Capitalists,” the event featured four and a half hours of Q&A with Buffett and his executives. Attendees and viewers around the world tuned in to hear his views on markets, the economy, and life.
Greg Abel – To Be the Next CEO of Berkshire Hathaway
At the 2025 meeting, Warren Buffett made a big announcement. He said that Greg Abel will become the new CEO of Berkshire Hathaway by the end of 2025.
The transition is expected to be completed by early 2026. Buffett, who is now 94 years old, shared that he had first discussed this with only two board members.
During the meeting, he said, “The time has arrived where Greg should become the chief executive officer of the company at year-end.” Buffett also mentioned that while he will still be involved, Greg Abel will be in charge of running the company and making important financial decisions.
4 Important Life Lessons by Warren Buffett from 2025
While Buffett’s investing wisdom guides how we grow wealth, his personal advice offers a roadmap for a fulfilling life.
1. Happiness Means Longevity
“A happy person lives longer than someone doing things they don’t admire much,” Buffett said, highlighting that joy in life boosts well-being and may even extend lifespan.
2. Choose Work You Love
Buffett advised young people to find work they’d do even without pay. He explained that loving your work makes every day rewarding and reduces stress over money.
3. Surround Yourself with the Right People
“Who you associate with is enormously important. You will move in the direction of those you admire and call friends,” Buffett said. Good company not only aids career success but shapes who you become.
4. Stay Optimistic and Resilient
Despite global challenges and political risks, Buffett remains bullish on America’s future. He described being born in the U.S. as his greatest luck and urged confidence in the country’s ability to overcome crises.
A Glimpse of Investment Lessons by Warren Buffett (Brief Overview)
Market Volatility: Buffett reminded investors that recent swings are normal. He noted that Berkshire’s stock was halved three times in sixty years, yet the company thrived through each cycle.
Cash and Opportunities: With a record cash hoard of $347 billion, Berkshire is ready to act when good deals arise. Buffett said he’d deploy up to $100 billion for the right opportunity in the next five years.
Long-Term Holdings: He committed to holding Japanese stocks for at least fifty more years, emphasizing the value of patient investing.
Warren Buffett’s 2025 meeting gave us more than tips on when to buy or sell stocks. His life-changing advice reminds us to seek happiness, passion, and the right circle of influence. These lessons can open our eyes to what truly matters beyond the numbers on a screen.
Who is Greg Abel?
Greg Abel is a Canadian businessman born on June 1, 1962, in Edmonton, Alberta. His full name is Gregory Edward Abel. He currently serves as the chairman and CEO of Berkshire Hathaway Energy and the vice-chairman of non-insurance operations at Berkshire Hathaway, a role he has held since 2018.
What is the net worth of Greg Abel?
Gregory Abel’s estimated net worth is approximately $484 million.
What is the age of Warren Buffett?
Warren Buffett is now 94 years old.
Disclaimer: This article is purely intended for informational and educational purposes. It does not constitute financial advice or a recommendation to buy, sell, or hold any financial instrument. Readers are strongly advised to consult with a certified financial advisor before making any investment or financial decisions.
With over 3 years of experience in financial markets, we focus on simplifying global and Indian markets through clear, practical insights. Our expertise also extends to the evolving landscape of digital finance, including blockchain, stablecoins, and decentralized finance (DeFi).
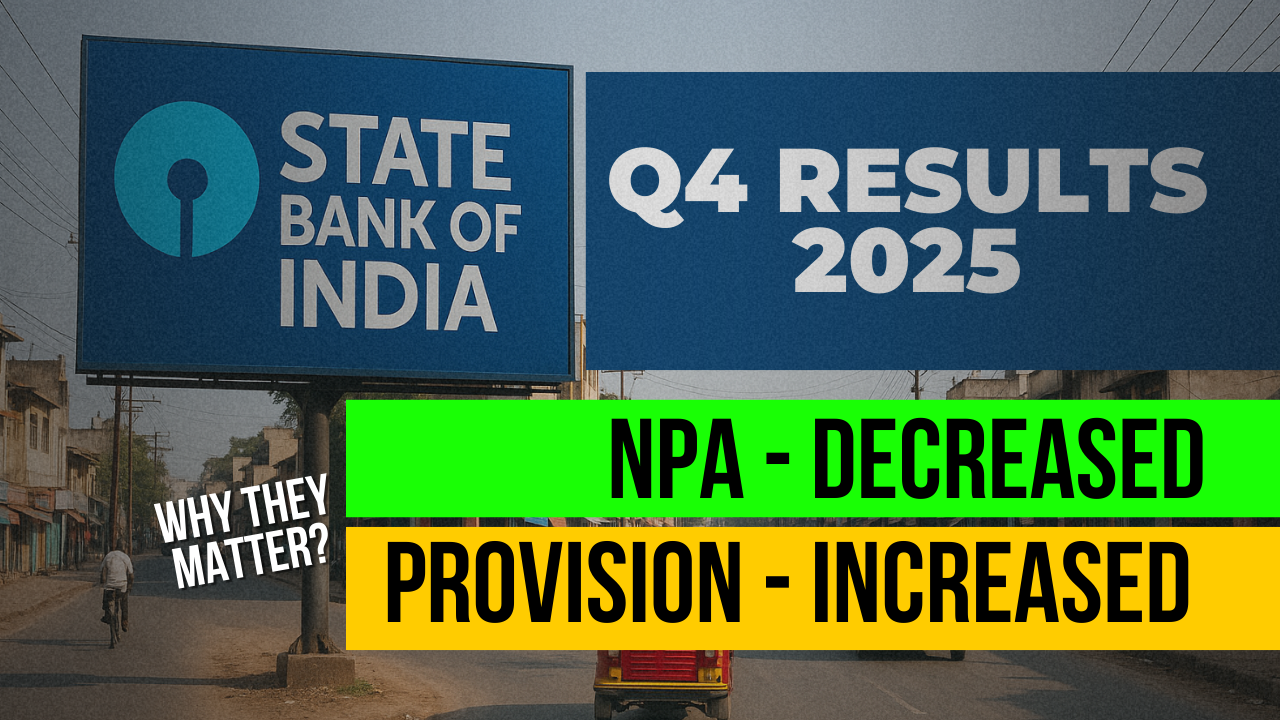
This article is written in the context of State Bank of India’s Q4 results for FY25, where the bank’s gross non-performing assets (NPAs) fell to 1.82% of total advances, indicating that fewer loans are going unpaid. At the same time, SBI’s provisions for bad loans rose by nearly 300% to ₹6,442 crore.
Revenue
₹42,775 crore
₹41,655 crore
Operating Profit
₹31,286 crore
₹28,748 crore
Net Profit
₹18,643 crore
₹20,698 crore
Provisions
₹6,442 crore
₹1,608 crore
Provisions (QoQ)
₹6,442 crore
₹911 crore
Gross NPA (%)
1.82%
2.07% (Q3 FY25)
State Bank of India, the country’s largest bank in terms of assets and deposits, currently holds a market valuation of approximately ₹7,14,014.23 crore. The bank’s shares are trading at a price-to-earnings (P/E) ratio of 9.00, reflecting the multiple investors are willing to pay for its earnings. Over the past five years, SBI’s stock has appreciated by 319.95%, supported by strong financial performance. The earnings per share (EPS) for the trailing twelve months stand at ₹81.75, with a consistent growth rate of 20.56% recorded during the same period.
Below, we explain NPAs and provisions in simple terms and use an example of a small bank to make it clear.
Table of Contents
What Are NPAs?
Simple Definition
See, money is also an asset as it provides economic benefit to the bank in the future. So, non-performing assets or simply called NPA is that money that becomes unable to bring interest to the bank.
Non-Performing Assets (NPAs) are loans where the borrower has stopped paying interest or principal for 90 days or more, or the bank thinks they won’t be repaid in full.
Sometimes NPAs are also called bad loans since they stop generating income for the bank and need special handling.
Why Declining NPAs Matter
Declining NPA simply means the bank is getting interest on the money it has given as a loan, which can lead to banks making more profits.
In technical terms:
When NPAs fall, it means:
Fewer troubled loans: The bank has made better quality loans that customers are repaying on time.
What Are Provisions?
If a bank has a doubt or is almost sure that some part of the total loan it has given to borrowers is not going to come back to the bank (let alone interest), it sets aside some security amount out of its past profit just to offset those bad loans. Those are called provisions.
Provisions lead to reductions in a bank’s retained profits.
Simple Definition in Technical Terms
Provisions for bad loans are money the bank sets aside from its profits to cover loans that might go bad in the future.
In accounting, provisions show up as an expense, reducing the bank’s reported profit because these funds are reserved rather than kept as earnings.
Why Rising Provisions Can Hurt
When a bank increases its provisions:
Lower reported profits: More money is parked in a reserve account, so there’s less profit left to distribute or reinvest.
Signal of caution: It may imply the bank expects more loans to turn bad soon, which can worry investors even if current NPAs are low.
However, provisions are also a sign of responsible and cautious banking. If a bank doesn’t make enough provisions and loans turn bad later, it could hurt the bank’s stability. So, provisions are not always bad—they show the bank is preparing for possible risks.
Putting It All Together with a Simple Bank Example
Imagine a small bank, EasyBank, with:
Total loans of ₹100 crore
Initially, ₹3 crore in NPAs (3% of loans)
It sets aside ₹1 crore as provisions.
Scenario A: NPAs fall
NPAs drop from ₹3 crore to ₹1.82 crore (1.82% of ₹100 crore).
This is great: fewer bad loans, more money coming in from interest.
Scenario B: Provisions rise
EasyBank sees early signs that some newer loans might go bad, so it raises provisions from ₹1 crore to ₹4 crore.
Even though NPAs are low, ₹3 crore extra is taken out of profit and held in reserve.
Result: reportable profit falls since ₹4 crore is an expense, not earnings.
Why SBI’s Q4 FY25 Looks This Way
Gross NPAs at SBI fell to 1.82% of advances (loans), marking healthier loan quality.
But SBI boosted its bad-loan provisions to ₹6,442 crore, reducing net profit for the quarter.
In simple terms: Lower NPAs mean the bank’s loan book is cleaner, while higher provisions mean the bank is being extra cautious and setting aside more money—good for safety but not for short-term profits.
Conclusion
The more NPA drops, the better it is for a bank.
But higher provisions are not always bad. They reduce short-term profit but also show that the bank is being careful and preparing for possible future risks. So, the best situation is when NPAs are low and provisions are made wisely based on risk.
In banking, “advances” refers to the total amount of money that a bank has lent to its customers. Whenever we talk about NPAs as a percentage of advances, we are comparing bad loans to the bank’s entire loan book, that is, all the loans the bank has given out.
Disclaimer: This article is purely intended for informational and educational purposes. It does not constitute financial advice or a recommendation to buy, sell, or hold any financial instrument. The author is not a SEBI-registered financial advisor. Readers are strongly advised to consult with a certified financial advisor before making any investment or financial decisions.
With over 3 years of experience in financial markets, we focus on simplifying global and Indian markets through clear, practical insights. Our expertise also extends to the evolving landscape of digital finance, including blockchain, stablecoins, and decentralized finance (DeFi).
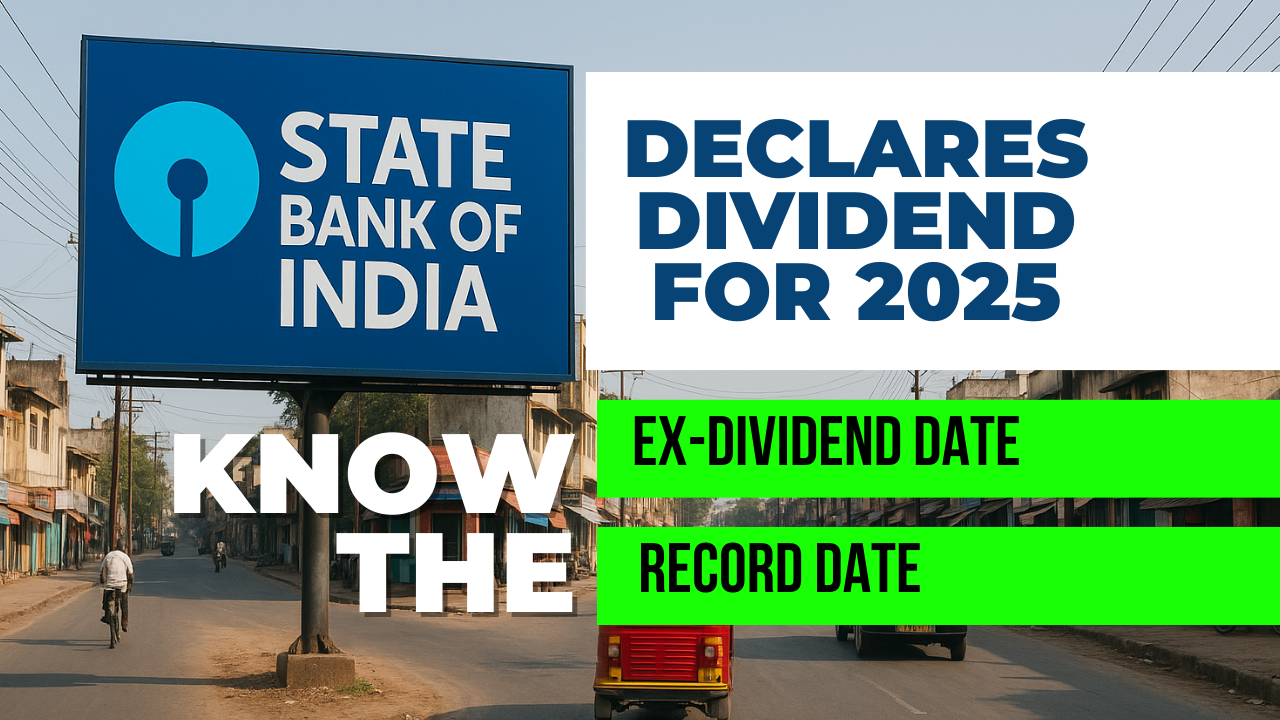
Along with its audited financial results for the fourth quarter (Q4 FY25) and the financial year ended 31 March 2025, the State Bank of India (SBI) has officially announced the SBI Dividend 2025. Despite a decline in profits, the bank has declared an impressive final dividend of ₹15.90 per equity share for its shareholders. The announcement also includes key details such as the SBI Dividend 2025 record date, and the dividend payment date.
About SBI (Company Overview)
Company Name
State Bank of India
Stock Symbol
BSE: 500112 NSE: SBIN
IPO Year
1997 (Listed as a public sector bank)
Stock Exchange
BSE, NSE
Market Cap
₹ 7.75 lakh crore (approximate as of May 2025)
Founder
Government of India (as Imperial Bank in 1921, renamed SBI in 1955)
Incorporation
1955
Headquarter
Mumbai, Maharashtra, India
Sector
Financial Services
Industry
Banking
Specialization
Retail banking, Corporate banking, Insurance, Asset management, Loans, Digital banking
State Bank of India(SBI) is the largest public sector bank in India. It began in 1806 as the Bank of Calcutta. In 1955 the government took charge and renamed it State Bank of India. Its head office is in Mumbai. SBI has over 22 000 branches and 63 000 ATMs across India. It serves more than 500 million customers. SBI also works in 36 countries. It offers savings and current accounts, loans, credit cards, insurance and investment services. It has many units like SBI Life, SBI Mutual Fund and SBI Cards. The Reserve Bank of India calls SBI a systemically important bank. It plays a key role in the Indian economy and leads in digital banking services.
Table of Contents
State Bank of India dividend 2025 – Important Dates
State Bank of India Dividend 2025 Announcement Date
3 May 2025
Type of Dividend
Final Dividend
Dividend Amount
₹15.90 per equity share
SBI ex-dividend date 2025
15 May 2025
SBI dividend record date 2025
16 May 2025
SBI dividend payment date 2025
30 May 2025
The record date for SBI’s 2025 dividend is set at 16 May 2025.
The ex-dividend date for SBI’s 2025 dividend is likely 15 May 2025.
The dividend payment date for SBI’s 2025 dividend is scheduled for 30 May 2025.
Record Date: The cut-off date set by the company to determine which shareholders are eligible to receive the dividend. Only those who own shares on this date get the dividend.
Ex-Dividend Date: Usually one business day before the Record Date. If you buy shares on or after the Ex-Dividend Date, you will not be eligible for the dividend.
Before the SBI dividend 2025 announcement, SBI’s dividend history shows steady growth over the years. This means SBI regularly shares profits with its shareholders. The dividend payout has increased almost every year. That shows SBI cares about giving good returns to its investors.
How to Apply for State Bank of India Dividend 2025?
You do not need to apply yourself. Your broker and the company take care of everything. Just make sure your shareholding details and bank information are up to date. Then, on or after 30 May 2025, SBI will credit the dividend directly to your bank account.
SBI Dividend 2025 – Tax Rules Explained
Since April 2020 dividends are taxable in the hands of shareholders. If your total dividend income exceeds ₹5,000 in a year the company will deduct 10 percent TDS unless you submit a lower-tax certificate. You must include all your dividend income when you file your tax return.
SBI Q4 FY25 Results – Highlights
Particulars
Q4 FY25
Q4 FY24
Revenue
₹42,775 crore
₹41,655 crore
Operating Profit
₹31,286 crore
₹28,748 crore
Net Profit
₹18,643 crore
₹20,698 crore
Provisions
₹6,442 crore
₹1,608 crore
Provisions (QoQ)
₹6,442 crore
₹911 crore
Gross NPA (%)
1.82%
2.07% (Q3 FY25)
Net NPA (%)
0.47%
0.53% (Q3 FY25)
State Bank of India saw revenue rise 2.7% to ₹42,775 crore in Q4 FY25. Operating profit grew 8.8% to ₹31,286 crore. However net profit fell 10% to ₹18,643 crore. Provisions jumped to ₹6,442 crore year on year and also rose sharply quarter on quarter. Asset quality improved as gross NPA fell to 1.82 percent and net NPA to 0.47 percent.
Key Financial Metrics of State Bank of India (SBI)
Metric
Value
Market Capitalisation
₹7,14,014.23
Return on Equity (ROE)
17.26 %
Price-to-Earnings (P/E) Ratio
9.00
Price-to-Book (P/B) Ratio
1.63
5-Year Stock Return
319.95 %
EPS (TTM)
₹81.75
EPS Growth (TTM)
20.56 %
State Bank of India is India’s largest bank by assets and deposits. Its market value is about ₹7,14,014.23 Crore. Investors pay 9.00 times the earnings for its shares. Over the last five years the stock has risen by 319.95%. Its earnings per share over the trailing year are ₹81.75. Those earnings have grown 20.56% in the same period.
Disclaimer: This article is purely intended for informational and educational purposes. It does not constitute financial advice or a recommendation to buy, sell, or hold any financial instrument. The author is not a SEBI-registered financial advisor. Readers are strongly advised to consult with a certified financial advisor before making any investment or financial decisions.
With over 3 years of experience in financial markets, we focus on simplifying global and Indian markets through clear, practical insights. Our expertise also extends to the evolving landscape of digital finance, including blockchain, stablecoins, and decentralized finance (DeFi).