A New Weekly Expiry May Soon Become Common on the Metropolitan Stock Exchange of India (MSEI)

Metropolitan Stock Exchange of India (MSEI)

The Metropolitan Stock Exchange of India (MSEI) has raised Rs. 238 crore through fresh equity issuance, attracting investments from key players like Zerodha’s Kamath brothers, Groww’s parent company, Share India Securities, and Securocorp Securities. The exchange issued 119 crore equity shares at Rs. 2 per share, valuing it at approximately Rs. 1,200 crore. Share India alone invested Rs. 59.5 crore for a 4.958% stake. The new capital aims to encourage MSEI’s position and market activity.

Moreover, the MSEI, in its circular dated 29 November 2024, notified everyone about the new weekly and monthly expiry dates, which will now happen on Friday of the week and the last Friday of the month.

What is MSEI?

The full form of MSEI is Metropolitan Stock Exchange of India. It was previously known as MCX-SX (MCX Stock Exchange) before its rebranding. It provides a platform for trading in equity, equity derivatives, currency derivatives, and debt instruments.

MSEI is not as large as the National Stock Exchange (NSE) or the Bombay Stock Exchange (BSE), which dominate the Indian stock market. However, it is a recognized stock exchange in India.

MSEI began operations in 2008 and launched its Capital Market Segment, Futures and Options Segment, and its flagship index, SX40.

Trading in the SX40 index began in February 2013.

While there has been some activity in equity and currency derivatives, most trading segments witness minimal activity.

Who owns MSEI?

Breakdown of Ownership of MSEI
  • Key Investors at the Early Stages:
    Rakesh Jhunjhunwala and Radhakishan Damani were among the prominent early investors.
    • Currently, Radhakishan Damani holds a 0.89% stake in MSEI.
  • Major Shareholders:
    • Multi Commodity Exchange of India: Holds a 6.9% stake as of September 30.
    • Siddharth Balachandran (a prominent non-resident Indian investor): Owns a 4.9% stake.
    • Share Capital: Announced an investment of ₹59.5 crore to acquire 29.75 crore equity shares, constituting a 4.958% stake in the post-issue paid-up share capital.
    • Banks: Several banks hold stakes in MSEI, including:
      • Union Bank of India
      • State Bank of India
      • Bank of Baroda
      • Punjab National Bank
      • Indian Bank
      • Bank of India
      • Axis Bank Limited
      • Indian Overseas Bank
      • Canara Bank – Mumbai
      • HDFC Bank Limited

What is the MSEI-SX40 index of India?

SX40 is a stock market index introduced by the Metropolitan Stock Exchange of India (MSEI).

MSEI-SX40 serves as a benchmark index for tracking the performance of the top 40 stocks listed on the MSEI.

The index uses the free-float market capitalization method, which considers only the shares available for trading in the market, excluding those held by promoters or large stakeholders.

Know More About SX-40 Index Here

What is the full form of SX-40?

The term ‘SX’ in SX40 is commonly understood to stand for Stock Exchange, where ‘S’ represents stock and ‘X’ represents exchange. The number 40 in SX40 signifies the top 40 large-cap companies included in the SX40 index.

However, no official clarification has been provided regarding the exact full form of SX40.

learn more about the SX40 FAQs

New Expiry Day in SX40 Derivatives Trading

Starting January 1, 2025, the expiry day for SX40 Index derivatives contracts in the equity derivatives segment of the Metropolitan Stock Exchange of India (MSEI) will be revised.

As per the new guidelines, all contracts—weekly, monthly, quarterly, and semi-annual—will now expire on Fridays, replacing the previous schedule where expiry occurred on Thursdays.

Also Read – How to Find SX40 Candlestick Chart on TradingView?

This change will affect both existing and new contracts. Contracts expiring on or after January 1, 2025, will reflect this update. If the expiry day falls on a trading holiday, the preceding working day will serve as the expiry date.

Read The Official Notification Here

Watch this video to know more:

What is the Lot Size for SX 40 in India?

The new lot size for SX 40 F&O instruments has been revised to 40, in line with SEBI’s new rule regarding the increased contract value.

Previously, the lot size was 25 shares.

Lot Size for SX 40 in India

Also Read – What is an Index Fund in simple words? – Complete basics for beginners

When is the expiry of the SX40 index?

The weekly expiry is scheduled on Friday of every week, and the monthly expiry is scheduled on the last Friday of every month.

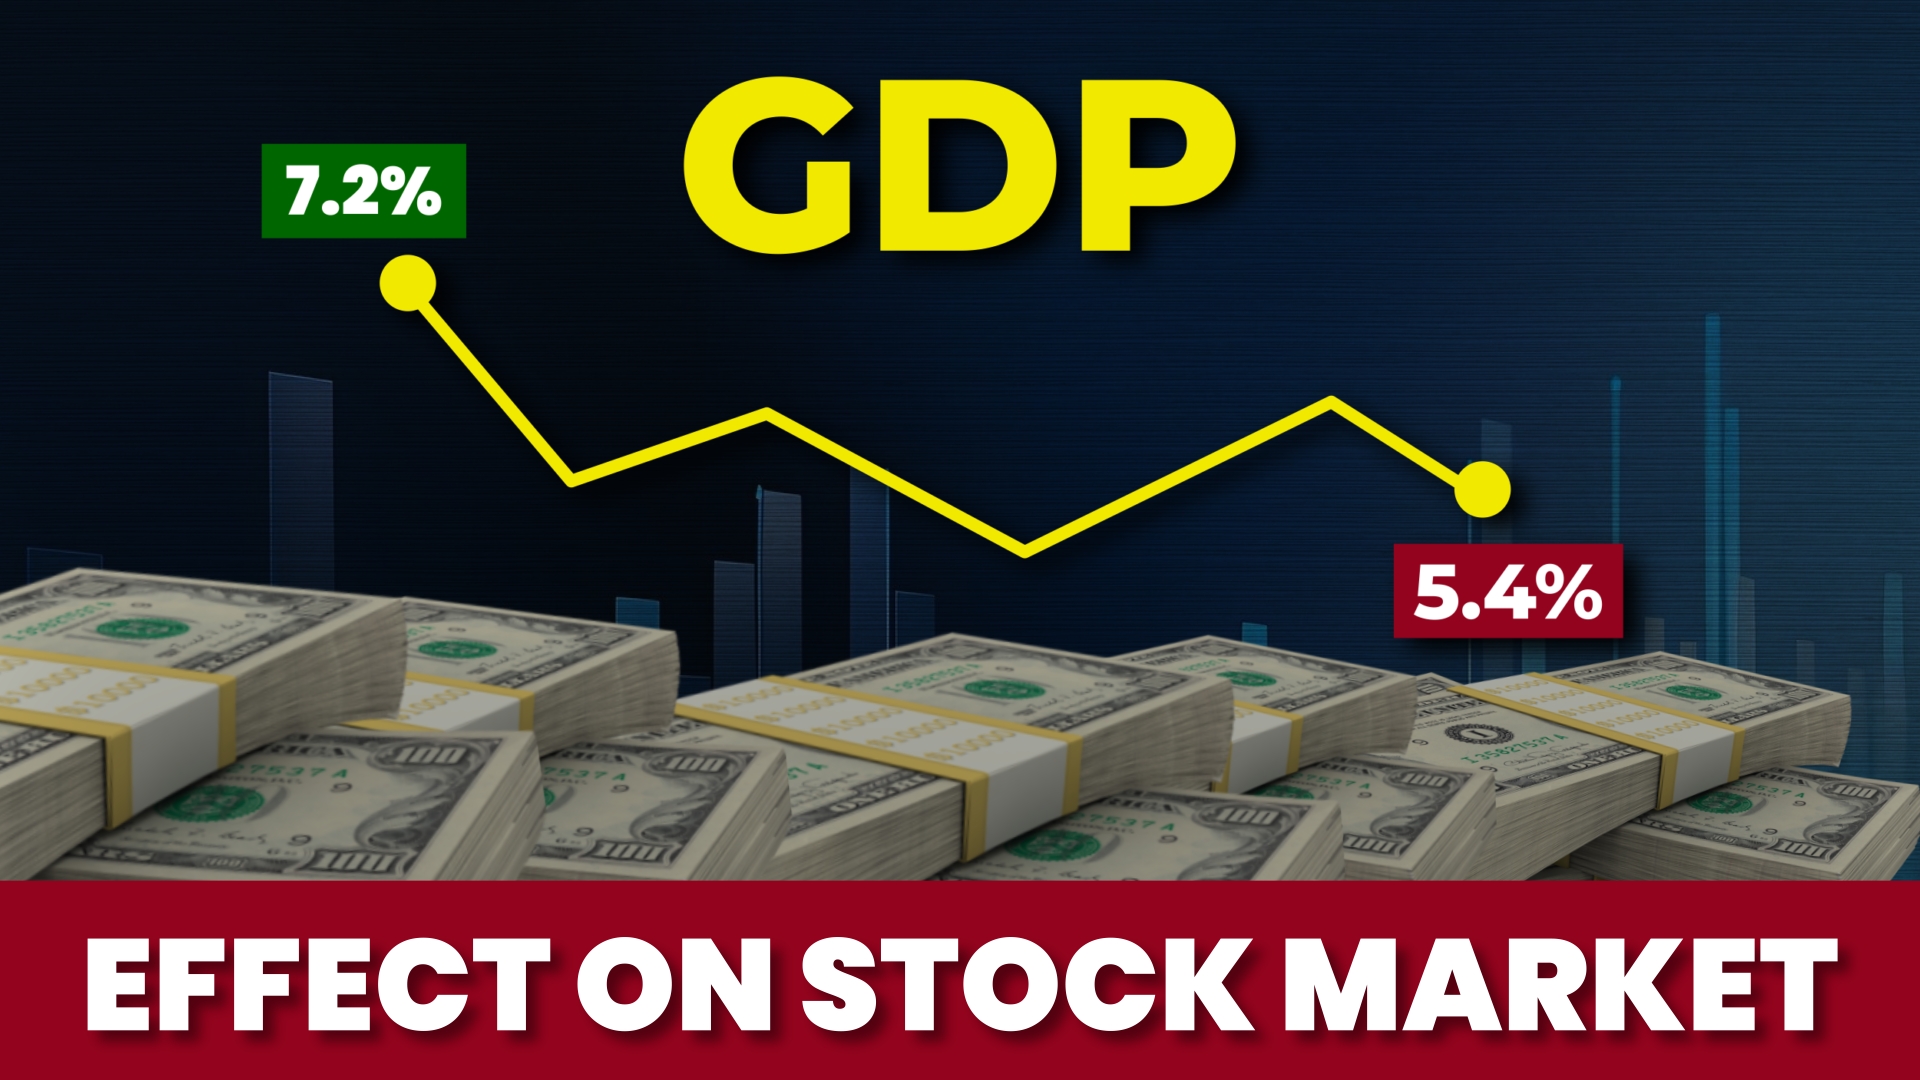
5 Ways GDP Data Impacts the Stock Market

Effect of GDP data on the stock market

GDP data is an important number that shows how much progress a country is making. It tells us how much a country is growing by looking at the value of goods and services produced within its borders.

If you are new to this, let’s start simple.

GDP stands for Gross Domestic Product. It is the total money value of all the goods and services a country produces in a specific time, usually a year or a quarter. You can think of it like a report card for a country’s economy.

Why Does GDP Matter?

GDP is important because it gives an idea of how well a country’s economy is doing.

  • If GDP is increasing, it means the economy is growing:
    • Businesses are making more products.
    • People have more chances to get jobs.
  • If GDP is going down, it means the economy is slowing:
    • Fewer jobs are available.
    • Less money is being made in the economy.

Factors Affecting GDP

These are the key things that affect a country’s GDP:

  • Consumer Spending: The more people buy, the higher the GDP.
  • Business Investment: When companies invest in infrastructure and tools, GDP rises.
  • Government Spending: Development projects and public services push GDP up.
  • Exports and Imports: More exports increase GDP, while more imports can reduce it.

How Does GDP Affect the Stock Market?

how does gdp affect the stock market

Now that you know what GDP is, let’s see how it connects to the stock market. The stock market is where people buy and sell shares of companies. When the economy grows (as shown by GDP), the stock market often grows too.

Here’s how GDP affects the stock market:

  • Investor Confidence
    • When GDP shows strong growth, investors feel confident.
    • They think the economy will continue to do well, so they buy more stocks.
    • If GDP shows poor growth, people get worried and may sell their stocks.
  • Company Profits
    • A growing GDP means companies are selling more products or services.
    • This leads to more profits, which makes their stocks more valuable.
    • A falling GDP means less demand and lower profits, which can cause stock prices to drop.
  • Interest Rates
    • Central banks like the Reserve Bank of India (RBI) use GDP to decide interest rates.
    • If GDP grows too fast, they may raise rates to control inflation.
    • Higher interest rates can hurt company profits and reduce stock prices.
  • Industries and Sectors
    • Sectors like construction and manufacturing do well when GDP grows.
    • Sectors like healthcare or utilities may not change much with GDP changes.
  • Foreign Investment
    • A strong GDP attracts global investors.
    • Foreign investors bring money into the stock market.
    • This increases stock demand and boosts stock prices.

Also Read – Is there any difference between a sector and an industry?

Does Stock Market Affect GDP?

Yes, the stock market can also affect GDP in reverse. Here’s how:

  • When stock prices go up, people feel richer. They spend more, which boosts GDP.
  • Companies that perform well in the stock market may invest more in growth.
  • If stock prices fall, it can make people and businesses nervous. This may lead to less spending and investment.

GDP Data in India

  • India shares GDP data every three months (quarterly).
  • It is an important way to track how the Indian economy is doing.
  • When India’s GDP grows fast, the stock market usually performs well.
  • If GDP growth slows, the stock market often struggles.

GDP Data in USA

  • The USA also releases GDP data every quarter.
  • It is closely watched by investors worldwide.
  • A strong US GDP often boosts global market sentiment.
  • Weak US GDP data can cause negative reactions in international markets, including India.

Conclusion

GDP is an important tool for understanding the economy and the stock market. It helps investors see if the economy is growing or shrinking, which can guide their decisions. Even if you’re just starting, keeping track of GDP can help you understand the stock market better and make smarter choices.

What does ‘Special Call Auction with No Price Bands’ mean?-Elcid Investments with 78 Lakh Percent Returns

Elcid Investments with 78 Lakh Percent Returns

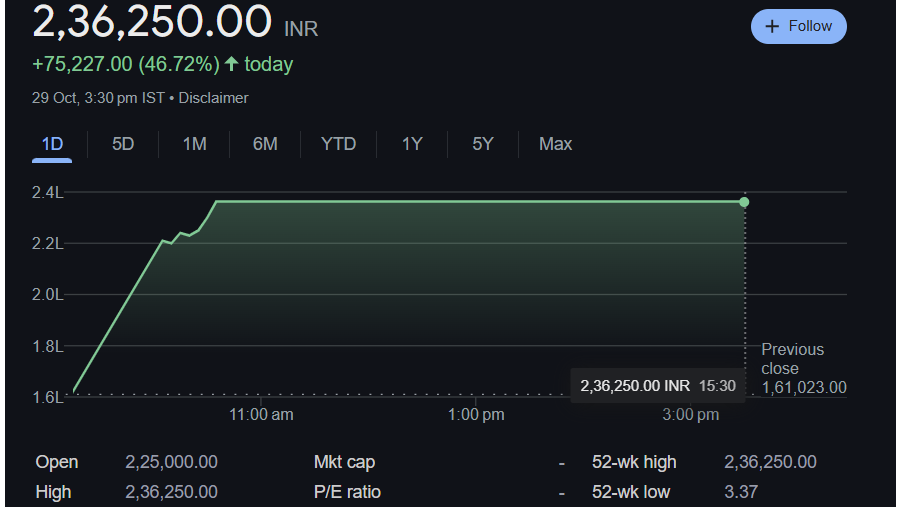
Shares of Elcid Investments, an investment company, soared by an extraordinary 6.7 million percent on Tuesday, reaching ₹2,36,250 per share. This price surge allowed it to surpass MRF as the highest-priced stock in India in absolute terms. This impressive jump occurred following a special call auction “with no price bands” for the stock, which last traded at ₹3.5 per share and holds a book value of over ₹4 lakh per share.

This massive discount left existing shareholders unwilling to sell. To address this undervaluation, the exchanges organized a special auction session for holding companies with deep discounts compared to their book value. This session led to a fair value discovery of its price

Elcid Investments holds a 1.28 percent stake in Asian Paints, valued at ₹3,616 crore, according to Gaikar. Even at ₹2.3 lakh per share, Elcid trades at a price-to-book ratio of just 0.38.

In a 2024 SEBI circular, a new mechanism was introduced to enhance price discovery for investment companies (ICs) and investment holding companies (IHCs).

What are IC and IHC?

Investment Companies (ICs) and Investment Holding Companies (IHCs) are financial entities with a focus on managing investments rather than operating traditional business activities.

  • Investment Companies (ICs): These companies primarily invest in assets like stocks, mutual funds, and debentures, with their main source of income being the returns generated from these investments. They often hold diverse portfolios across various sectors.
  • Investment Holding Companies (IHCs): IHCs usually invest primarily in their own group or affiliated companies, holding a significant portion of assets within their corporate group. They function as a way to organize and manage investments within a single organization and generally do not engage in other business operations.

SEBI noticed that many ICs and IHCs trade significantly below their book value. To help improve liquidity, fair price discovery, and overall investor interest in the stocks of such companies, SEBI introduced a framework for ‘special call auction with no price bands’ for these stocks.

What is a call auction?

A call auction is a trading method used to determine a stock’s price by pooling buy and sell orders over a fixed period and matching them at one single price. Instead of continuous trading, all orders are gathered and processed simultaneously to establish an “equilibrium price” where the maximum number of trades can happen.

Read more about call auctions here

What Does Price Band Mean?

In stock trading, a price band is the maximum range within which a stock is allowed to fluctuate in a single trading session. This range is defined by two levels:

  • Upper Circuit (Upper Price Band): The highest price to which a stock can rise in a day. If the price hits this level, it temporarily halts upward trading, preventing overly rapid price increases.
  • Lower Circuit (Lower Price Band): The lowest price to which a stock can fall in a day. If the price reaches this limit, it prevents further declines and gives the market time to stabilize.

These bands protect investors by reducing extreme price volatility. In the case of SEBI’s special call auction, removing the price bands allows the stock price to adjust freely based on demand and supply, facilitating more accurate price discovery.

The introduction of a special call auction with no price bands is a significant move by SEBI to enhance fair price discovery for Investment Companies (ICs) and Investment Holding Companies (IHCs) trading below their intrinsic value. By lifting price restrictions, SEBI allows the market to accurately reflect these companies’ true worth based on demand and supply, as seen with Elcid Investments’ recent price adjustment. This mechanism not only benefits investors by providing fair valuations but also aims to improve liquidity and investor confidence in under-traded stocks. As SEBI continues to develop policies that support transparent trading, investors can expect more opportunities for fair valuation across the market.

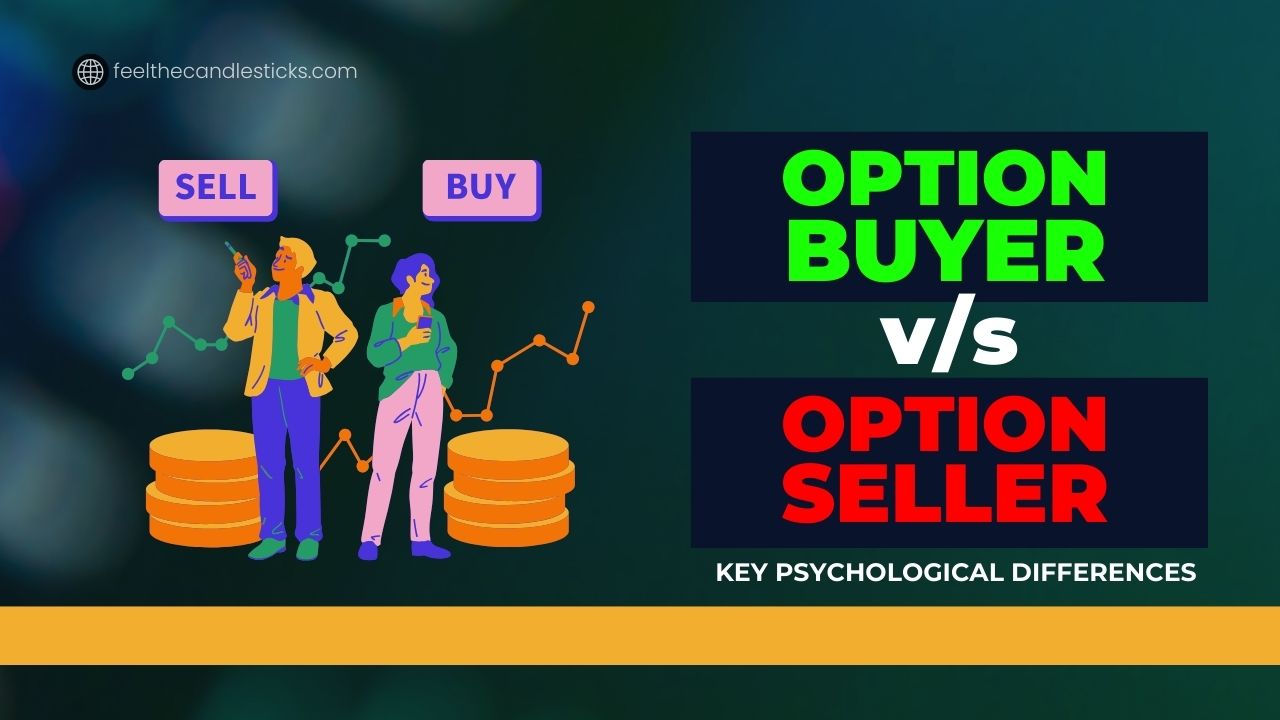
The Basic Psychological Difference Between Option Buyers and Option Sellers

The Basic Psychological Difference Between Option Buyers and Option Sellers

Options are financial derivatives, meaning they derive their value from an underlying asset such as stocks, Bitcoin, crude oil, gold, silver, etc.

Options are commonly used for hedging, which is a strategy to reduce potential financial losses.

  • One main purpose of options is hedging, which is a way to protect yourself against losses. Think of it as buying insurance for your trades. For example, if you own shares of a stock and are worried about a possible price drop, you could buy a put option (an option to sell) to reduce your loss. Hedging is common in options, as it helps traders reduce risks.

In general, the market often involves a continuous contest between bulls (those who expect prices to rise) and bears (those who expect prices to fall)—essentially, a battle between buyers and sellers.

These buyers and sellers can either be futures traders (future buyers and sellers) or options traders (option buyers and option sellers), depending on their strategy and position in the market.

The Basics of Futures Trading

In futures trading, you can choose to buy if you believe the market will go up or short sell if you think it will go down. In essence, futures trading gives you only two choices based on your market expectations.

The probability of making a profit in futures trading is generally around 50%. You can either gain by 1 tick, lose by 1 tick, or break even if the market remains static. That’s it—no other factors influence your gains or losses directly in futures trading.

For a futures trade to happen, there must be both a buyer and a seller. For example, suppose you decide to buy Bank Nifty futures at an index value of 48,000. If the market price rises to 48,001, you would make a profit of ₹1 per share in a lot (while the futures seller would lose ₹1 per share in that lot). Conversely, if the market price drops to 47,999, you would incur a loss of ₹1 per share in a lot (and the futures seller would make a profit of ₹1 per share in that lot). If the market stays at 48,000, there is no gain or loss, as this is your breakeven point.

The Basics of Options Trading

Options trading revolves around calls and puts, which are the building blocks of this market. Think of call and put options like heads and tails on a coin. If you believe the market will go up, you’d buy a call option. If you think it’s heading down, you’d buy a put option. This is how option buyers operate, seeking profit based on market direction.

Option Buyers are people who buy call options (if they think the market will rise) or put options (if they think the market will drop).

Option Sellers are people who sell options to collect premiums. Option sellers usually believe the market will stay stable or move in the opposite direction of the option they sold.

Four Key Strategies in Options Trading

In options trading, there are four main strategies, allowing you to position yourself based on your market expectations:

  1. If you think the market will go up:
    • Buy a call option from an option seller.
    • Sell a put option to a put buyer.
  2. If you think the market will go down:
    • Buy a put option from an option seller.
    • Sell a call option to a call buyer.

By selling options, they collect premiums upfront. This premium serves as a safety net. Even if the market moves slightly against them, they can still make a profit as long as the movement doesn’t exceed the premium collected.

Option sellers can profit in two scenarios. First, if the market remains stable and does not move in either direction, they benefit from the decay of the option premium over time. This time decay means that even if the market doesn’t change, the value of the option they sold will decrease, allowing them to keep the premium as profit.

Second, if the market moves in their favor, the premium will decay even faster, leading to quicker profits. This creates a favorable environment for option sellers. The probability of making a profit in option selling is around 66%. Although the profit may be small—limited to the premium collected—option selling is considered a safer strategy. This is especially true for those who have a solid understanding of charts, price action, and effective trade management.

The probability of making a profit in option buying is only 33%. This is the lowest probability compared to futures buying/selling and option selling. Option buyers face significant challenges because they rely on the market moving in their favor within a specific timeframe. If the market doesn’t move significantly, the option premium will decay, leading to potential losses. This low probability emphasizes the importance of understanding market trends and timing when engaging in options buying. In contrast, option sellers enjoy higher probabilities of profit due to the benefits of time decay and market stability.

In options trading, it’s a zero-sum game: Option buyer’s profit is the option seller’s loss and vice versa.

The Battle of Time and Market Movements

For the option buyer, both the option seller and time work as opponents. As time passes, option premiums naturally decay—a phenomenon known as time decay. If the market doesn’t move in the buyer’s favor, they may face increasing losses as the option’s value declines with time.

On the other side, option sellers benefit from time decay since they keep the premium as long as the option doesn’t move against them. Here, time is an advantage for the seller, while their main opponent remains the option buyer.

Key Psychological Differences

Let’s sum up the different approaches and mindsets of option buyers and sellers:

  1. Risk vs. Reward:
    • Buyers are okay with losing the premium but aim for big rewards if the market moves.
    • Sellers aim for consistent, smaller profits by collecting premiums, but they face potentially high losses if the market moves against them.
  2. Market Movement Expectations:
    • Buyers usually expect large price swings to maximize their profits.
    • Sellers prefer calm, stable markets that allow them to keep the premium without needing to fulfill the option.
  3. Time Sensitivity:
    • Buyers are racing against time since the option expires. If the market doesn’t move enough before expiration, they lose the premium.
    • Sellers benefit from time decay (theta), where the option’s value decreases as it gets closer to expiration. For them, the passing of time works in their favor.

Conclusion

The psychology of option buyers and sellers is rooted in how each side views risk and reward. Option buyers are usually looking for high potential gains, accepting the limited risk of losing their premium. Option sellers, on the other hand, focus on steady, smaller gains but take on higher risks if the market moves against them. Each strategy has its strengths and weaknesses, and understanding these differences can help traders decide whether they prefer to be an option buyer or seller based on their risk tolerance and market outlook.

Also Read – What is Options Trading?-Understanding the Basics of Options Trading

Understanding the Basics of Buying, Selling, and Stop Hunting in Financial Markets

basics-of-buying-selling-and-stop-hunting

In this article, we will go over the basic steps involved in buying and selling activities within financial markets like the stock market, crypto market, commodity market, and forex market. Whether it is the cash market or the derivatives market, many of us have witnessed something called “liquidity raids,” also known as stop hunting. We will explore how buying, selling, and stop hunting might be connected. This might be an eye-opener for you, so let’s get started!

The Simple Idea Behind Buying and Selling

When you buy something, it happens because someone is selling it. In financial markets, this rule is always true. For a transaction to take place, there must be both a buyer and a seller. If you want to buy a stock, someone has to sell it to you, and when you want to sell a stock, someone must be there to buy it from you.

  • If you take a “buy” position in the market, you eventually have to sell that stock to exit your position. This exit could be because you hit your target price or because your stop-loss order (a safety mechanism to limit losses) gets triggered. But remember, for you to sell your stock, there must be a buyer willing to purchase it.
  • On the flip side, if you take a “sell” position (or short-sell), you will need to buy that stock back to close your position. Again, this could happen if you hit your target or if your stop-loss order is triggered. For you to buy that stock, someone needs to be selling it.

Also Read – What is an Index Fund in simple words? – Complete basics for beginners

What is Stop Hunting?

Sometimes, the market might move in the direction you expected, but it first triggers your stop-loss order, forcing you out of the market.

For example, imagine you’re bullish, meaning you expect prices to go up. But before that happens, the price might briefly drop and hit your stop-loss. When this happens, you sell your stock, and someone else buys it.

In many cases, big market players, also known as institutional traders, might be the ones buying that stock from you. These traders want their orders to be fulfilled by buying at the lowest price possible, and triggering stop-loss orders helps them do that. Once you’re out of the market, they sit in a winning position as the market moves in the expected direction.

Bulls and Bears

In financial markets, buyers are called bulls, and sellers are called bears.

  • Bulls buy stocks expecting the price to rise.
  • Bears sell stocks (or take short positions) expecting the price to fall.

Large players, whether they are bulls or bears, often try to build their positions quietly. They let the market move in a way that causes small investors (retail traders) to exit their positions. This allows the large players to buy or sell stocks at favorable prices.

For instance, big bulls might let the bears dominate the market just enough to trigger the stop-loss orders of retail traders. Once these smaller players exit, the big bulls swoop in, buy the stock at lower prices, and take a large bullish position.

Similarly, big bears may let the bulls push prices higher until they reach the point where early bears have placed their stop-loss orders. When those stop-loss orders are hit, the big bears take over, establishing a major bearish position at higher prices.

Key Insights: Price Preferences

  • Buyers (Bulls) always prefer to buy at the lowest possible price.
  • Sellers (Bears) prefer to sell at the highest possible price.

For big bulls, it’s a golden opportunity to buy at lower prices, especially where the stop-loss orders of smaller bulls are sitting. This allows them to enter bullish positions at favorable prices. Similarly, for big bears, it’s ideal to sell at higher prices, which often happens around the stop-loss levels of smaller bears.

Conclusion

  1. A bull’s exit happens when they sell their stock. They might sell it to a bigger bull who is entering the market at that point.
  2. A bear’s exit happens when they buy stock. They might buy it from a bigger bear who is waiting to sell at higher prices.

Whether you’re buying or selling, understanding how the big players move the market can give you a better idea of what’s really happening when you trade. It’s all about knowing that there’s always someone on the other side of your trade, and sometimes, that someone is a much bigger player.

Also Read – What is Panic Selling in the Stock Market? – 5 Important Points to Know

Julien Agro Infratech Limited Dividend 2024- Record Date

https://feelthecandlesticks.com/julien-agro-infratech-limited-dividend-2024-record-date/

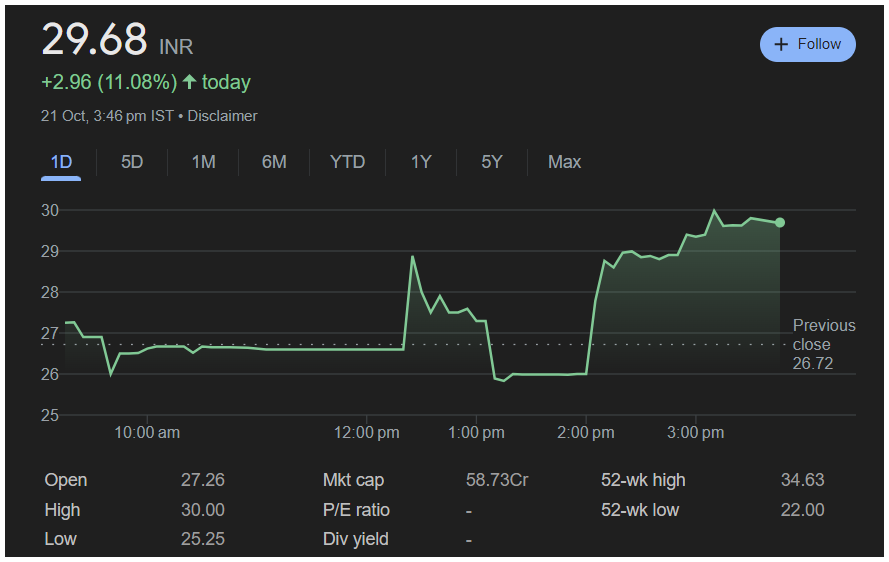
Julien Agro Infratech Limited recently held a Board of Directors meeting on October 21, 2024. Several key decisions were made during this meeting. Here’s a breakdown of the important updates:

  1. Approval of Financial Results: The Board approved the unaudited financial results for the quarter and half-year ending on September 30, 2024. These financial statements were reviewed by the company’s statutory auditors, M.K. Kothari & Associates. Both the results and the review report will be available on the company’s official website.
  2. Interim Dividend: The company declared an interim dividend of ₹0.05 (5 paise) per equity share for the financial year 2024-25. This dividend will be paid on the 19,789,000 equity shares, each with a nominal value of ₹10.
  3. Record Date for Dividend: The Board has set November 1, 2024, as the “Record Date” for determining which shareholders will be entitled to receive the interim dividend. Shareholders who have their names in the company’s records or the list of beneficial owners maintained by depositories on that day will be eligible for the dividend.

Also Read – Is there any difference between a sector and an industry?

  1. Dividend Payment Timeline: According to the Companies Act of 2013, the company will distribute the interim dividend to eligible shareholders within 30 days of the declaration.

These decisions reflect the company’s ongoing efforts to keep its shareholders informed and to reward them for their investments. Shareholders can look forward to receiving their dividends and reviewing the company’s financial performance for the recent quarter and half-year.

Read the official notification here

Julien Agro Infratech Limited Dividend 2024- Record Date

Will the Monthly Expiry for Bank Nifty, Finnifty, and Nifty Midcap Also Be Discontinued? – Important Dates to Know

https://feelthecandlesticks.com/monthly-expiry-for-bank-nifty-finnifty-and-nifty-midcap/

NSE Discontinues Weekly Derivatives Contracts: What About Monthly Expiry?

In a recent announcement, the National Stock Exchange of India (NSE) made significant changes regarding the availability of weekly derivatives contracts for key indices. As per the circular issued on October 10, 2024, the weekly contracts for Bank Nifty (BANKNIFTY), Nifty Midcap Select (MIDCPNIFTY), and Nifty Financial Services (FINNIFTY) will be discontinued, effective from November 20, 2024. This has raised concerns among traders and investors regarding the status of the monthly expiry contracts for these indices.

What the Circular Says

The NSE circular clarifies that as part of a regulatory directive from SEBI (Securities and Exchange Board of India), exchanges can offer weekly derivatives contracts on only one benchmark index. Following this guideline, NSE will continue to provide weekly options contracts exclusively for the Nifty 50 Index (NIFTY).

The last weekly expiry dates for the affected indices have been announced:

  • Bank Nifty: Last weekly expiry on November 13, 2024.
  • Midcap Nifty: Last weekly expiry on November 18, 2024.
  • Financial Services Nifty: Last weekly expiry on November 19, 2024.

After these dates, no new weekly options contracts will be generated for these indices.

Read the official notification here

The Impact on Monthly Expiry Contracts

While the circular specifically addresses the discontinuation of weekly contracts, there is no mention of changes to the monthly expiry contracts. This suggests that the monthly options and futures contracts for Bank Nifty, Midcap Nifty, and Financial Services Nifty will continue to be available as usual.

The focus of the circular is to streamline weekly contract offerings to a single index per exchange, but it doesn’t impact the broader monthly derivatives market. Therefore, traders and investors can expect the monthly expiry contracts for these indices to remain unaffected.

What This Means for Traders

https://feelthecandlesticks.com/monthly-expiry-for-bank-nifty-finnifty/

The discontinuation of weekly contracts on multiple indices might shift trading activity towards the Nifty 50 weekly options. However, for those who rely on the monthly expiry for strategies in Bank Nifty, Finnifty, and Midcap Nifty, these contracts are likely to remain available, ensuring continuity for long-term traders.

The decision aligns with SEBI’s aim to enhance investor protection and market stability, but it could also influence liquidity patterns in these indices as traders adapt to the new structure.

For now, the focus is on the weekly options, and monthly contracts should remain a part of the trading landscape for these popular indices.

Also Read – What is an Index in the Stock Market? – Explained in Simple Words

Conclusion

In summary, while the weekly derivatives contracts for Bank Nifty, Finnifty, and Midcap Nifty are set to be discontinued from November 2024, there is no indication that monthly expiry contracts will be affected. Traders can continue using monthly options and futures for their trading strategies in these indices. As always, staying informed about regulatory changes and adapting to market shifts is crucial for maintaining a competitive edge in the derivatives market.

What is an Index Fund in simple words? – Complete basics for beginners

https://feelthecandlesticks.com/index-fund-in-simple-words/

What is an Index?

An index is created using a group of stocks. These stocks might belong to the same sector, the same industries, or could be a mix of stocks from different sectors or industries.

An example of an index is Nifty 50, which comprises stocks from different sectors of the economy. Another example is Bank Nifty, also called Nifty Bank, which consists of banking stocks from the banking sector.

An index helps us understand the performance of the entire stock market or a particular sector collectively.

There are two major stock exchanges in India: the National Stock Exchange (NSE) and the Bombay Stock Exchange (BSE).

Top Stock Market Indices of India

  • Nifty: This index includes the top 50 companies listed on the National Stock Exchange (NSE) in India.
  • Sensex: This index includes the top 30 companies listed on the Bombay Stock Exchange (BSE).

These indices provide a snapshot of how the market is performing by looking at the top included companies.

Companies are included in these indices based on their market capitalization, which represents the total market value of their outstanding shares. A higher market capitalization increases a company’s likelihood of being selected for inclusion. Market capitalization reflects the size of a company.

What is an Index Fund?

An index fund is like a special investment basket. Here’s how it works:

  • Invests in All Stocks of an Index: If you invest in an index fund that tracks the Nifty 50, your money is spread out to buy all the stocks in the Nifty 50 index in the same proportions.
  • Managed by a Fund Manager: A professional manages the fund, making sure your investments match the index.
  • Low Cost: Index funds usually have lower fees compared to other types of mutual funds.
  • Passive Investing: Instead of picking individual stocks, the fund just follows the index.

In an index fund, the fund manager just mirrors the index and adjusts the weightage of stocks in the fund as the weightage changes in the original index.

Please note that when you invest in an index fund, you own a portion of the fund itself, not the individual stocks that make up the index it tracks.

How is an Index Fund Different from a Mutual Fund?

  • An index fund has fixed stocks that are part of an index. These funds are passively managed by a fund manager. The fund manager cannot alter the stocks on his own, leading to a lower expense ratio.
  • On the other hand, a mutual fund is actively managed by a fund manager who can change the stocks based on his own judgment, considering risk and reward. This active management results in a higher expense ratio.

Also Read – What is an ETF in Simple Words? – 3 Important Points to Know

Returns and Risks

Index funds are generally good for long-term investments. Over time, they often perform better than fixed deposits. For example:

  • If you invested in the Nifty 50 index in the year 2000, your money would have grown significantly by the end of 2021.
  • Fixed deposits usually offer lower returns compared to index funds over long periods.

However, index funds do involve some risks, especially because they are tied to the stock market’s ups and downs.

How to Choose the Right Index Fund

When picking an index fund, consider these key factors:

  1. Expense Ratio: This is the fee you pay to manage the fund. Lower expense ratios are better. For example, an expense ratio of 0.2% means you pay 20 paise per 100 rupees invested.
  2. Tracking Error: This measures how closely the fund follows the index. A lower tracking error means the fund more accurately reflects the index’s performance.
  3. Assets Under Management (AUM): This shows how much money is invested in the fund. Generally, a higher AUM is better because it indicates stability.

Conclusion

Index funds are great for long-term investments and can help you grow your money over time. They are not risk-free, but with proper research, you can make informed choices. Look for funds with low expense ratios and good tracking accuracy. Remember, investing in index funds is about being patient and thinking long-term. Happy investing!

Also Read – Is there any difference between a sector and an industry?

ROE – Return On Equity – Complete Concept in Simple Words

https://feelthecandlesticks.com/return-on-equity-in-simple-words/

Return on equity (ROE) simply means how much return you are generating over the shareholders’ funds.

Shareholders’ funds are called equity.

What is Equity?

The money a company receives after selling its ownership is called equity or shareholders’ funds.

Suppose you open a samosa shop in your local area. You raise ₹5 lakh after selling 25% ownership of your shop. At the end of the year, you generate ₹1 lakh in profit.

To calculate the return on equity (ROE), you divide the profit by the total shareholders’ funds, which is ₹5 lakh in this case. So, your ROE will be:

ROE = (Profit / Shareholders’ Funds) × 100
ROE = (1,00,000 / 5,00,000) × 100 = 20%

This means that for every ₹100 invested by the shareholders, your samosa shop is generating ₹20 in return. In simple words, ROE shows how well you’re using the money invested by the shareholders to generate profits.

What is an ETF in Simple Words? – 3 Important Points to Know

https://feelthecandlesticks.com/etf-in-simple-words/

An ETF, or Exchange Traded Fund, is similar to a mutual fund but offers more flexibility. As the name suggests, ETFs are traded on stock exchanges, just like regular stocks. Essentially, ETFs are baskets of different securities (like stocks, bonds, or commodities) that hold a collective value. When you invest in an ETF, you’re investing in a wide range of securities indirectly, meaning you don’t own each security individually, but you own a part of the overall fund.

ETFs combine the features of both mutual funds and stocks. They provide the diversification of a mutual fund with the ease of trading in the stock market.

Types of ETFs

There are different types of ETFs, depending on what they focus on. Some common ones include:

  1. Equity ETFs: These hold stocks from various companies.
  2. Bond ETFs: These focus on different types of bonds.
  3. Commodity ETFs: These track assets like gold, oil, or other commodities.
  4. Sector ETFs: These focus on specific sectors like technology or healthcare.
  5. International ETFs: These invest in stocks or bonds from international markets.

How are ETFs made?

etf-in-simple-words

ETFs are built by fund managers who own various underlying assets like stocks, bonds, or commodities. The fund manager creates a “basket” of these assets, known as a fund, which aims to track the performance of those assets.

Once the fund is created, it is divided into shares, which investors can buy. However, as an investor, you do not directly own the individual assets inside the ETF, but rather a share of the overall fund.

3 Important Points to Know about ETFs

  • Trade on Exchanges: ETFs can be bought and sold on stock exchanges just like regular company shares.
  • Dividends: ETFs pay dividends if the stocks within the fund distribute dividends to their shareholders.
  • Flexibility: ETFs can be traded throughout the day, unlike mutual funds which are only bought or sold at the end of the trading day.

Also Read – What is a share buyback in the stock market? – 5 Important Facts to Know About Share Buybacks

What are the advantages of an ETF?

  1. Flexibility: Since ETFs are traded on stock exchanges, you can buy or sell them at any time during market hours, just like stocks.
  2. Diversification: By investing in an ETF, you’re indirectly investing in a wide range of securities, which helps in spreading your risk.
  3. Lower Fees: ETFs often have lower management fees compared to mutual funds, making them cost-effective.
  4. Transparency: The holdings of an ETF are usually disclosed daily, so investors always know what assets are inside the fund.

What are the disadvantages of an ETF?

  1. Liquidity Issues: Sometimes, certain ETFs can face liquidity problems, meaning they can be hard to buy or sell quickly, especially in less popular markets.
  2. Trading Costs: While ETFs have low management fees, each time you buy or sell them, you might have to pay a brokerage fee, which can add up if you trade frequently.

How to Invest in ETFs?

Investing in ETFs is quite simple and similar to buying stocks. Here’s how you can do it:

  1. Open a Demat Account: You need a Demat account with a registered broker.
  2. Deposit Funds: Add money to your trading account.
  3. Find an ETF: Search for the ETF you want to invest in.
  4. Buy or Sell: You can buy or sell the ETF directly from the stock exchange.

Conclusion

ETFs are a great tool for investors who want to diversify their investments without having to pick individual stocks or bonds. They offer flexibility, transparency, and the potential for lower fees compared to mutual funds. Whether you’re a beginner or an experienced investor, ETFs can be a useful part of your investment portfolio to spread risk across various asset classes.

If you’re looking to diversify your portfolio, trade easily, and gain exposure to a variety of assets, ETFs might be a smart choice.

Click here to learn more