Skechers U.S.A., Inc. (NYSE: SKX) has announced a landmark $9.4 billion acquisition by investment firm 3G Capital, marking its transition to a privately held company. The deal, set to reshape the footwear giant’s future, will lead to its delisting from the New York Stock Exchange. Here are five critical details shareholders and investors need to know:
Table of Contents
1. Acquisition Triggers Delisting
3G Capital will acquire Skechers for $63.00 per share in cash, a 30% premium over its 15-day average stock price. The transaction, approved unanimously by Skechers’ board, is expected to close in Q3 2025. Post-closure, Skechers’ shares will be delisted, ending its 30-year run as a publicly traded company. The move reflects a growing trend of firms opting for private ownership to avoid public market pressures.
2. Shareholder Options: Cash or Equity in a Private Entity
Shareholders have two payment options:
$63.00 per share in cash (immediate liquidity).
$57.00 in cash + one unlisted, non-transferable equity unit in the new private parent company.
Notably, founder Robert Greenberg and family have committed to the mixed payment, signaling confidence in Skechers’ private future. However, the equity units lack liquidity, meaning shareholders cannot trade them publicly—a key consideration for investors seeking flexibility.
3. Leadership and Strategy Remain Unchanged
Skechers will continue under CEO Robert Greenberg and its current management team, with headquarters staying in Manhattan Beach, California. The company plans to maintain its focus on international expansion, direct-to-consumer growth, and innovation. Going private may allow Skechers to pursue long-term strategies without quarterly earnings scrutiny, potentially accelerating initiatives like global distribution and technology investments.
4. Strong Financials and Deal Rationale
Skechers reported record 2024 revenue of $9 billion ($640 million net earnings), underscoring its robust market position. The acquisition at a premium suggests 3G Capital sees untapped value, possibly in Skechers’ 15% revenue exposure to China and its wholesale growth potential. Delisting could provide operational flexibility amid challenges like U.S. tariffs (not addressed in the release) and shifting trade dynamics.
5. Navigating Risks as a Private Company
While privatization offers advantages, Skechers faces external headwinds:
Trump-era tariffs impacting shoemaking costs.
Dependence on China for 15% of revenue (per FactSet).
As a private entity, Skechers may mitigate these risks through strategic adjustments away from public scrutiny. However, shareholders opting for equity units must trust management’s ability to navigate these challenges without the transparency of public reporting.
Skechers’ stock surged 25% pre-market to $61.78 following the announcement.
The deal underscores confidence in the brand’s resilience and growth prospects.
Shareholders must decide between immediate cash or illiquid equity by the Q3 2025 closure.
As Skechers transitions to private ownership, stakeholders should weigh liquidity needs against long-term faith in the company’s vision. For the broader market, this acquisition highlights the evolving landscape where firms increasingly seek refuge from public market volatility.
Disclaimer: The views and opinions expressed in this article are solely those of the author and are intended for informational purposes only. They do not constitute financial, investment, or trading advice. Any stock price predictions mentioned are purely speculative and based on personal analysis. Past performance is not indicative of future results. Readers are advised to conduct their own research and, if necessary, consult a certified financial advisor before making any investment decisions. The author does not accept any liability for financial losses or gains arising from the use of this content.
What is 3G Capital?
3G Capital is a global private investment firm known for acquiring and managing consumer-focused brands with long-term growth potential. Founded in 2004, it has built a reputation for partnerships with iconic companies, emphasizing operational efficiency, cost discipline, and strategic expansion.
The Board of Directors of Kalyani Steels met on 5 May 2025 and recommended a final dividend of ₹ 10.00 per equity share (face value ₹ 5), or 200% of face value, for the financial year 2024-25. Below are all the key details you need to know.
Company Overview
Field
Details
Company Name
Kalyani Steels Limited
Stock Symbol
BSE: 542976 · NSE: KSTEEL
IPO Year
2003
Stock Exchange
BSE, NSE
Market Cap
₹ 6,500 crore (approx. May 2025)
Founder
Bharat Forge Group
Incorporation
2003
Headquarters
Pune, Maharashtra, India
Sector
Metals & Mining
Industry
Steel Manufacturing
Specialization
Alloy Steels, Stainless Steels
Kalyani Steels is part of the Bharat Forge Group. It produces high-strength alloy and stainless steel. The company serves automotive, oil, gas and engineering sectors globally.
Table of Contents
Kalyani Steels Dividend 2025 – Important Dates
Kalyani Steels Dividend 2025 Announcement Date
5 May 2025
Kalyani Steels Dividend Type
Final Dividend
Kalyani Steels Dividend Amount
₹ 10.00 per equity share
Kalyani Steels Ex-Dividend Date
to be updated
Kalyani Steels Record Date
to be updated
Kalyani Steels Payment Date
to be updated
Record Date: The cut-off date set by the company to determine which shareholders are eligible to receive the dividend. Only those who own shares on this date get the dividend.
Ex-Dividend Date: Usually one business day before the Record Date. If you buy shares on or after the Ex-Dividend Date, you will not be eligible for the dividend.
Note: Shareholders on record by the Record Date are eligible for the dividend.
Since April 2020, dividends are taxable in the hands of shareholders. If your total dividend income exceeds ₹ 5,000 in a year, Kalyani Steels will deduct 10% TDS at source. You can submit a lower‑tax deduction certificate if eligible. Make sure to include all your dividend income when filing your annual tax return.
Q4 FY25 Results – Highlights
Particulars
Q4 FY25
Q4 FY24
Profit After Tax
₹ 79.28 crore
₹ 62.53 crore
Profit Before Tax (PBT)
₹ 107.14 crore
₹ 84.39 crore
Revenue from Operations
₹ 544.33 crore
₹ 503.15 crore
Total Expenses
₹ 449.94 crore
₹ 431.40 crore
Other Expenses
₹ 278.76 crore
₹ 209.43 crore
Raw Material Costs
₹ 112.30 crore
₹ 103.58 crore
Employee Benefit Expenses
₹ 58.88 crore
₹ 52.79 crore
Kalyani Steels reported a 26.75% rise in net profit. Revenue grew by 8.25%, while expenses increased 4.28%. Other costs jumped sharply by 33.10%.
Key Financial Metrics
Metric
Value
Market Capitalisation
₹ 6,500 crore
Return on Equity (ROE)
15.10%
Price-to-Earnings (P/E) Ratio
12.00
Price-to-Book (P/B) Ratio
1.80
Industry P/E Ratio
14.50
Industry P/B Ratio
2.10
EPS (TTM)
₹ 48.50
Kalyani Steels delivered strong margins and improved profitability in Q4 FY25. Its valuation ratios remain attractive compared to industry peers.
Disclaimer: This article is purely intended for informational and educational purposes. It does not constitute financial advice or a recommendation to buy, sell, or hold any financial instrument. The author is not a SEBI-registered financial advisor. Readers are strongly advised to consult with a certified financial advisor before making any investment or financial decisions.
Along with its audited financial results for the fourth quarter (Q4 FY25) and the year ended 31 March 2025, Mahindra & Mahindra Ltd. has approved a final dividend of ₹ 25.30 per equity share (face value ₹ 5), or 506% of face value. Below are all the key details you need to know.
Company Overview
Company Name
Mahindra & Mahindra Ltd.
Stock Symbol
BSE: 500520 · NSE: M&M
IPO Year
1945 (as a tractor manufacturer)
Stock Exchange
BSE, NSE
Market Cap
₹ 1.85 lakh crore (approx. May 2025)
Founder
J.C. Mahindra & K.C. Mahindra
Incorporation
1945
Headquarters
Mumbai, Maharashtra, India
Sector
Automobiles & Farm Equipment
Industry
Automotive & Agricultural Machinery
Key Products & Services
SUVs, Tractors, Commercial Vehicles, Electric Vehicles
Mahindra & Mahindra is a leading Indian automaker and farm-equipment maker. It has a global presence in over 100 countries. It makes SUVs, tractors, and electric vehicles. The company is known for innovation and a strong market share.
Table of Contents
Mahindra Dividend 2025 – Important Dates
Mahindra & Mahindra Dividend 2025 Announcement Date
5 May 2025
Mahindra & Mahindra Dividend Type
Final Dividend
Mahindra & Mahindra Dividend Amount
₹ 25.30 per equity share
Mahindra Dividend 2025 Ex-Dividend Date
3 July 2025
Mahindra Dividend 2025 Record Date
4 July 2025
Mahindra Dividend 2025 Payment Date
After 31 July 2025
Note: Shareholders recorded in the books by the Record Date are eligible to receive the dividend.
Mahindra & Mahindra has steadily increased dividends over recent years. It shows the company shares profits with its investors.
How to Receive Your Dividend
You do not need to apply separately. Your depository and the company will handle it automatically.
Beneficial Owners: Names on the NSDL/CDSL list as of 4 July 2025.
Registered Members: If your shares are held in physical form, then your name must be in the company’s official Register of Members by 4 July 2025. This requires that any transfer requests were fully processed by that date.
After 31 July 2025, Mahindra & Mahindra will credit the dividend to your bank account or dispatch a cheque.
Book Closure Period
The Register of Members and Share Transfer Books will remain closed from 5 July 2025 to 31 July 2025 (both days inclusive).
Any valid transfer requests must reach the Registrar by 4 July 2025 to be processed before book closure.
Mahindra & Mahindra reported a 13.34% rise in profit after tax. Revenue grew by 20.5%. Expenses also increased. Vehicle sales rose 18% and tractor sales increased 23% compared to Q4 FY24.
Key Financial Metrics
Metric
Value
Market Capitalisation
₹ 1,85,000 crore
Return on Equity (ROE)
12.50%
Price-to-Earnings (P/E) Ratio
18.00
Price-to-Book (P/B) Ratio
3.20
Industry P/E Ratio
26.10
Industry P/B Ratio
3.75
5-Year Stock Return
210.00%
EPS (TTM)
₹ 140.50
Mahindra & Mahindra has shown consistent growth and strong returns in recent years. When compared to the industry averages, its P/E ratio is lower, which could mean the stock is relatively undervalued. Similarly, its P/B ratio is also below the industry average, indicating potentially better value for long-term investors.
Why This Matters A high dividend reflects strong profits and rewards investors. It can also attract new buyers to the stock.
Disclaimer: This article is for informational purposes only. It does not constitute financial advice. Consult a certified financial advisor before making investment decisions.
Tata Motors, a titan in India’s automotive sector and a heavyweight on the stock market, is revving up to redefine the premium hatchback segment with the 2025 Altroz facelift. Slated for its grand debut on May 22, 2025, the updated Altroz promises a bold design refresh, cutting-edge features, and a versatile powertrain lineup. As the first major update since its 2020 debut, this launch is pivotal for Tata to cement its dominance against rivals like Maruti Suzuki Baleno and Hyundai i20. Here’s an exclusive look at what’s under the hood.
Launch Date: Mark Your Calendars
Tata Motors has officially confirmed the Altroz facelift will “break cover” on May 22, with bookings expected to open soon. The teaser campaign has already ignited excitement, showcasing sleek design tweaks and hinting at a tech-loaded cabin.
Exterior Design: Sportier, Smarter, Sleeker
The 2025 Altroz retains its sporty DNA but amps up the premium quotient with striking updates:
Front Fascia: A redesigned split headlight setup features twin-pod LED clusters and sleek LED DRLs. The bumper now sports vertical slats and repositioned fog lamps.
Side Profile: New alloy wheels and flush door handles (a segment-first inspired by the Curvv EV) add a futuristic edge.
Rear: Slimmer, interconnected LED tail lamps replace the bulkier units, enhancing the car’s modern appeal.
Dual-Tone Options: Tata will continue offering vibrant dual-tone color schemes to attract style-conscious buyers.
Interiors: Premium Cabin Upgrades
While the cabin remains under wraps, insiders hint at significant upgrades:
Dashboard & Upholstery: Expect refreshed panels, new trim accents, and premium upholstery colors.
Tech Suite: The previously exclusive 10.25-inch touchscreen infotainment system (from the Race edition) will now be standard across variants. A fully digital driver’s display and a 360-degree camera are also anticipated.
Comfort: Enhanced connectivity, wireless charging, and a revamped Harman audio system could elevate the in-car experience.
Powertrain: Versatility Reigns Supreme
The Altroz facelift retains its reputation as the only hatchback offering five engine options:
1.2L Turbo Petrol: 85 HP / 113 Nm (5-speed manual or 6-speed DCT automatic).
1.2L Turbo-Petrol (Racer): 118 HP, paired with a 6-speed manual for thrill-seekers.
1.2L CNG: 72.4 HP / 103 Nm (5-speed manual).
1.5L Diesel: 89 HP / 200 Nm (5-speed manual).
This diverse lineup ensures the Altroz caters to efficiency-focused buyers (CNG, diesel) and performance enthusiasts alike.
Features: Tech to Compete
Tata is pulling out all stops to outshine rivals:
Segment-First Flush Door Handles
360-Degree Camera for tight parking spots.
Wireless Android Auto/Apple CarPlay and connected car tech.
Ventilated Seats (likely in top variants).
Rivals: Can the Altroz Outpace the Competition?
The facelift sharpens the Altroz’s claws against the Maruti Suzuki Baleno, Hyundai i20, and Toyota Glanza. Its unique diesel and CNG options, coupled with Tata’s focus on safety (5-star Global NCAP rating), give it an edge in practicality and value.
Why This Launch Matters
As Tata Motors’ stock continues to rally, the Altroz facelift underscores its commitment to innovation and customer-centric upgrades. With over 1.5 lakh units sold since 2020, this refresh is crucial to maintaining momentum in a fiercely competitive segment.
Final Thoughts
The 2025 Tata Altroz facelift isn’t just a car launch—it’s a statement. By blending bold design, advanced tech, and unmatched powertrain flexibility, Tata Motors is poised to accelerate ahead of rivals. All eyes are now on May 22, when this automotive gem will finally hit the spotlight.
Warren Buffett, who is now 94 years old, shared both investing insights and personal advice at the 2025 Berkshire Hathaway annual meeting. While his investment lessons remind us to stay patient and focused on value, his life lessons push us to prioritize happiness, pursue work we love, and surround ourselves with the right people. These tips can transform how we think about our careers and personal well-being.
Table of Contents
Event Highlights
The 2025 Berkshire Hathaway annual meeting took place on May 3, 2025, in Omaha, Nebraska. Known as the “Woodstock for Capitalists,” the event featured four and a half hours of Q&A with Buffett and his executives. Attendees and viewers around the world tuned in to hear his views on markets, the economy, and life.
Greg Abel – To Be the Next CEO of Berkshire Hathaway
At the 2025 meeting, Warren Buffett made a big announcement. He said that Greg Abel will become the new CEO of Berkshire Hathaway by the end of 2025.
The transition is expected to be completed by early 2026. Buffett, who is now 94 years old, shared that he had first discussed this with only two board members.
During the meeting, he said, “The time has arrived where Greg should become the chief executive officer of the company at year-end.” Buffett also mentioned that while he will still be involved, Greg Abel will be in charge of running the company and making important financial decisions.
4 Important Life Lessons by Warren Buffett from 2025
While Buffett’s investing wisdom guides how we grow wealth, his personal advice offers a roadmap for a fulfilling life.
1. Happiness Means Longevity
“A happy person lives longer than someone doing things they don’t admire much,” Buffett said, highlighting that joy in life boosts well-being and may even extend lifespan.
2. Choose Work You Love
Buffett advised young people to find work they’d do even without pay. He explained that loving your work makes every day rewarding and reduces stress over money.
3. Surround Yourself with the Right People
“Who you associate with is enormously important. You will move in the direction of those you admire and call friends,” Buffett said. Good company not only aids career success but shapes who you become.
4. Stay Optimistic and Resilient
Despite global challenges and political risks, Buffett remains bullish on America’s future. He described being born in the U.S. as his greatest luck and urged confidence in the country’s ability to overcome crises.
A Glimpse of Investment Lessons by Warren Buffett (Brief Overview)
Market Volatility: Buffett reminded investors that recent swings are normal. He noted that Berkshire’s stock was halved three times in sixty years, yet the company thrived through each cycle.
Cash and Opportunities: With a record cash hoard of $347 billion, Berkshire is ready to act when good deals arise. Buffett said he’d deploy up to $100 billion for the right opportunity in the next five years.
Long-Term Holdings: He committed to holding Japanese stocks for at least fifty more years, emphasizing the value of patient investing.
Warren Buffett’s 2025 meeting gave us more than tips on when to buy or sell stocks. His life-changing advice reminds us to seek happiness, passion, and the right circle of influence. These lessons can open our eyes to what truly matters beyond the numbers on a screen.
Who is Greg Abel?
Greg Abel is a Canadian businessman born on June 1, 1962, in Edmonton, Alberta. His full name is Gregory Edward Abel. He currently serves as the chairman and CEO of Berkshire Hathaway Energy and the vice-chairman of non-insurance operations at Berkshire Hathaway, a role he has held since 2018.
What is the net worth of Greg Abel?
Gregory Abel’s estimated net worth is approximately $484 million.
What is the age of Warren Buffett?
Warren Buffett is now 94 years old.
Disclaimer: This article is purely intended for informational and educational purposes. It does not constitute financial advice or a recommendation to buy, sell, or hold any financial instrument. Readers are strongly advised to consult with a certified financial advisor before making any investment or financial decisions.
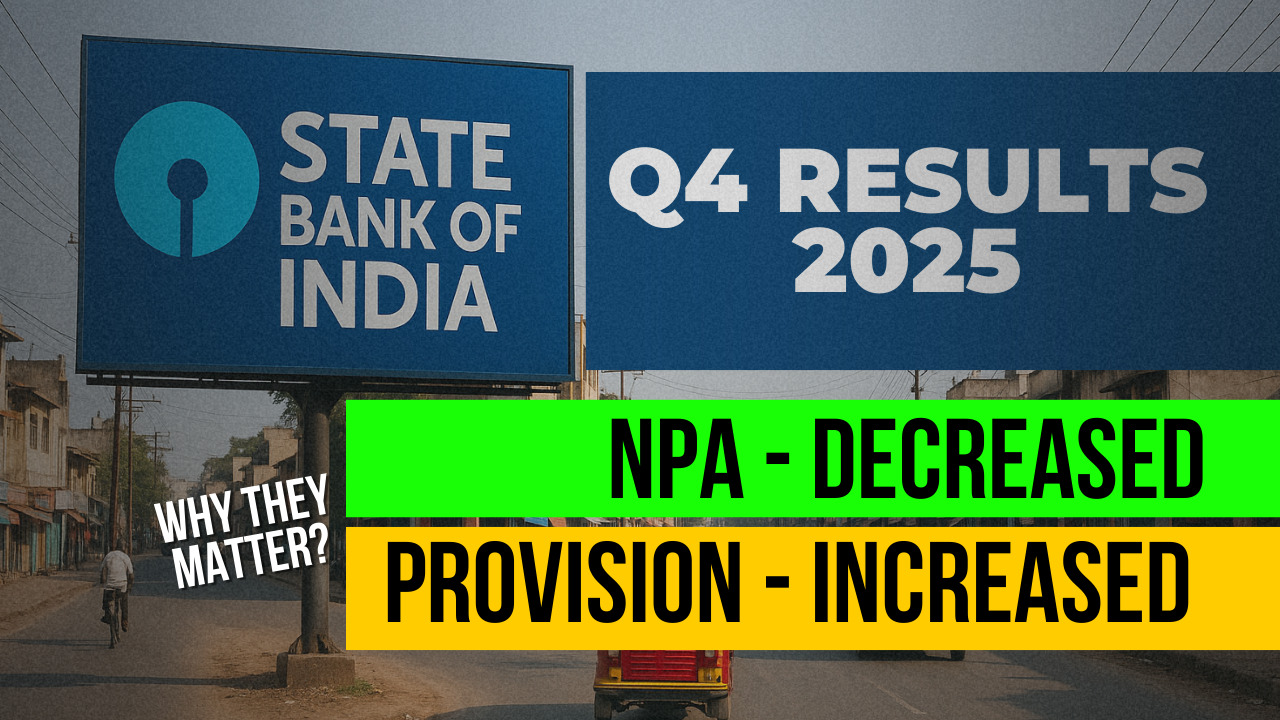
This article is written in the context of State Bank of India’s Q4 results for FY25, where the bank’s gross non-performing assets (NPAs) fell to 1.82% of total advances, indicating that fewer loans are going unpaid. At the same time, SBI’s provisions for bad loans rose by nearly 300% to ₹6,442 crore.
Revenue
₹42,775 crore
₹41,655 crore
Operating Profit
₹31,286 crore
₹28,748 crore
Net Profit
₹18,643 crore
₹20,698 crore
Provisions
₹6,442 crore
₹1,608 crore
Provisions (QoQ)
₹6,442 crore
₹911 crore
Gross NPA (%)
1.82%
2.07% (Q3 FY25)
State Bank of India, the country’s largest bank in terms of assets and deposits, currently holds a market valuation of approximately ₹7,14,014.23 crore. The bank’s shares are trading at a price-to-earnings (P/E) ratio of 9.00, reflecting the multiple investors are willing to pay for its earnings. Over the past five years, SBI’s stock has appreciated by 319.95%, supported by strong financial performance. The earnings per share (EPS) for the trailing twelve months stand at ₹81.75, with a consistent growth rate of 20.56% recorded during the same period.
Below, we explain NPAs and provisions in simple terms and use an example of a small bank to make it clear.
Table of Contents
What Are NPAs?
Simple Definition
See, money is also an asset as it provides economic benefit to the bank in the future. So, non-performing assets or simply called NPA is that money that becomes unable to bring interest to the bank.
Non-Performing Assets (NPAs) are loans where the borrower has stopped paying interest or principal for 90 days or more, or the bank thinks they won’t be repaid in full.
Sometimes NPAs are also called bad loans since they stop generating income for the bank and need special handling.
Why Declining NPAs Matter
Declining NPA simply means the bank is getting interest on the money it has given as a loan, which can lead to banks making more profits.
In technical terms:
When NPAs fall, it means:
Fewer troubled loans: The bank has made better quality loans that customers are repaying on time.
What Are Provisions?
If a bank has a doubt or is almost sure that some part of the total loan it has given to borrowers is not going to come back to the bank (let alone interest), it sets aside some security amount out of its past profit just to offset those bad loans. Those are called provisions.
Provisions lead to reductions in a bank’s retained profits.
Simple Definition in Technical Terms
Provisions for bad loans are money the bank sets aside from its profits to cover loans that might go bad in the future.
In accounting, provisions show up as an expense, reducing the bank’s reported profit because these funds are reserved rather than kept as earnings.
Why Rising Provisions Can Hurt
When a bank increases its provisions:
Lower reported profits: More money is parked in a reserve account, so there’s less profit left to distribute or reinvest.
Signal of caution: It may imply the bank expects more loans to turn bad soon, which can worry investors even if current NPAs are low.
However, provisions are also a sign of responsible and cautious banking. If a bank doesn’t make enough provisions and loans turn bad later, it could hurt the bank’s stability. So, provisions are not always bad—they show the bank is preparing for possible risks.
Putting It All Together with a Simple Bank Example
Imagine a small bank, EasyBank, with:
Total loans of ₹100 crore
Initially, ₹3 crore in NPAs (3% of loans)
It sets aside ₹1 crore as provisions.
Scenario A: NPAs fall
NPAs drop from ₹3 crore to ₹1.82 crore (1.82% of ₹100 crore).
This is great: fewer bad loans, more money coming in from interest.
Scenario B: Provisions rise
EasyBank sees early signs that some newer loans might go bad, so it raises provisions from ₹1 crore to ₹4 crore.
Even though NPAs are low, ₹3 crore extra is taken out of profit and held in reserve.
Result: reportable profit falls since ₹4 crore is an expense, not earnings.
Why SBI’s Q4 FY25 Looks This Way
Gross NPAs at SBI fell to 1.82% of advances (loans), marking healthier loan quality.
But SBI boosted its bad-loan provisions to ₹6,442 crore, reducing net profit for the quarter.
In simple terms: Lower NPAs mean the bank’s loan book is cleaner, while higher provisions mean the bank is being extra cautious and setting aside more money—good for safety but not for short-term profits.
Conclusion
The more NPA drops, the better it is for a bank.
But higher provisions are not always bad. They reduce short-term profit but also show that the bank is being careful and preparing for possible future risks. So, the best situation is when NPAs are low and provisions are made wisely based on risk.
In banking, “advances” refers to the total amount of money that a bank has lent to its customers. Whenever we talk about NPAs as a percentage of advances, we are comparing bad loans to the bank’s entire loan book, that is, all the loans the bank has given out.
Disclaimer: This article is purely intended for informational and educational purposes. It does not constitute financial advice or a recommendation to buy, sell, or hold any financial instrument. The author is not a SEBI-registered financial advisor. Readers are strongly advised to consult with a certified financial advisor before making any investment or financial decisions.
Along with its audited financial results for the fourth quarter (Q4 FY25) and the financial year ended 31 March 2025, the State Bank of India (SBI) has officially announced the SBI Dividend 2025. Despite a decline in profits, the bank has declared an impressive final dividend of ₹15.90 per equity share for its shareholders. The announcement also includes key details such as the SBI Dividend 2025 record date, and the dividend payment date.
About SBI (Company Overview)
Company Name
State Bank of India
Stock Symbol
BSE: 500112 NSE: SBIN
IPO Year
1997 (Listed as a public sector bank)
Stock Exchange
BSE, NSE
Market Cap
₹ 7.75 lakh crore (approximate as of May 2025)
Founder
Government of India (as Imperial Bank in 1921, renamed SBI in 1955)
Incorporation
1955
Headquarter
Mumbai, Maharashtra, India
Sector
Financial Services
Industry
Banking
Specialization
Retail banking, Corporate banking, Insurance, Asset management, Loans, Digital banking
State Bank of India(SBI) is the largest public sector bank in India. It began in 1806 as the Bank of Calcutta. In 1955 the government took charge and renamed it State Bank of India. Its head office is in Mumbai. SBI has over 22 000 branches and 63 000 ATMs across India. It serves more than 500 million customers. SBI also works in 36 countries. It offers savings and current accounts, loans, credit cards, insurance and investment services. It has many units like SBI Life, SBI Mutual Fund and SBI Cards. The Reserve Bank of India calls SBI a systemically important bank. It plays a key role in the Indian economy and leads in digital banking services.
Table of Contents
State Bank of India dividend 2025 – Important Dates
State Bank of India Dividend 2025 Announcement Date
3 May 2025
Type of Dividend
Final Dividend
Dividend Amount
₹15.90 per equity share
SBI ex-dividend date 2025
15 May 2025
SBI dividend record date 2025
16 May 2025
SBI dividend payment date 2025
30 May 2025
The record date for SBI’s 2025 dividend is set at 16 May 2025.
The ex-dividend date for SBI’s 2025 dividend is likely 15 May 2025.
The dividend payment date for SBI’s 2025 dividend is scheduled for 30 May 2025.
Record Date: The cut-off date set by the company to determine which shareholders are eligible to receive the dividend. Only those who own shares on this date get the dividend.
Ex-Dividend Date: Usually one business day before the Record Date. If you buy shares on or after the Ex-Dividend Date, you will not be eligible for the dividend.
Before the SBI dividend 2025 announcement, SBI’s dividend history shows steady growth over the years. This means SBI regularly shares profits with its shareholders. The dividend payout has increased almost every year. That shows SBI cares about giving good returns to its investors.
How to Apply for State Bank of India Dividend 2025?
You do not need to apply yourself. Your broker and the company take care of everything. Just make sure your shareholding details and bank information are up to date. Then, on or after 30 May 2025, SBI will credit the dividend directly to your bank account.
SBI Dividend 2025 – Tax Rules Explained
Since April 2020 dividends are taxable in the hands of shareholders. If your total dividend income exceeds ₹5,000 in a year the company will deduct 10 percent TDS unless you submit a lower-tax certificate. You must include all your dividend income when you file your tax return.
SBI Q4 FY25 Results – Highlights
Particulars
Q4 FY25
Q4 FY24
Revenue
₹42,775 crore
₹41,655 crore
Operating Profit
₹31,286 crore
₹28,748 crore
Net Profit
₹18,643 crore
₹20,698 crore
Provisions
₹6,442 crore
₹1,608 crore
Provisions (QoQ)
₹6,442 crore
₹911 crore
Gross NPA (%)
1.82%
2.07% (Q3 FY25)
Net NPA (%)
0.47%
0.53% (Q3 FY25)
State Bank of India saw revenue rise 2.7% to ₹42,775 crore in Q4 FY25. Operating profit grew 8.8% to ₹31,286 crore. However net profit fell 10% to ₹18,643 crore. Provisions jumped to ₹6,442 crore year on year and also rose sharply quarter on quarter. Asset quality improved as gross NPA fell to 1.82 percent and net NPA to 0.47 percent.
Key Financial Metrics of State Bank of India (SBI)
Metric
Value
Market Capitalisation
₹7,14,014.23
Return on Equity (ROE)
17.26 %
Price-to-Earnings (P/E) Ratio
9.00
Price-to-Book (P/B) Ratio
1.63
5-Year Stock Return
319.95 %
EPS (TTM)
₹81.75
EPS Growth (TTM)
20.56 %
State Bank of India is India’s largest bank by assets and deposits. Its market value is about ₹7,14,014.23 Crore. Investors pay 9.00 times the earnings for its shares. Over the last five years the stock has risen by 319.95%. Its earnings per share over the trailing year are ₹81.75. Those earnings have grown 20.56% in the same period.
Disclaimer: This article is purely intended for informational and educational purposes. It does not constitute financial advice or a recommendation to buy, sell, or hold any financial instrument. The author is not a SEBI-registered financial advisor. Readers are strongly advised to consult with a certified financial advisor before making any investment or financial decisions.
OlympTrade is an online trading platform that allows users to trade in different financial instruments like currencies, stocks and commodities. It became popular because of its easy-to-use app and simple interface.
But many people in India ask one common question – “Why is OlympTrade banned in India?”
This article explains what OlympTrade offers, whether it is legal in India, why it is banned and if it may become legal in the future.
Table of Contents
What Type of Trading Does OlympTrade Allow?
OlympTrade gives users different trading options. Here’s what it offers:
Fixed Time Trading (FTT): You predict whether the price of an asset like gold or a currency will go up or down within a fixed time. If your prediction is correct, you earn a profit. If it is wrong, you lose your money.
Forex Trading: This involves trading currency pairs like USD/INR or EUR/USD. You buy one currency and sell another to earn profit.
Digital Options: This is similar to FTT but usually comes with higher risk and fixed returns. It is more like placing a bet on price movement.
Important Point:
Among all these, forex trading is the main reason why OlympTrade is banned in India.
Is OlympTrade Legal in India in 2025?
Let us look at the rules in India:
Forex trading is controlled by the Reserve Bank of India (RBI) under the Foreign Exchange Management Act (FEMA).
Only RBI-authorized brokers can legally offer forex trading.
OlympTrade is not approved by the RBI.
So right now, OlympTrade is not legal in India in 2025, especially for forex trading.
Why Is OlympTrade Banned in India?
Here are the main reasons:
No RBI Approval: On October 22, 2024, the RBI published an alert list. OlympTrade is listed as an unauthorized platform.
User Safety Risks: Unapproved platforms may not have proper safety features. This can lead to fraud or users facing problems while withdrawing money.
Legal Trouble: Trading on unauthorized platforms can lead to legal penalties. FEMA allows Indian residents to trade only through authorized dealers.
This confirms that OlympTrade is not allowed to operate forex trading in India.
Countries Where Olymp Trade Is Banned
Olymp Trade is not available in over 50 countries. It is banned in all European Union members such as France, Germany, Italy, and Spain.
It is also banned in North America and Oceania, including the United States, Canada, and New Zealand.
In Asia and the Middle East it is banned in Iran, North Korea, Iraq, Syria, Myanmar, Lebanon, Libya, and Yemen.
In Africa it is banned in Somalia, Sudan, Zimbabwe, Ethiopia, Mali, Liberia, Mauritius, Congo, Central African Republic, and Eritrea. Residents of these countries cannot open a new account or make trades on the platform.
Will OlympTrade Be Allowed in India in the Future?
As of now, there is no sign that the ban will be lifted.
OlympTrade must get approval from the RBI under FEMA.
Until that happens, using OlympTrade for forex trading is considered illegal.
Palantir Technologies Inc. (PLTR) is a well-known name in the world of data analytics and artificial intelligence. It offers powerful software platforms that help both businesses and governments make smarter decisions using data. Here’s a quick look at some important company details, followed by a simple summary of what Palantir does and why it matters.
Company Name
Palantir Technologies, Inc.
Sector
Technology
Industry
Software – Infrastructure
IPO Year
2020
Stock Exchange Listed
NYSE
Founded By
Peter Thiel, Alex Karp, Stephen Cohen, et al.
Established In
2003
Headquarters
Denver, Colorado, USA
Specialization
AI-Powered Data Analytics, Big Data Solutions
In simple terms, Palantir was founded in 2003 and is based in Denver, Colorado. It focuses on advanced data tools like Gotham, Foundry, and Apollo. These tools help users understand large amounts of data quickly and clearly. Palantir mainly works with government agencies and big companies, helping with everything from defense planning to business operations. In 2020, it went public through a direct listing. Its inclusion in the S&P 500 in 2025 shows how far it has come.
The Stock Market: Fundamentally Driven
Stock prices are influenced by a combination of company performance, economic conditions, and industry trends. For Palantir, key factors include revenue growth, profitability, contract acquisitions, and the broader adoption of AI technologies.
In Q1 2025, Palantir reported a 39% year-over-year revenue growth, reaching $883.9 million. Notably, U.S. commercial revenue surged by 71% to $255 million, and government revenue increased by 45% to $373 million. These figures highlight Palantir’s ability to capitalize on the growing demand for AI solutions.
However, macroeconomic factors such as interest rates, regulatory policies, and global defense spending also play a role in stock performance. Investors should consider these elements when evaluating Palantir’s long-term prospects.
Sector Overview: Technology
Understanding the Sector
Palantir operates within the dynamic Technology sector, encompassing software, hardware, and IT services. This sector is at the forefront of innovation, with AI and data analytics driving significant transformations across industries.
Fundamental Factors Affecting the Sector
Several factors shape the Technology sector:
Technological Advancements: Breakthroughs in AI, cloud computing, and machine learning fuel growth and competition.
Regulatory Environment: Data privacy laws and government contracts influence operational strategies.
Economic Conditions: Interest rates and corporate budgets impact tech spending and investment.
Growth and Development in Recent Years
The Technology sector has experienced explosive growth, particularly in AI and data analytics. Palantir’s recent performance reflects this trend, with significant increases in both commercial and government revenues. Strategic partnerships, such as the $795 million contract with the U.S. Army for the Maven Smart System, underscore the sector’s role in defense and enterprise innovation. Additionally, improved U.S.-China trade relations in 2025 have bolstered tech stocks, enhancing market sentiment.
Industry Analysis: Software – Infrastructure
Exploring the Industry
Within the Technology sector, Palantir competes in the Software – Infrastructure industry, focusing on platforms that enable data management, cloud computing, and AI-driven analytics. This industry is characterized by high innovation, significant R&D investment, and a growing reliance on software for operational efficiency.
Fundamental Factors Impacting the Industry
The Software – Infrastructure industry is influenced by:
AI Adoption: Enterprises are increasingly integrating AI to gain competitive advantages.
Digital Transformation: Organizations are leveraging software solutions to streamline operations and enhance decision-making.
Strategic Partnerships: Collaborations with government and commercial entities drive growth and innovation.
Recent Growth and Developments
The industry has witnessed significant growth, driven by the global push for digital transformation. Palantir’s Q1 2025 revenue of $883.9 million, up 39% year-over-year, reflects this momentum. The company’s platforms, like Foundry, have enabled enterprises to streamline operations, exemplified by its work with Fannie Mae to reduce investigation times from 60 days to seconds. Strategic government contracts, such as the $1.3 billion Maven Smart System deal, further highlight the industry’s critical role in defense and intelligence.
Stock Growth and Fundamental Factors
Palantir’s stock has experienced remarkable growth, soaring 71% year-to-date in 2025 and nearly 500% over the past year. This surge is driven by strong fundamentals, including a 66% increase in contract value to $1.5 billion in Q1 2025 and significant U.S. government contracts. These align with the Technology sector’s growth in AI adoption and the Software – Infrastructure industry’s push for scalable solutions.
However, Palantir’s high valuation—trading at over 200 times earnings—suggests potential downside risk if growth expectations falter. Continued innovation and contract wins will be crucial for sustaining this trajectory.
Technical analysis provides speculative insights into Palantir’s stock price movements. As of May 30, 2025, with the stock at $124.77, key indicators include:
Moving Averages: The 50-day moving average is trending above the 200-day moving average, signaling bullish momentum.
Support and Resistance: Support is around $120, with resistance near $131.50.
Relative Strength Index (RSI): An RSI of approximately 55 suggests neutral momentum, with room for growth but not overbought.
Speculative Long-Term Price Targets
Using a generalized growth model based on historical market trends and Palantir’s fundamentals, we estimate the following price targets, assuming a 10% annual growth rate (aligned with S&P 500 averages) from the current price of $124.77.
To account for Palantir’s high-growth potential, a range of 5% (conservative) to 15% (optimistic) is included:
2030 (5 years):
Median Price (10% growth): $124.77 × (1.10)^5 ≈ $201.
These targets assume Palantir sustains its growth trajectory, driven by AI demand and government contracts. However, its high valuation introduces risk if market sentiment shifts. Technical indicators support near-term optimism, but long-term forecasts are highly speculative due to potential regulatory, competitive, and economic challenges.
Long-Term Growth Prospects
Palantir’s long-term growth prospects are promising but not without risks. Its AI platforms, like Foundry and Gotham, have driven record revenues, with Q1 2025 showing 39% growth and a $1.5 billion contract backlog.
Strategic partnerships, such as the Pentagon’s $1.3 billion Maven Smart System contract, and potential expansion into markets like Saudi Arabia bolster its outlook. However, its lofty valuation—520x trailing earnings—raises concerns about sustainability.
If Palantir continues to secure high-value contracts and expand its commercial client base, it could maintain strong growth. Yet, competition from rivals like ServiceNow and economic uncertainties pose challenges. Investors should balance these opportunities with the stock’s premium pricing.
Conclusion
Palantir Technologies has become a strong and well-known name in the technology world, especially in the area of software and artificial intelligence. The company has grown a lot in recent years. In 2025 alone, its stock price went up by 71%, and it earned a record revenue of $883.9 million in just the first quarter. This growth came mainly from strong business with the U.S. government and big companies.
Looking ahead, there is a lot of excitement about how big Palantir can grow. Based on its current progress, some experts believe the stock could reach around $200 by 2030, $520 by 2040, and even $1,348 by 2050. These numbers are just estimates, and they depend on how well Palantir keeps growing and winning new contracts.
However, there are also risks. Palantir’s stock is currently very expensive compared to its profits. This means investors are expecting a lot from the company. If Palantir doesn’t grow as fast as expected or faces tough competition, the stock could also go down.
So, if you’re thinking of investing in Palantir for the long term, it’s important to watch the company carefully. Keep an eye on how it performs in the coming years and how the market and technology trends change. Make sure to understand both the opportunities and the risks before making any decisions.
Disclaimer: The views and opinions expressed in this article are solely those of the author and are intended for informational purposes only. They do not constitute financial, investment, or trading advice. Any stock price predictions mentioned are purely speculative and based on personal analysis. Past performance is not indicative of future results. Readers are advised to conduct their own research and, if necessary, consult a certified financial advisor before making any investment decisions. The author does not accept any liability for financial losses or gains arising from the use of this content.
Martin Eberhard, Marc Tarpenning, Elon Musk, JB Straubel, Ian Wright
Incorporation
2003
Headquarter
Austin, Texas, United States
Sector
Consumer Discretionary
Industry
Automotive & Energy
Specialization
Electric Vehicles, Battery Energy Storage, Solar Energy Solutions
Table of Contents
Company Overview (NASDAQ: TSLA)
Tesla, Inc. (NASDAQ: TSLA) is an American multinational enterprise that designs, manufactures, and sells electric vehicles, solar energy systems, and energy storage solutions. Founded in 2003 by Martin Eberhard, Marc Tarpenning, Ian Wright, JB Straubel, and Elon Musk, Tesla’s mission is to accelerate the world’s transition to sustainable energy.
Through models such as the Model S, Model 3, Model X, and Model Y, Tesla has disrupted the automotive market. Additionally, its Powerwall, Powerpack, and Solar Roof products have reshaped the renewable energy landscape.
This analysis presents forecasted share price ranges for 2025, 2030, 2040, and 2050. We also examine tomorrow’s price target, key earnings metrics, and the case for and against investing in Tesla.
Tesla, Inc. is headquartered in Austin, Texas. It specializes in:
Electric Vehicles (EVs): Luxury and mass-market models with advanced battery technology and over-the-air software updates.
Energy Products: Solar panels, Solar Roof tiles, and stationary energy storage (Powerwall & Powerpack).
Tesla’s vertically integrated business model—from cell manufacturing to vehicle assembly—enhances its cost efficiency and innovation pipeline.
Key Growth Factors of Tesla
The revenue has grown at a CAGR of about 61.7% since 2010.
Tesla’s stock price has grown at a CAGR of approximately 45.1% since its 2010 IPO.
Tesla Stock Price Forecast and Target for 2025
In 2025, Tesla’s stock price target is projected to be around $452.46, based on the average of major market forecasts.
This price reflects the strong growth trajectory Tesla is likely to continue, driven by its innovative position in the electric vehicle (EV) sector and its expanding footprint in renewable energy solutions. The electric vehicle sector, part of the broader automotive industry, is expected to experience significant growth, with increasing global demand for sustainable transportation options. Tesla, as a market leader, is well-positioned to benefit from advancements in battery technology and its autonomous driving systems.
However, this projection also takes into account broader geopolitical and economic factors. Geopolitical tensions, particularly trade relations between major economies, could have an impact on Tesla’s manufacturing and supply chain. On the economic front, while interest rates and inflation remain critical issues in many countries, Tesla’s ongoing innovation and leadership in both EVs and energy solutions could help mitigate some of these macroeconomic pressures. Additionally, the global push toward sustainability and the shift toward cleaner energy could continue to drive Tesla’s growth, despite any short-term volatility in the global economy or political landscape.
Forecast Range
Let’s assume a sensible forecast range around the average:
Low (Yearly Minimum): $420
High (Yearly Maximum): $485
Year
Low
High
2025
$420
$485
Tesla Stock Price Forecast and Target for 2030
Rationale
Key determinants by 2030 include successful deployment of Full Self-Driving (FSD) software, continued cost reduction in battery cells, and expansion of gigafactories worldwide.
Forecast Range
Year
Low (\$)
High (\$)
2030
800
1,032
Monthly breakdown anticipates incremental capacity additions and regulatory approvals:
Month
Low (\$)
High (\$)
January
800
878
February
820
850
March
832
871
April
844
879
May
853
890
June
867
911
July
885
923
August
898
936
September
905
957
October
947
978
November
964
990
December
988
1,032
Price Forecast for 2040
Rationale
By 2040, widespread EV adoption, advancements in solid-state batteries, and dominance in energy services could substantially elevate valuation multiples.
Forecast Range
Year
Low (\$)
High (\$)
2040
1,244
1,421
Projected monthly figures assume technological breakthroughs and market saturation dynamics:
Month
Low (\$)
High (\$)
January
1,244
1,287
February
1,261
1,296
March
1,276
1,307
April
1,288
1,321
May
1,269
1,308
June
1,280
1,321
July
1,298
1,355
August
1,288
1,350
September
1,294
1,367
October
1,311
1,387
November
1,350
1,401
December
1,390
1,422
Price Forecast for 2050
Rationale
Long-term drivers include Tesla’s potential leadership in autonomous mobility services, energy grid integration, and diversified revenue streams beyond automotive sales.
Forecast Range
Year
Low (\$)
High (\$)
2050
1,725
1,923
Anticipated monthly values reflect progressive market maturation and recurring service revenues:
Month
Low (\$)
High (\$)
January
1,725
1,768
February
1,736
1,777
March
1,751
1,790
April
1,767
1,812
May
1,789
1,834
June
1,775
1,821
July
1,790
1,853
August
1,811
1,871
September
1,843
1,890
October
1,832
1,876
November
1,852
1,890
December
1,870
1,923
Consolidated Forecast Summary
Year
Low
High
2025
$186
$503
2030
$800
$1,032
2040
$1,244
$1,421
2050
$1,725
$1,923
Divergent expert opinions underscore the inherent uncertainty in projecting equity valuations over extended horizons.
Investment Considerations
When evaluating TSLA, consider:
Growth Catalysts: New vehicle launches, FSD progress, energy services expansion.
Valuation Risks: High P/E multiples relative to traditional automakers.
Competitive Landscape: Intensifying rivalry from legacy OEMs and emerging EV startups.
Regulatory Factors: Government incentives and emission standards worldwide.
Latest Financial Metrics for Tesla
Metric
Value
Market Capitalization
$807.62 billion
Price/Earnings (P/E)
121.50
Earnings Per Share (EPS)
$2.32 (TTM)
Diluted EPS
$2.13 (TTM)
Net Profit Margin
5.8%
Revenue
$95.72 billion (TTM)
Net Income
$7.60 billion (TTM)
Operating Income
$8.84 billion (TTM)
Cash Flow from Ops
$13.29 billion (TTM)
Cost of Goods Sold
$78.13 billion (TTM)
Tesla’s robust revenue growth reflects sustained consumer demand for EVs and energy products.
Investment Thesis: Bull vs. Bear Cases
Bull Case
Rapid Scale: Global giga-factory network enables cost leadership.
Software Upside: FSD subscription revenues could transform margins.
Energy Integration: Vertically integrated energy products offer recurring revenue streams.
Brand Equity: Strong consumer loyalty and market positioning.
Execution Risks: Production bottlenecks or FSD delays could erode confidence.
Competition: Traditional automakers and tech entrants intensify market share battles.
Macroeconomic Headwinds: Rising interest rates and supply chain disruptions.
Conclusion
Tesla’s pioneering technology and diversified business model position it for substantial long-term growth. However, lofty valuations and execution challenges inject volatility into its share price trajectory. Investors must align TSLA’s risk-reward profile with their strategic objectives.
Frequently Asked Questions
1. How has Tesla’s share price performed historically? Over the past decade, TSLA shares have appreciated by over 10,000%, driven by product innovation and market optimism.
2. Beyond automobiles, what other segments does Tesla operate in? Tesla’s portfolio includes solar energy systems and stationary energy storage solutions.
3. What are the primary risks to Tesla’s valuation? Key risks include regulatory changes, competitive pressures, and execution shortfalls.
4. Is Tesla consistently profitable? Yes. Tesla has delivered consecutive profitable quarters and expanding margins.
5. Can TSLA reach \$1,000 per share? Many analysts believe a \$1,000 price point is attainable by 2029–2030, contingent on sustained growth.) please fact check this article and transform it into the corrected one and also notify about the mistakes it has . do not shorten the word count.
Disclaimer: The views and opinions expressed in this article are solely those of the author and are intended for informational purposes only. They do not constitute financial, investment, or trading advice. Any stock price predictions mentioned are purely speculative and based on personal analysis. Past performance is not indicative of future results. Readers are advised to conduct their own research and, if necessary, consult a certified financial advisor before making any investment decisions. The author does not accept any liability for financial losses or gains arising from the use of this content.