CAGR stands for Compound Annual Growth Rate. It’s a useful measure to understand how much an investment has grown over a specific period, assuming that the investment grows at a steady rate each year. The formula for calculating CAGR is:
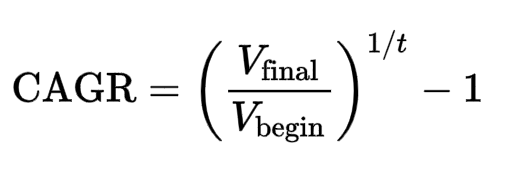
where
 | = | Compound Annual Growth Rate |
 | = | Initial Amount |
 | = | Final Amount |
 | = | Time in years |
Click Here to Calculate the CAGR of Your Investment
Table of Contents
What is the full form of CAGR?
CAGR stands for Compound Annual Growth Rate.
What is CAGR in SIP?
CAGR in SIP (Systematic Investment Plan) measures the growth rate of investments made through regular contributions over time. It helps investors understand the overall growth of their invested funds, taking into account the compounding effect of their periodic investments.
Can CAGR Be Negative?
Yes, CAGR can be negative. A negative CAGR indicates that the value of an investment has decreased over the specified period.
Which is Better, CAGR or Absolute Return?
CAGR and absolute return serve different purposes. Absolute return measures the total growth of an investment without considering the time period, while CAGR accounts for the length of time and provides an annualized growth rate. For a more comprehensive understanding of investment performance, CAGR is often preferred.
What is a Good CAGR (Compound Annual Growth Rate)?
A good CAGR depends on the context and the type of investment. Generally, a CAGR of 7-10% is considered good for stock investments, while higher rates are exceptional. For low-risk investments, a CAGR of 3-5% might be deemed satisfactory.
What Does 5% CAGR Mean?
A 5% CAGR means that an investment has grown at an average annual rate of 5% over a specified period. This steady growth rate helps in understanding the performance of the investment, smoothing out the effects of volatility.
Is a CAGR of 5% Good?
Whether a CAGR of 5% is good depends on the context. For some stable, low-risk investments, a 5% CAGR could be considered solid. However, for higher-risk investments like stocks, a 5% CAGR might be seen as modest.
What Does 10% CAGR Mean?
A 10% CAGR indicates that an investment has grown at an average annual rate of 10%. This is generally seen as a good return, especially for long-term investments, as it often outpaces inflation and savings account returns.
Is a CAGR of 12% Good?
A CAGR of 12% is considered quite good. It indicates that your investment has grown by 12% every year, compounded annually. This rate of return is generally higher than average market returns and can signify a strong performance of the investment.
Is 40% CAGR Good?
A 40% CAGR is exceptionally good and indicates a very high growth rate. Such a high CAGR is uncommon and usually signifies a rapidly growing investment or company. However, it’s essential to consider the sustainability of such high returns.
How Much CAGR is Good for Industry?
A good industry CAGR varies by sector. For mature industries, a CAGR of 5-10% might be considered strong. Emerging industries may exhibit higher CAGRs, often exceeding 15-20%, reflecting rapid growth and innovation.
What is the Rule of 72 and CAGR?
The Rule of 72 is a simple way to estimate how long it will take for an investment to double, given a fixed annual rate of return. By dividing 72 by the CAGR, you can estimate the number of years required for doubling the investment.
What is XIRR?
XIRR is a method used to calculate the internal rate of return for a series of cash flows that occur at irregular intervals. It is particularly useful for investments with multiple transactions over time, such as SIPs.
Are CAGR and XIRR the Same?
CAGR and XIRR (Extended Internal Rate of Return) are not the same, although both measure investment performance. While CAGR assumes a single annual growth rate over the entire investment period, XIRR takes into account the exact dates and amounts of irregular cash flows, providing a more precise measure of investment performance.
Conclusion
Understanding CAGR is essential for evaluating investment performance over time. It helps investors make informed decisions by providing a clear picture of growth rates, smoothing out market volatility. Whether assessing personal investments or industry performance, knowing how to interpret CAGR and related metrics like XIRR can significantly enhance financial analysis and planning.