In this article, we will go through the basics of F&O trading and intraday trading. We will also discuss whether there is a difference between the two. So let’s get started.
Table of Contents
What is F&O?
F&O stands for futures and options. These are derivative instruments, which means they derive their value from some underlying asset. Think of it like orange juice derived from oranges. Both orange juice and oranges are sold at different prices in the market, but the price of orange juice fluctuates based on the price of oranges.
Similarly, if the asset is a stock, its derivative will have its value derived from the stock’s prices.
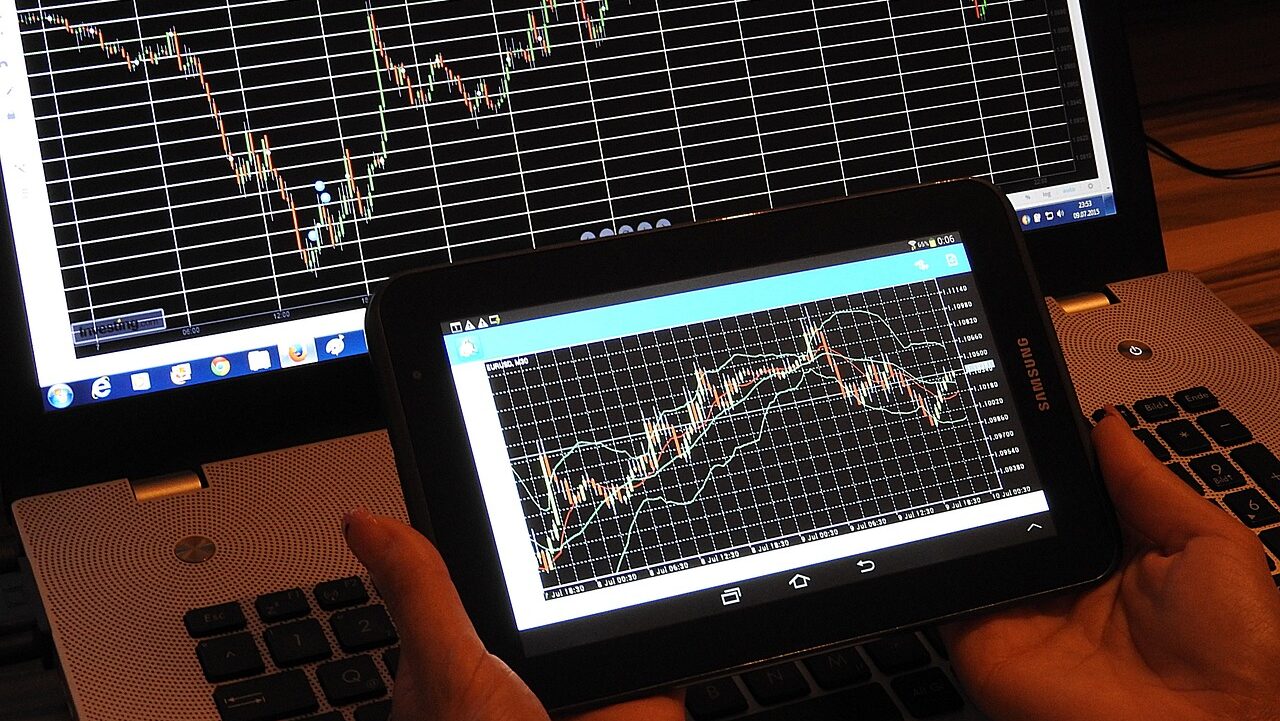
What is Intraday Trading?
Intraday trading is a style of trading. It is also known as day trading. This style of trading starts in the morning and ends at the close of the market on the same day.
For example, if you buy a stock in the morning and sell it just before the market closes, that is called an intraday trade.
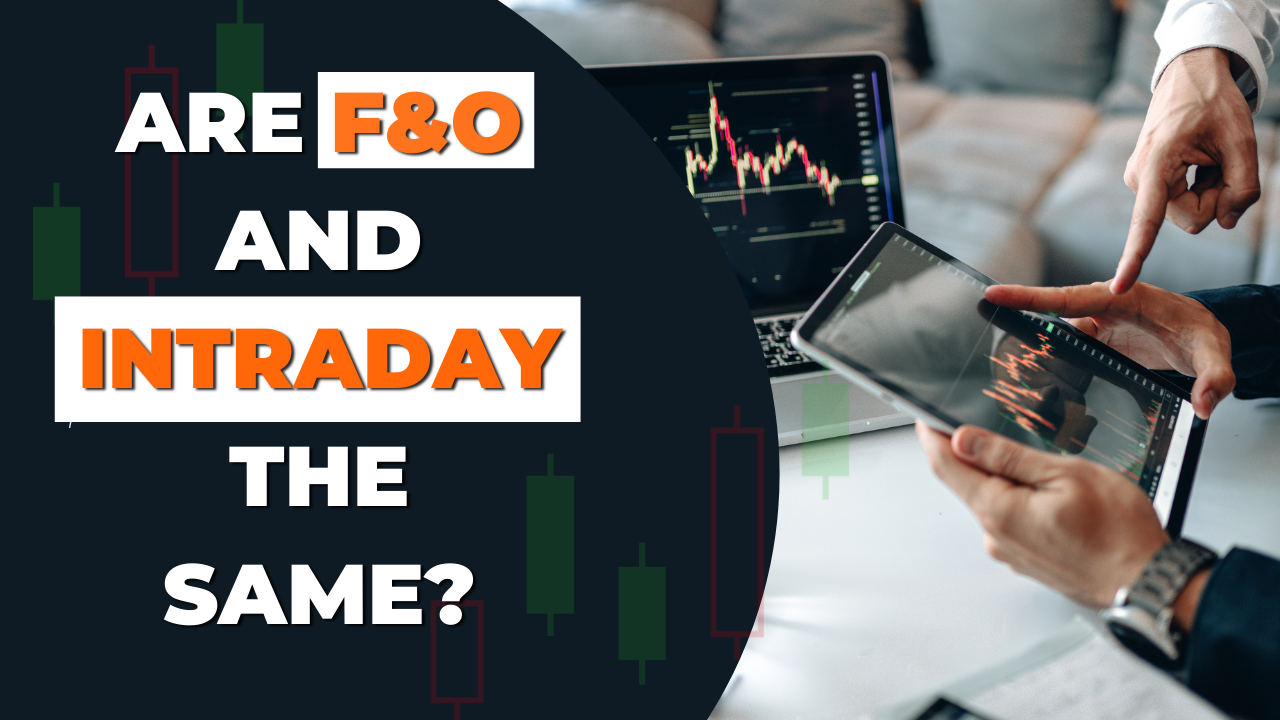
Are F&O and Intraday the Same?
No, F&O and intraday are not the same. They are different concepts altogether. F&O refers to derivatives, while intraday is a genre of trading.
If you buy a futures contract of a stock and sell it on the same day before the market closes, you have traded that futures contract on an intraday basis. However, if you hold that futures contract for 2-3 days and then sell it, that trade will not be considered an intraday trade.
Which is Better: Intraday or F&O?
F&O (futures and options) are types of trading instruments, while intraday is a form of trading. Which is better really depends on the individual. You can trade F&O on an intraday basis, or you can hold F&O contracts for days and then sell them. Holding F&O contracts for days is called positional trading.
You can also trade stocks on an intraday basis. Additionally, currencies and commodities can also be traded on an intraday basis or on a positional basis.
Final Thoughts
In summary, F&O (futures and options) are financial instruments that derive their value from underlying assets like stocks. Intraday trading, on the other hand, is a trading style where you buy and sell stocks or derivatives within the same trading day. Understanding the difference between these two concepts is important for anyone who is thinking of starting their trading journey. Happy learning.
Are F&O and option trading the same?
Options trading is a part of the derivative segment. Both futures and options are derivative instruments, but they are different. We can say options trading is a part of F&O trading, which comes under derivative instruments.
Is options trading similar to day trading?
No, options are trading instruments that are called derivatives, while day trading is a trading style. However, you can day trade options, meaning you can trade options on an intraday basis.
Is futures trading intraday?
Futures trading is not limited to intraday. It depends on the trader’s strategy and goals. Both intraday and long-term futures trading have their own risks and rewards.
Is intraday trading good for beginners?
Beginners should focus on learning first. Whether it’s intraday or positional trading, if you don’t have enough knowledge and experience, you might lose money.
For learning purposes, intraday trading can be good for beginners. However, it is advised to start with a small amount of money