This graphite electrode manufacturer approves 1:5 stock split soon after weak Q1 results

HEG Ltd is a prominent company of the LNJ Bhilwara group and is India’s leading graphite electrode manufacturer. Recently, it announced a stock split in the ratio of 1:5. Each equity share with a face value of Rs. 10/- will be split into 5 equity shares with a face value of Rs. 2/- each. The decision was approved on August 13, 2024, and is subject to the approval of the members through a Postal Ballot. The company will announce the Record Date for the stock split very soon.

Read the official notification here

About HEG Ltd

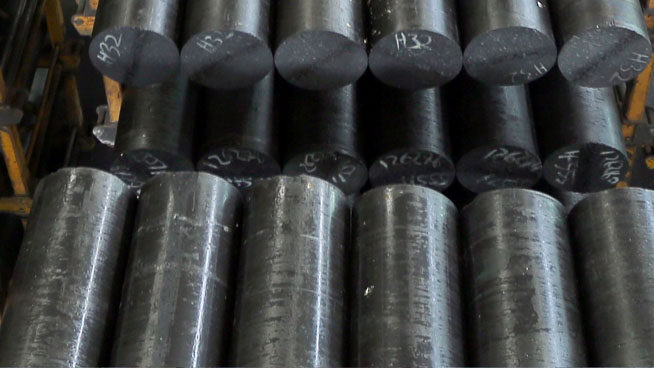
HEG Ltd is a key player in the graphite electrode manufacturing industry, with one of the largest integrated Graphite Electrode plants in the world. The company is known for processing sophisticated UHP (Ultra High Power) Electrodes and has a strong presence in both domestic and international markets.

HEG Ltd Shares Performance

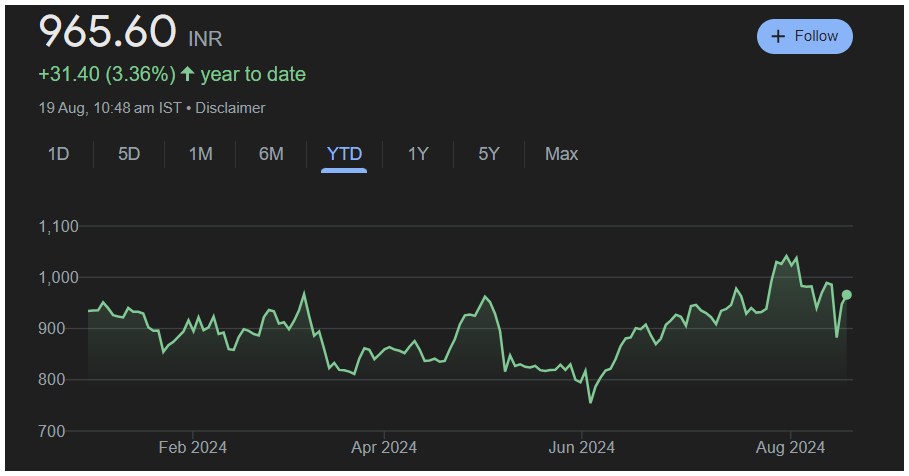
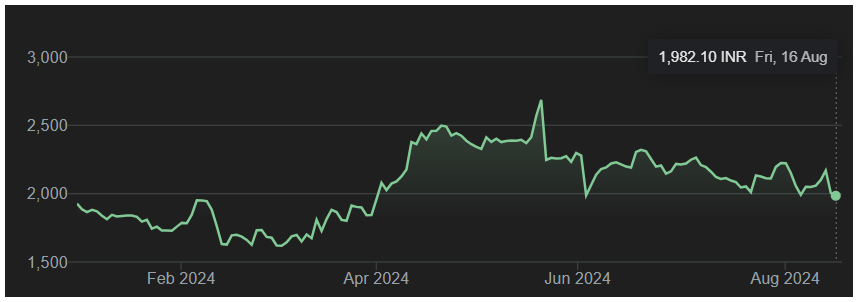
HEG shares have experienced mixed performance over different timeframes. Over the past 6 months, the stock surged by 22%, but it has declined by 16% in the last 3 months. In the last 1 year, the stock soared by 15%, and over the last 2 years, it gained 56%. However, the stock has seen a decline of 14% in the last 3 years. Despite this, HEG shares have offered a return of 98% over the last 5 years.

TimeframePerformance
Last 6 months+22%
Last 3 months-16%
Last 1 year+15%
Last 2 years+56%
Last 3 years-14%
Last 5 years+98%

The 52-week high price of HEG shares on the BSE is Rs. 2744.60 per share (as of May 22, 2024), while the 52-week low price is Rs. 1466.85 per share (as of October 26, 2023).

https://feelthecandlesticks.com/heg-ltd-approves-stock-split/

Weak Q1 Results Trigger Sharp Decline in HEG Shares

MetricQ1 FY25 (June 30, 2024)Q1 FY24 (June 30, 2023)Change
Standalone Net ProfitRs. 2.58 croreRs. 97.56 crore-97.36%
Standalone Revenue from OperationsRs. 571 croreRs. 671 crore-14.90%
Total Standalone IncomeRs. 592 croreRs. 698 crore-15.17%

HEG Ltd reported its Q1 FY25 results, which revealed a significant decline in profitability. The company’s standalone net profit for the quarter ended June 30, 2024, dropped to Rs. 2.58 crore, down from Rs. 97.56 crore in the corresponding quarter of last year. Standalone revenue from operations also declined to Rs. 571 crore, compared to Rs. 671 crore in the same quarter of the previous year. The total standalone income for the quarter was Rs. 592 crore, down from Rs. 698 crore in the corresponding quarter of last year.

Following the announcement of these weak financial results, HEG shares witnessed a sharp decline of over 8% on the BSE, with the current market price standing at Rs. 1994.75 per share.

Also Read – This Cable Making Company has Announced a Share Buyback worth ₹112 Crore

HEG Ltd Share Holding Pattern

Here’s a table presenting the shareholding pattern for June 2024:

CategoryJune 2024
Promoters55.77%
FIIs6.06%
DIIs13.08%
Public25.08%
No. of Shareholders1,19,399
  • Promoters: Their stake has remained relatively stable with a minor decrease to 55.12%, indicating a slight reduction in their shareholding.
  • FIIs (Foreign Institutional Investors): Their share has decreased to 6.06%, down from previous levels, reflecting a reduction in their investment.
  • DIIs (Domestic Institutional Investors): DIIs have increased their stake to 13.08%, showing a significant rise and growing confidence in the company.
  • Public: The public’s shareholding has decreased to 25.08%, marking a decline from earlier periods.

This Cable Making Company has Announced a Share Buyback worth ₹112 Crore

https://feelthecandlesticks.com/suprajit-engineering-limited-has-announced-a-share-buyback-worth-112-crore/

Suprajit Engineering Limited is a prominent player in the automotive components industry. It has announced a significant buyback plan worth ₹112 crore for its equity shares on 14th August, 2024. The record date for this buyback is August 27, 2024.This article provides an in-depth analysis of the buyback and also includes details about the company, its financial performance, and the implications of the buyback for shareholders.

Company Overview

Suprajit Engineering Limited was established in 1985. It has grown into one of the leading manufacturers of automotive cables and halogen bulbs. The company supplies its products to a wide range of sectors, including the automotive, non-automotive, and aftermarket segments. Over the years, It has expanded its global footprint and It caters to customers in several countries. The company’s commitment to quality, innovation, and customer satisfaction has strengthened its position as a trusted supplier in the automotive industry.

https://feelthecandlesticks.com/suprajit-engineering-limited-has-announced-a-share-buyback-worth-112-crore/

Financial Performance

Suprajit Engineering Limited reported a strong financial performance for the quarter ended June 2024. The company’s net profit increased by 15.16%, reaching ₹38.14 crore, compared to ₹33.12 crore in the same quarter of the previous year. Additionally, revenue saw an 8.12% rise, amounting to ₹734.86 crore, up from ₹679.68 crore in the June 2023 quarter. This growth reflects the company’s ability to enhance profitability and maintain a steady increase in revenue.

Here’s a table summarizing Suprajit Engineering Limited’s financial results for the quarter ended June 2024:

MetricQ1 FY2024 (June 2024)Q1 FY2023 (June 2023)Growth
Net Profit₹38.14 crore₹33.12 crore15.16%
Sales₹734.86 crore₹679.68 crore8.12%

The revenue growth has been driven by both domestic and international sales, showcasing the company’s competitive edge and market demand for its products.

Important Financial Metrics

MetricValue
Market Cap₹7,465 Cr.
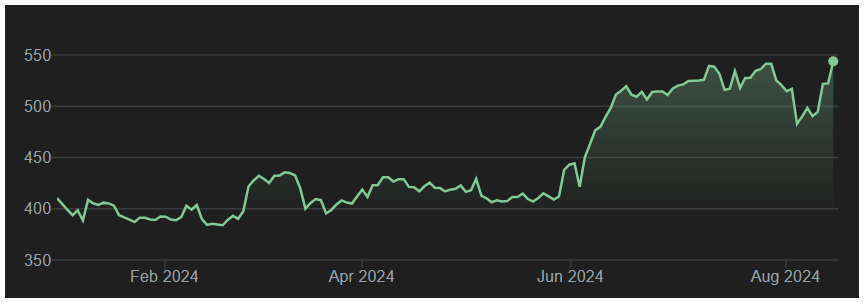
Current Price₹539
High / Low₹566 / 353
Stock P/E43.3
Book Value₹98.4
Price to Book Value5.48
Dividend Yield0.20%
ROCE (Return on Capital Employed)13.9%
ROE (Return on Equity)12.9%
Face Value₹1.00
Industry P/E34.4
Debt to Equity Ratio0.52
Return on Assets6.62%
EBIT₹290 Cr.
Industry PBV (Price to Book Value)3.76
EV/EBITDA20.4
EPS (Earnings Per Share)₹12.4

Shareholding Pattern

Here’s a table summarizing the shareholding pattern of Suprajit Engineering Limited for June 2024:

CategoryShareholding Percentage
Promoters44.62%
FIIs (Foreign Institutional Investors)5.82%
DIIs (Domestic Institutional Investors)16.94%
Public32.64%

Promoters hold a significant stake in the company, which is often seen as a positive indicator of their confidence in the company’s long-term growth potential.

Buyback Details

The buyback plan announced by Suprajit Engineering involves repurchasing up to 15,00,000 equity shares at a price of ₹750 per share. This buyback price is almost 38% higher than the closing price on Wednesday. This buyback represents approximately 1.08% of the company’s total outstanding shares and amounts to a total value of ₹112.5 crore. It will be conducted through a tender offer, which allows shareholders to tender their shares at the specified price within a designated time frame.

The record date for determining the eligibility of shareholders to participate in the buyback is August 27, 2024. Shareholders who hold shares as of this date will be eligible to tender their shares in the buyback.

Read the full details here – Official Notification

Implications of the Buyback

The decision to buy back shares is often a strategic move by companies to optimize their capital structure, return excess cash to shareholders, and signal confidence in the company’s future. In the case of Suprajit Engineering, the buyback serves several purposes:

  1. Enhancement of Shareholder Value: By reducing the number of shares outstanding, the company aims to increase the earnings per share (EPS), which can potentially lead to an appreciation in the share price.
  2. Efficient Capital Allocation: The buyback allows the company to utilize its surplus cash in a manner that benefits shareholders directly. This can be particularly appealing to investors seeking returns in the form of capital gains rather than dividends.
  3. Positive Market Signal: A share buyback is often interpreted as a sign that the company’s management believes the shares are undervalued. It sends a positive signal to the market about the company’s financial health and growth prospects.
  4. Improved Return on Equity (ROE): By reducing the equity base, the buyback can lead to an improvement in the company’s return on equity, making the company more attractive to investors.

Also Read – Bondada Engineering Announced the Stock Split Date

Conclusion

The buyback announced by Suprajit Engineering Limited is a clear indication of the company’s strong financial position and management’s confidence in its future growth. For shareholders, the buyback offers an opportunity to realize value either by tendering their shares at a premium or by holding onto a potentially more valuable stake in the company.

This buyback is expected to positively impact the company’s share price and overall market perception, making it a noteworthy event for both existing and prospective investors. As with any investment decision, it is essential for shareholders to consider their individual financial goals and consult with a financial advisor to determine the best course of action.

In conclusion, Suprajit Engineering’s buyback is not just a financial maneuver but a strategic initiative that aligns with the company’s long-term growth objectives and commitment to enhancing shareholder value.

Bondada Engineering Announced the Stock Split Date

Bondada Engineering has fixed the record date for the split of equity shares. The firm has announced Monday, September 2, 2024, as the record date for the entitlement of shareholders to this corporate action.

Once the subdivision is approved, each equity share of ₹10 face value will be subdivided or split into five equity shares of ₹2. The purpose of this move is to reduce the unit price and make the shares more accessible to investors, which may eventually increase liquidity.

Read the official notification here

Company Overview

Bondada Engineering Limited is an engineering and construction company based in Hyderabad, Telangana. It has wide operational footprints in India and is known for its proficiency across multiple engineering domains, primarily in infrastructure development. Focusing on innovation and quality, Bondada has established a strong track record of project deliveries, achieving high benchmarks and earning a reputable image as a reliable partner in the industry.

bondada engineering share split date

Financial Performance

Bondada Engineering Limited is a profitable entity with a solid financial performance over the years, supported by its robust order book and efficient project execution. It has consistently grown its revenue while remaining profitable. For FY 23-24, the company generated a revenue of ₹801 crore with a net profit of ₹46 crore.

The latest decision to demerge some of its equity shares aligns with its strategic agenda of creating long-term shareholder value and broadening market participation.

Key Financial Metrics

MetricValue
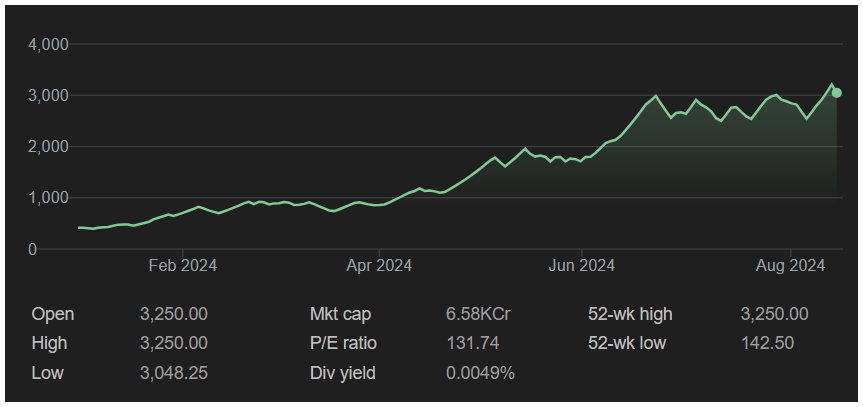
Market Capitalization₹ 7,959 crore
Total Assets₹505 crore
Debt-to-Equity Ratio0.39
P/E Ratio178
ROE37.2%
EPS₹20.7
https://feelthecandlesticks.com/bondada-engineering-stock-split-date-announced/

Also Read – MIC Electronics Limited Bags Order Worth Rs. 2.54 Crore

Implications for Shareholders

The subdivision will see existing shareholders receive five times the number of shares they had before, while their total stake in the company, and thus its value subject to market fluctuations, remains unchanged.

For example, if a shareholder has 100 shares of ₹10 face value, after the split, they will have 500 shares with a face value of ₹2 each. This move is expected to attract more investors to the stock by lowering its share price, fueling greater trading volume, and sharper pricing in the market.

Shareholding Pattern

Shareholder CategoryHolding (%)
Promoters63.33%
Foreign Institutional Investors (FII)0
Domestic Institutional Investors (DII)0
Public36.08%

Conclusion

Bondada Engineering Limited announces the record date for the subdivision of its equity shares. This move makes the company’s shares more accessible to a broader range of investors, increasing market participation. The share split is anticipated to help Bondada Engineering’s market and shareholder value grow, along with the rest of its activities, as it continues to expand to serve a larger customer base.

VISIT THE OFFICIAL WEBSITE TO LEARN MORE

GRP LTD Share Price Target 2025 to 2030 – Complete Overview

https://feelthecandlesticks.com/grp-ltd-share-price-target-2025-to-2030/

In this article, we will discuss the GRP Ltd. share price target from 2025 to 2030. GRP is a rubber manufacturing company that primarily produces its products from recycled tyres.

Company Overview

  • GRP Ltd was established in 1974.
  • GRP Ltd produces high-quality reclaim rubber from end-of-life tyres, tread peelings, natural rubber, and butyl tubes. Their rubber is used in both tyre and non-tyre products.
  • They also provide sustainable material solutions for engineering applications using Polyamide 6, Polyamide 66, and Polybutylene terephthalate. Additionally, GRP Ltd produces polymer composites made from 100% recycled rubber and plastic.
  • These eco-friendly products are stronger and more durable than wood. They are suitable for use in logistics, construction, oil and gas, aviation, marine, industrial, and agriculture sectors.
https://feelthecandlesticks.com/grp-ltd-share-price-target-2025-to-2030/

Important Financial Metrics of GRP LTD

Here is a table summarizing the key financial data for GRP Ltd. as of August 2024:

MetricValue
Market Capitalization₹2,205 crore
Revenue (FY 2023-2024)₹461.4 crore
Revenue Growth2% (YoY)
Profit After Tax (PAT)₹23 crore
PAT Growth62% (YoY)
EBITDA₹52.3 crore
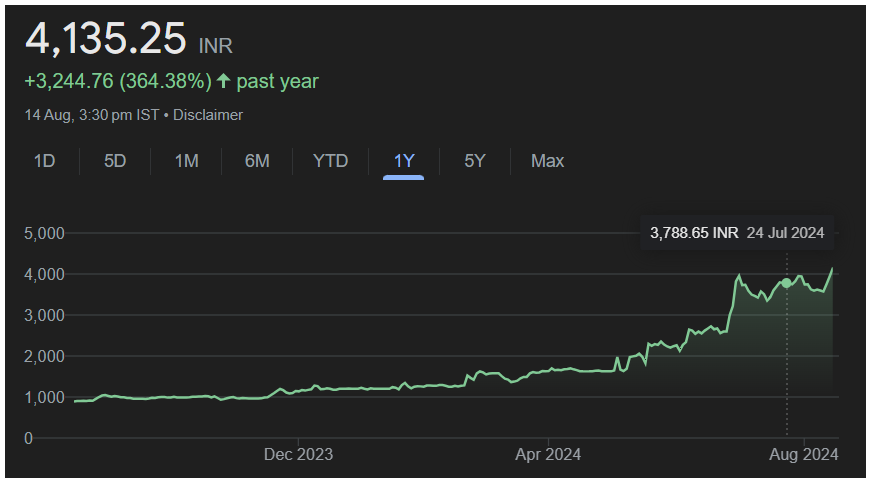
Share Price Growth (1 Year)364%
52-Week High₹4,186
52-Week Low₹865

ALSO READ – What is Dividend? – Complete Guide in Simple Words

GRP LTD Share Price Target 2025 to 2030

YEARPRICE TARGET
2025

2026

2027

2028

2029

2030
– Nobody can accurately predict the market years from now, not even a SEBI-registered financial advisor. The markets are uncertain.
– Don’t believe random price targets given on the internet.
– Respect your hard-earned money.
– We should have specific strategies for specific scenarios
.
– Please consult your SEBI-registered financial advisor for any financial decisions.

Predicting exact stock prices is challenging, but you can use a basic method to guess future prices.

For instance, if a stock is priced at ₹100 now and the company has grown by 18% each year, you might guess that the stock will increase at a similar rate if the company continues to perform well. This growth usually means the company’s revenue and profits are rising.

If the company maintains an 18% growth rate, the stock price might go up to about ₹118 (₹100 + 18% of ₹100).

On the other hand, if the stock has dropped by 10% due to poor performance, the price might fall to around ₹90 (₹100 – 10% of ₹100).

Remember, these are just rough guesses. The stock market is unpredictable, and predicting exact future prices is very difficult.

Focus on the company’s fundamentals when making investment decisions. Whether to stay invested or to exit should depend on the company’s financial performance. Stay informed by regularly analyzing the company’s performance.

GRP LTD Share Holding Pattern

This shareholding data is for the first quarter of FY25.

Promoter40%
FIIAlmost 0
DIIAlmost 0
Retail60%
https://feelthecandlesticks.com/grp-ltd-share-price-target-2025-to-2030/

Source – trendlyne.com

Recent Developments

GRP Ltd. continues to attract investor interest due to its consistent performance and strategic initiatives. In August 2024, the company’s board approved the implementation of the GRP Limited Employee Stock Option Plan 2024, reflecting its commitment to incentivizing its workforce.

In summary, GRP Ltd. is a well-established company in the rubber processing industry with a strong financial performance and a robust market position. The company’s focus on innovation and sustainability is likely to drive its growth in the coming years.

For more information, please visit the official site.

Ola Electric FY25-Q1 Results: Strong Revenue Growth Amidst Widening Losses

https://feelthecandlesticks.com/ola-electric-q1-fy25-results-strong-revenue-growth-amidst-widening-losses/

Ola Electric Mobility Ltd., one of the key players in the EV sector, recently announced its quarterly results for Q1 FY25. It has reported good revenue growth but has posted consolidated net losses, which have increased. Let’s deep-dive into the key financial highlights of operations, the product lines involved, and the future outlook of the company in question.

Revenue Growth Amidst Losses

Consolidated Net Loss:

  • Ola Electric reported a consolidated net loss of ₹347 crore in Q1 FY25.
  • This is an increase from the net loss of ₹267 crore in the corresponding period last year.

Revenue from Operations:

  • The company’s revenue from operations increased by 32% in Q1 FY25.
  • Revenue rose to ₹1,644 crore, up from ₹1,243 crore in the previous fiscal year.

The growth in revenue is primarily driven by the automotive segment.

Also Read –What do you mean by Net Profit? – Explained

Operational Performance

The revenue breakdown from electric vehicle sales and related services is ₹1,644 crore. The company’s EBITDA for the quarter was ₹205 crore, slightly lower compared to ₹218 crore posted in the same period last year. The EBITDA margin for the automotive division improved and came close to breakeven, with a margin of 1.97%.

Product Portfolio and Deliveries

Founded in 2017, Ola Electric has rapidly expanded its product offerings. There are now multiple options in the electric scooter segment, including the Ola S1 Pro, Ola S1 Air, and the S1 X series. In Q1 FY25, the company delivered 1,25,198 vehicles, compared to 70,575 units in the same period last year. The mass-market portfolio of the S1 X contributed to sustained growth, while existing products continued to experience strong demand.

Future Outlook

Ola Electric has significant plans in the pipeline. The company plans to integrate its in-house manufactured cells into its vehicles during Q1 FY26. Additionally, Ola Electric’s electric motorcycle portfolio is scheduled for launch on August 15 during its annual flagship event, targeting both mass and premium categories.

Challenges and Opportunities

Although impressive in terms of revenue growth, Ola Electric’s widening losses highlight the challenges it faces in managing operational costs. However, the company is likely to see positive results in the coming quarters from its strategy of leveraging scale to reduce manufacturing costs and optimize the supply chain. Its scalable platform-based product development and manufacturing technology is expected to continue benefiting the company in the long run.

Stock Performance

Ola Electric shares have performed well on the National Stock Exchange. The stock closed 2.6% higher at ₹111 apiece on the day of the earnings announcement. The company’s shares have jumped significantly since listing, with the stock surging 20% on its listing day.

Conclusion

Ola Electric’s Q1 FY25 results are a mixed bag. The company has grown its revenues and expanded its product portfolio but faces challenges in reducing net losses. It will be fascinating to see how the company navigates the competitive EV market in India as it progresses with its cell integration plans and new electric motorcycle launches. Investors and stakeholders will be watching closely as the company works towards profitability while maintaining its growth trajectory.

Visit the official website to learn more.

Rupee adds 7 paise against US dollar-Market awaits US CPI data

https://feelthecandlesticks.com/rupee-adds-7-paise-against-us-dollar-market-awaits-us-cpi-data/

On Wednesday, the Indian rupee firmed up against the dollar, gaining 7 paise to reach 83.90 in early trade. This rise occurred as the US dollar weakened in the forex market.

Why Did the Rupee Gain?

Forex traders noted that the US dollar weakened after the release of the US Producer Price Index (PPI) data. The PPI reflects the change in prices received for domestically produced goods and services. The index came in softer than expected, indicating that the US dollar index may continue its correction.

How Did the Rupee Perform?

In the inter-bank foreign exchange market, the rupee opened at 83.90 against the US dollar, 7 paise higher than its closing level of 83.97 on Tuesday. On Tuesday, the rupee had settled flat without any significant change.

What’s on the Radar?

Forex traders are closely watching the US CPI data, which is important for understanding the inflation situation in the US. Depending on this data, the strength of the dollar may either increase or decrease, impacting the rupee’s value.

Also Read – Inflation and CPI Explained – What’s the Effect on the Stock Market?

US CPI Data Impact on World’s Various Markets

That’s an important figure because it shows how much prices for goods and services used in everyday life in the United States have risen. When the CPI jumps a whole lot more than expected, it potentially means inflation is running up faster than people were thinking just one week ago. This can trigger worry that the Federal Reserve may begin hikes of interest rates to control inflation. If interest rates are raised by the Fed, then usually the US dollar will gain strength because the investors will seek to invest in US assets that offer better returns.

The potential of other currencies, such as the Indian Rupee, getting weaker due to a stronger US dollar, or easing the fears related to rising inflation with a lower-than-expected CPI, which can make the US dollar weaker. This may result in the rupee showing some strength. That is why CPI is closely watched by traders and investors around the world, as that number can get most of the markets moving, and currency markets are no different.

RBI’s Role in Rupee Stability

The Reserve Bank of India intervenes in many ways to stabilize the Indian rupee. One of the ways is through its intervention in the foreign exchange market. For example, if the rupee starts to weaken against the US dollar, coming close to the 84.00 level, the RBI may sell portions of its US dollars and buy rupees, pushing the value of the rupee back up. This increases the demand for rupees, which helps stop the rupee from falling so much.

Its primary goal is to make sure that the rupee doesn’t lose too much value, which could lead to higher prices for goods and services in India. Stability in the rupee also helps build confidence in the Indian economy. A stable currency is important for businesses, investors, and consumers as it allows for better planning in the future.

Other Market Movements

Meanwhile, the dollar index added 0.10% to 102.66, while Brent crude, the global benchmark for oil prices, rose 0.57% to $81.15 per barrel.

Domestically, the stock markets were largely unaffected. The Sensex lost 24.66 points, or 0.03%, to settle at 78,931.37 points. The Nifty fell 11.10 points, or 0.05%, to 24,127.90 points.

Investor Activity

Foreign Institutional Investors (FIIs) were net sellers in the capital markets on Tuesday, offloading shares worth Rs 2,107.17 crore, according to data from the exchanges.

Conclusion

Analysts noted that the rupee’s gain against the dollar is a positive sign for the Indian economy. However, the market remains cautious as it awaits key data from both India and the US in the coming days. The outcome of this data will play a crucial role in determining the rupee’s future movement.

GMR Airports’ Stock Falls 3.3% After Reporting Q1 Net Loss

https://feelthecandlesticks.com/gmr-airports-infrastructure-ltd-results/

GMR Airports Infrastructure Ltd recently announced its financial results for the first quarter of FY25. It posted a net loss of Rs 258.2 crore for the period. Though the revenue was upbeat, the loss pulled its stock price down by 3.3%. The stock closed at Rs 94.80 on the BSE.

About the Company

GMR Airports Infrastructure Ltd. is one of the major airport developers and operators in the country. Delhi, Hyderabad, and the new Manohar International Airport in Goa are some of the major airports managed by the company. GMR Airports has proved its mettle in efficient airport infrastructure development, making air travel easy and comfortable for passengers. Hence, it has emerged as one of the major players in Indian aviation.

Financial Highlights

In the first quarter of FY25, GMR Airports reported:

  • A net loss of Rs 258.2 crore, compared to Rs 122.50 crore in the same quarter last year.
  • Revenue from operations increased to Rs 2,402.20 crore, up by 19.06% from Rs 2,017.63 crore in Q1 FY24.
  • EBITDA was Rs 1,016.35 crore, higher than Rs 860.82 crore in the same period last year.
  • The EBITDA margin was 42.3%, slightly lower than 42.6% last year.

Despite earning more revenue, the company faced challenges in managing costs, leading to a higher net loss.

Key Financial Metrices

Market Cap₹ 98,093 Cr
Industry PE37.7
ROCE6.39 %
Book Value₹ -3.59
Industry PBV4.45

Shareholding Pattern

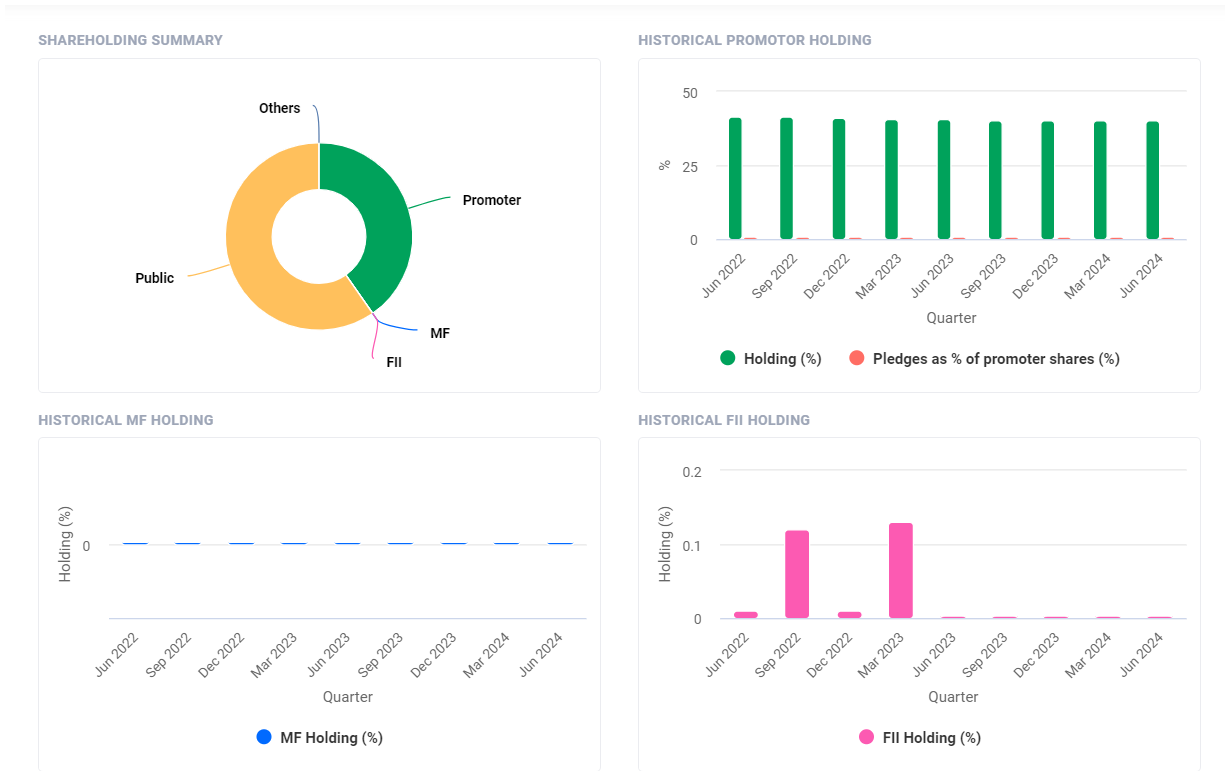
GMR Airports has a mix of shareholders. This includes the company’s promoters, institutional investors, and retail investors.

Promoters66.07%
FII14.76%
DII3.38%
Retail15.79%

Company Vision and Plans

GMR Airports is focused on the expansion and upgradation of airports. This includes augmenting the international passenger capacity at Delhi Airport by 40-50% over the next 6-12 months. It has also invested in new technologies and better passenger facilities that will enable it to increase its capacity and help cater to the burgeoning demand for air travel in India. This commitment shows its aim to be an even greater player in the airport sector.

Also Read – What do you mean by Net Profit? – Explained

Conclusion

The Q1 of FY25 remained a mixed bag for GMR Airports. While it witnessed an uptick in revenue, the higher net loss affected investor confidence and pulled down its stock price. GMR Airports will focus on expansion and improvement in airport facilities in the coming times to rise above these challenges and regain investors’ confidence.

Visit the official site to learn more

What do you mean by Net Profit? – Explained

https://feelthecandlesticks.com/what-is-net-profit/

Net profit is an important term in business, but it can sound a bit confusing at first. Knowing what net profit is and how to calculate it can give us a clearer picture of a business’s financial health. In this article, we will understand the whole concept in a very simple way.

Let us first understand what profit means.

Profit is simply the extra money you earn after deducting your expenses.

How do you find profit?

Profit is calculated by subtracting total expenses from total revenue. The formula is:
Profit = Revenue – Expenses
If the result is positive, it’s a profit. If it’s negative, it’s a loss. This helps you understand if a business is earning or losing money.

What is Net Profit?

Net profit is the amount of money that remains after all the expenses and taxes. It is also known as net income. It’s the final profit figure that shows how much money a business actually makes after covering all its costs. Net profit is often called the bottom line because it’s the final number on an income statement.

How to Calculate Net Profit?

Let us understand it through two easy examples.

Example 1:

Imagine you run a small bookstore. You sell 100 books at ₹200 each. Your total revenue would be ₹20,000.

  • Cost of Goods Sold (COGS): These are the direct costs of the products you’re selling. For your bookstore, this would include the cost of purchasing the books.

Example: If you spend ₹10,000 on purchasing the books, your COGS is ₹10,000.

  • Gross Profit: This is what you get when you subtract COGS from total revenue.

Calculation: Total Revenue (₹20,000) – COGS (₹10,000) = Gross Profit (₹10,000).

  • Operating Expenses: These are the costs of running your bookstore that aren’t directly related to buying the books. This includes things like rent for your bookstore, electricity bills, and salaries if you pay any staff.

Example: If you spend ₹3,000 on rent and ₹2,000 on electricity, your total operating expenses are ₹5,000.

  • Operating Profit: This is what you get when you subtract operating expenses from gross profit.

Calculation: Gross Profit (₹10,000) – Operating Expenses (₹5,000) = Operating Profit (₹5,000).

  • Other Income and Expenses: These might include additional earnings from other sources like interest on loans 9if you have given any).

Example: If you earned ₹1,000 from a small investment and paid ₹500 in interest on a loan, your net other income is ₹500 (₹1,000 – ₹500).

  • Net Profit: This is the final profit after all expenses have been deducted from all income.

Calculation: Operating Profit (₹5,000) + Net Other Income (₹500) = Net Profit (₹5,500).


Example 2:

Suppose you have a small bakery.

Total Revenue: You make ₹5,00,000 in a month from selling cakes and cookies.

Cost of Goods Sold (COGS): You spend ₹2,00,000 on ingredients like flour, sugar, and butter.

Gross Profit: ₹5,00,000 (Total Revenue) – ₹2,00,000 (COGS) = ₹3,00,000.

Operating Expenses: You spend ₹1,20,000 on rent, utilities, and wages.

Operating Profit: ₹3,00,000 (Gross Profit) – ₹1,20,000 (Operating Expenses) = ₹1,80,000.

Other Income/Expenses: You earn ₹10,000 from a catering event and pay ₹5,000 in interest on a loan.

Net Profit: ₹1,80,000 (Operating Profit) + ₹5,000 (Net Other Income) = ₹1,85,000.

So, your bakery’s net profit for the month is ₹1,85,000. This means after covering all costs, your bakery actually made ₹1,85,000.

Why is Net Profit Important?

  • True Profitability: Net profit shows the true profitability of a business. It’s the actual profit after all costs are considered.
  • Business Health: A positive net profit means the business is making money, which is a good sign of health and sustainability.
  • Investor Attraction: Investors look at net profit to determine if a business is a good investment. A higher net profit means more potential for returns on their investment. Knowing the net profit helps investors make informed decisions.

What is the difference between Net Profit and Revenue?

  1. Revenue is the total amount of money a business earns from selling its products or services before any expenses are taken out. It’s often referred to as the top line because it appears at the top of the income statement.
  2. Net profit, on the other hand, is the amount of money that remains after all expenses have been deducted from the revenue. This includes costs like materials, salaries, rent, and utilities. Net profit is often called the bottom line because it’s what’s left over at the bottom of the income statement after all costs are considered.

What is the difference between Gross Profit and Net Profit?

  • Gross profit is the amount of money left after subtracting the cost of goods sold (COGS) from total revenue. COGS includes direct costs like materials and labor used to produce the products or services sold.
  • Net profit is the amount of money left after subtracting all expenses (COGS, operating expenses, taxes, etc.) from total revenue.

While gross profit gives a snapshot of the efficiency in production, net profit provides a comprehensive picture of overall profitability after all costs.

Is Net Profit added to Capital on a balance sheet?

Yes, net profit is added to the equity section of the balance sheet. When a company earns a net profit, this amount is added to the retained earnings, which is part of the owner’s equity. Retained earnings represent the accumulated net profit of a company that has been reinvested in the business rather than distributed to shareholders as dividends. This increase in retained earnings boosts the overall equity of the company.

Conclusion

Net profit is an important measure of a business’s financial performance. It tells you how much money the company is actually making after paying for everything. Understanding net profit helps investors make smart decisions.

Is net profit always equal to gross profit?

No, net profit is not always equal to gross profit.

Are net income and net profit the same?

Yes, net income and net profit are the same. Both terms refer to the amount of money that remains after all expenses have been deducted from total revenue.

What is a Dividend? – A Complete Guide in Simple Words

https://feelthecandlesticks.com/what-is-dividend/

In this article, we will learn the complete concept of dividends. We often hear about the dividend payouts by companies listed on the stock exchange. Along with these, terms like Ex-dividend and Record Date can sometimes cause confusion. So, let us begin the learning.

What is Dividend?

A dividend is a portion of a company’s earnings that is paid to its shareholders. When a company makes a profit, it sometimes decides to share some of that money with the people who own its shares. This shared money is called a dividend.

Why is it called Dividend?

The word “dividend” comes from the idea of dividing something. In this case, the company is dividing its profits among its shareholders. So, it’s called a dividend because the company divides its earnings to give a part to each shareholder.

Is Dividend Good or Bad?

A dividend is generally considered good because it means the company is making enough profit to share with its shareholders. However, not all companies pay dividends. Some might choose to reinvest their profits back into the business to grow even more. Whether a dividend is good or bad depends on the goals of the investor. Some investors like receiving regular dividends, while others might prefer the company to reinvest in growth.

ALSO READ – What is the Stock Market? – Complete Basics in One Article

Are Dividends Paid Monthly?

Dividends are usually not paid monthly. Most companies pay dividends quarterly, which means every three months. Some companies pay them once a year or twice a year. It’s rare for a company to pay dividends every month.

What is Ex-Dividend Date?

The ex-dividend date is the date on or after which you will not be entitled to the company’s dividend if you purchase the share.

If you buy a stock on or after the ex-dividend date, you won’t receive the upcoming dividend. Instead, the dividend will be paid to the person who owned the stock before this date.

So make sure you buy your stocks before the ex-date to be eligible for the dividend.

What is Record Date?

The record date is typically considered the cutoff date for determining which shareholders are eligible for a particular corporate event.

In case of dividends, the record date is the date set by the company to determine who is eligible to receive the dividend. If you own the stock on this date, you will receive the dividend. The record date usually comes a few days after the ex-dividend date.

Note: The ex-dividend date is generally two days before the record date.

Why is the Ex-Dividend date and Record Date Important?

The settlement period is T+2 days, meaning if you buy a share today, you will gain ownership almost 2 days later.

And there is a 2 days difference between ex-date and record date.

If you buy stocks but your name isn’t registered with the company by the record date, you won’t get the dividend that the company gives to its shareholders. The ex-date is usually two days before the record date, so make sure you buy your stocks before the ex-date to be eligible for the dividend.

The Bottom Line

If you want to invest in the stock market for regular income in the form of dividends, it’s important to understand the full concept of dividends and the important dates. This knowledge will help you make more informed decisions.

Reference Site

Will I get the dividend if I buy the stock on the record date?

No, you will not receive the dividend. To be eligible for the dividend, you must buy the stock before the ex-dividend date.

Ola hits Upper Circuit on Just the Second Day of Listing – Price jumps 20% with High Hopes

Ola hits upper circuit on just second day of listing

Ola Electric’s stock has been performing exceptionally well since its market debut. After a flat start, the shares quickly rallied, closing at INR 91.18 on their first trading day. On August 12, 2024, the shares hit a new high of INR 109.41, representing a 20% increase from the previous close. The company’s market valuation now stands at approximately INR 48,258.89 crore.

Ola hits upper circuit on just second day of listing

Ola Electric went public with a valuation of $4 billion, which was a 25% reduction from its previous valuation of $5.4 billion during its last funding round in September 2023. Initially, the company had aimed for a valuation of around $10 billion for its IPO, but this was later adjusted following investor feedback.

Despite the company’s strong revenue growth, with operating revenue jumping over 90% to INR 5,009.8 crore in FY24, it reported a net loss of INR 1,584.4 crore for the same period, a 7.6% increase from the previous year.

Company Overview

Ola Electric Mobility Limited, led by Bhavish Aggarwal, is an electric two-wheeler manufacturer. The company recently made a successful debut in the stock market, with its shares experiencing a strong upward momentum. On Monday, August 12, 2024, Ola Electric’s shares jumped by 20%, hitting the upper circuit limit and reaching a new high of INR 109.41 on the Bombay Stock Exchange (BSE). This surge followed its listing at INR 75.99 per share, which was slightly below its IPO issue price of INR 76.

Also Read – What is an IPO in Simple Words? – 6 Important Steps to Know

Fundamental Overview

Ola Electric’s initial public offering (IPO) was highly anticipated, as it was the first by an electric vehicle (EV) manufacturer in India. The IPO, which opened for bidding from August 2 to August 6, 2024, was oversubscribed 4.27 times. The total value of the IPO was INR 6,145 crore, with a fresh issue of shares worth INR 5,500 crore and an Offer-for-Sale (OFS) of 8.49 crore equity shares.

The company has earmarked the funds from the IPO for several key initiatives:

  • Capacity Expansion: Ola Electric plans to use INR 1,227.6 crore to expand its cell manufacturing plant’s capacity from 5 GWh to 6.4 GWh.
  • Research and Development: INR 1,600 crore will be invested in research and product development to strengthen the company’s offerings.
  • Debt Repayment: The company intends to use INR 800 crore to repay existing debts.
  • Organic Growth: INR 350 crore will be allocated for organic growth initiatives.

Official Commentary

Ola Electric’s Red Herring Prospectus (RHP) detailed plans for the development and expansion of its Ola Gigafactory in Krishnagiri, Tamil Nadu. The first phase of this project will be funded through internal accruals and long-term borrowings secured by its subsidiary, Ola Cell Technologies Pvt Ltd. The company is focused on enhancing its manufacturing capabilities to meet the growing demand for electric vehicles and related components.

Founder Bhavish Aggarwal commented on the company’s IPO pricing strategy, stating that it was deliberately priced to attract a broad range of investors. This approach was intended to allow more people to participate in Ola Electric’s growth story, which the company believes has significant potential for future expansion.

Conclusion

Ola Electric’s successful IPO and subsequent stock market performance highlight the growing interest in electric vehicles in India. With plans to expand its manufacturing capacity and invest in research and development, the company is well-positioned to capitalize on the increasing demand for EVs. Investors will need to monitor the company’s financial progress closely as it works through the challenges of expanding its operations.

Visit the official website to learn more.