Indian Railway Finance Corporation Share Price Target 2025 to 2030 – Complete Overview

https://feelthecandlesticks.com/indian-railway-finance-corporation-share-price-target-2025-to-2030/

In this article, we will talk about Indian Railway Finance Corporation, also known as IRFC. We will discuss the company profile and business overview, and we will also cover the share price target for Indian Railway Finance Corporation from 2025 to 2030. So, let’s get started.

Company Overview

Indian Railway Finance Corporation (IRFC) was established on 12th December 1986 as the dedicated financing arm of Indian Railways. Its primary role is to mobilize funds from both domestic and international capital markets to support the financial needs of the Indian Railways. IRFC operates as a Schedule ‘A’ Public Sector Enterprise under the administrative control of the Ministry of Railways, Government of India. Additionally, it is registered with the Reserve Bank of India (RBI) as a Systemically Important Non-Deposit taking Non-Banking Financial Company (NBFC-ND-SI) and as an Infrastructure Finance Company (NBFC-IFC).

Business Overview

The core objective of IRFC is to meet the majority of the ‘Extra Budgetary Resources’ (EBR) requirements for Indian Railways through market borrowings. The company’s principal business involves raising funds from financial markets and using these funds to finance the acquisition or creation of assets, which are then leased out to Indian Railways.

Additionally, IRFC extends its financial services to various entities within the railway sector, including Rail Vikas Nigam Limited (RVNL), Railtel, Konkan Railway Corporation Limited (KRCL), and Pipavav Railway Corporation Limited (PRCL).

Recent Financial Performance

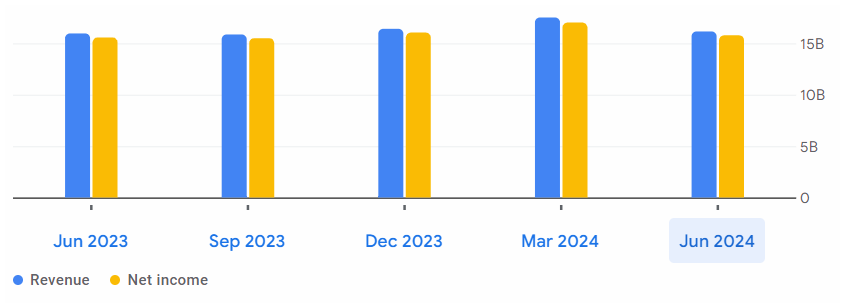
MetricQuarter Ended June 2024Quarter Ended June 2023% Change
Sales (₹ Crore)676666791.30%
Net Profit (₹ Crore)157715571.28%
https://feelthecandlesticks.com/indian-railway-finance-corporation-share-price-target-2025-to-2030/

Also Read – What do you mean by Net Profit? – Explained

Important Financial Metrics

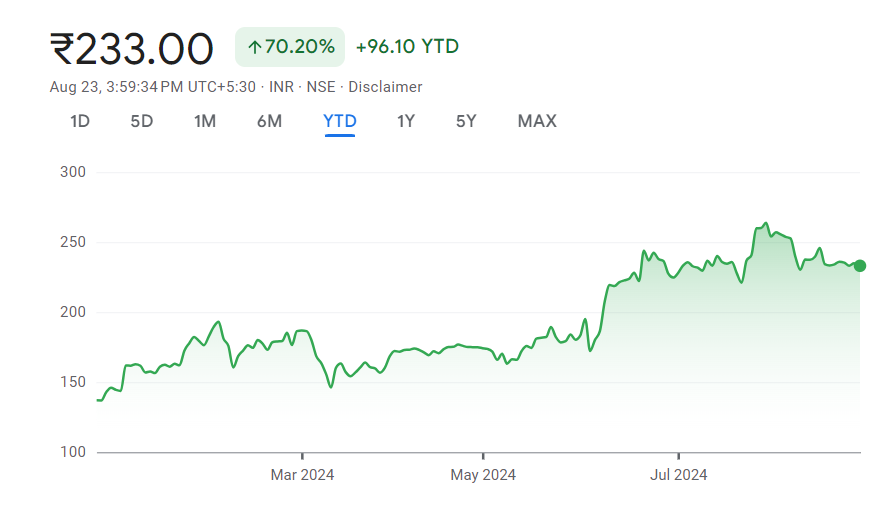
The IRFC stock is trading at 4.81 times its book value, which is considered quite expensive.

Stock Performance
https://feelthecandlesticks.com/indian-railway-finance-corporation-share-price-target-2025-to-2030/
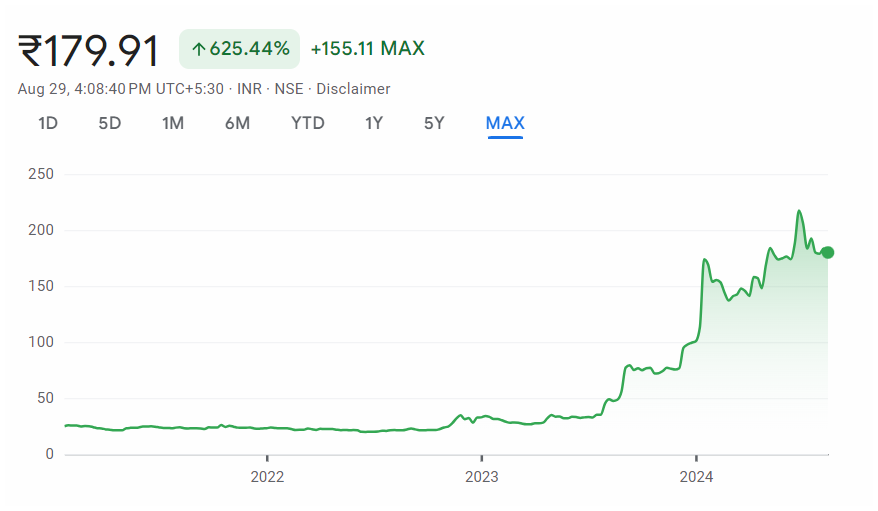
Time PeriodReturns
All time687.53%
Past 2 Years742.86%
Past 1 Year263.61%
Past 3 month-0.17%

Indian Railway Finance Corporation Share Price Target 2025 to 2030

Predicting exact stock prices is challenging, but you can use a simple approach to estimate future trends.

For instance, if a stock is currently priced at ₹100 and the company has shown an annual growth of 18%, you might anticipate the stock to grow at a similar rate if the company continues to perform well. This growth is reflected in the company’s revenue and profits. In this case, the stock could potentially rise to ₹118 (₹100 + 18% of ₹100).

Conversely, if the stock has been declining by 10% due to poor financial results, the price might decrease to around ₹90 (₹100 – 10% of ₹100).

It’s important to remember that these are rough estimates, as markets are inherently unpredictable, and precise price predictions are nearly impossible.

Instead, focus on the fundamentals of the business. Your decision to stay invested or to exit should be based on the company’s financial performance. Regular analysis and staying informed are key to making sound investment decisions.

Don’t know how to analyze a company? Join our YouTube channel to learn fundamental analysis for free – Feel The Candlesticks

Shareholding Pattern

Shareholder CategoryHolding (%)
Promoters86.36%
Foreign Institutional Investors (FII)1.11%
Domestic Institutional Investors (DII)1.08%
Public11.45%

Conclusion

Indian Railway Finance Corporation (IRFC) plays an important role in financing the growth and development of Indian Railways. With its strategic approach to market borrowings and asset financing, IRFC has significantly contributed to the expansion of India’s railway infrastructure.

Market Orders, Limit Orders, and Stop Orders – All Types of Orders Explained in Simple Words

In this article, we’ll explore an important topic in stock trading: the different types of orders you can place in the stock market. The order pages of various brokers often present many options, which can be confusing. This article will help you understand limit orders, market orders and stop orders, so you can make more informed decisions when buying or selling stocks or any type of financial instrument in the financial markets. So, Let’s get started!

A Simple Analogy to Understand Market Order, Limit Order, & Stop Order

Let’s say you are out to buy some apples. There could be three possible scenarios:

  1. You want to buy apples only if the price is 100 rs per kg or less – This is like a limit order. You have a fixed price in mind and will only buy if the apples cost 100 rs or less. If the price goes higher, you won’t buy.
  2. You are willing to buy apples at any price – This is like a market order. You don’t care about the price; you just want to buy apples immediately, no matter what they cost.
  3. You want to buy apples only if the price goes above 100 rs per kg – This works like a buy stop order. You believe that if the price exceeds 100 rs, it shows strong demand, and you think it might go even higher, so you want to buy once the price reaches 100 rs or more.

Now, suppose you are a seller. You have to sell apples, and again, there are three possible scenarios:

  1. You want to sell your apples only if the price reaches 120 rs per kg – This is a limit order. You have set a specific price and will only sell your apples when the price hits 120 rs or more.
  2. You are willing to sell apples at any price – This is a market order. You don’t care about the current price; you just want to sell immediately at whatever price the market offers.
  3. You want to sell your apples only if the price drops below 110 rs per kg – This is a stop-loss order. You’re waiting for the price to fall below 110 rs to sell because you think the price might keep dropping, and you want to sell before it goes even lower.

A buyer typically aims to buy at the lowest possible price to maximize their value and minimize the cost of acquiring an asset. A seller typically wants to sell at the highest possible price to maximize their profit from the transaction.

What is a limit order?

  • A limit order allows you to set a specific price at which you want to buy or sell a stock.
  • If you’re buying, you set a maximum price you’re willing to pay.
  • If you’re selling, you set a minimum price you’re willing to accept.

Analogy:

  • If you want to buy apples only if the price is 100 rs per kg or less, that’s a buy limit order. You won’t buy the apples if the price goes above 100 rs.
  • If you want to sell apples only if the price is 120 rs per kg or more, that’s a sell limit order. You won’t sell unless the price reaches at least 120 rs.

Pros:

  • You have control over the price at which you buy or sell.

Cons:

  • There’s a chance that your order may not execute if the stock price doesn’t hit your limit.

What is a market order?

  • A market order is executed immediately at the current market price, regardless of what that price is. You prioritize speed over price.

Analogy:

  • If you want to buy apples at any price as long as you can get them right now, that’s a market order. You don’t care whether the price is 90 rs or 110 rs, you just want to buy right away.
  • If you want to sell apples immediately at whatever price the market offers, that’s a sell market order. You’ll take the best available offer, even if it’s not what you ideally wanted.

Pros:

  • It executes quickly, ensuring you get in or out of a trade without delay.

Cons:

  • The final price may be different from what you expected, especially in a fast-moving market. Your order could be executed at 110 Rs too.

What is a stop order?

  • A stop order (or stop-loss order) turns into a market order once a specified “stop” price is hit. There are two types: buy stop order and sell stop order.

Buy Stop Order:

  • A buy stop order is placed above the current market price. You use it when you want to buy a stock only after its price rises to a certain level, believing it will keep going up.

Analogy:

  • If apples are currently priced at 90 rs per kg, and you believe the price will keep rising if it crosses 100 rs, you might place a buy stop order at 100 rs. This means you will only buy the apples if the price hits or exceeds 100 rs.

Sell Stop Order:

This type of order can be used in two situation. One, if you are short selling a stock , second, If you want to protect your long positiom from losses happening because of a declining price which is called a stop loss order.

  • A sell stop order is placed below the current market price. It’s used to prevent further losses if the price drops too much. Once the price hits the stop level, it triggers a market order to sell the stock.

Analogy:

  • If you own apples and want to sell them if the price drops below 110 rs per kg, you place a sell stop order at 110 rs. When the price hits 110 rs or lower, it triggers a sale to avoid further loss in case the price continues to fall.

Stop-Loss Limit Order

What It Is:
This is a combination of a stop-loss order and a limit order. It sells the stock when it hits a stop price but only at a limit price you specify.

How It Works:

  • Stop Price: The price at which the order becomes active.
  • Limit Price: The minimum price you’re willing to accept once the order is active.

Pros:

  • Gives you more control over the price at which you sell.

Cons:

  • If the stock price falls rapidly below your limit price, the order might not be executed.

Also Read – What is Dividend? – Complete Guide in Simple Words

Cover Order

What It Is:
A cover order is a disciplined type of order that includes both a buy price and a stop-loss price. It’s designed to help traders manage their risk.

How It Works:

  • You set a buy price and a stop-loss price at the same time.
  • If the stock price falls to your stop-loss price, the order will be executed to limit your losses.

Pros:

  • Helps manage risk with predefined stop-loss levels.

Cons:

  • More suitable for short-term traders rather than long-term investors.

One Cancels the Other (OCO) Order

What It Is:
An OCO order allows you to set both a target price and a stop-loss price. If one order is executed, the other is automatically canceled.

How It Works:

  • Target Price: The price at which you want to sell for profit.
  • Stop-Loss Price: The price at which you want to sell to limit losses.
  • If the stock hits the target price, the stop-loss order is canceled. If it hits the stop-loss price, the target price order is canceled.

Pros:

  • Automatically manages both profit-taking and risk control.

Cons:

  • Requires careful planning to set both target and stop-loss prices effectively.

After-Market Order (AMO)

What It Is:
An after-market order lets you place trades outside regular trading hours, usually after 3:30 PM, for execution in the next trading session.

How It Works:

  • Allows you to set trades for after the market closes.

Pros:

  • Provides flexibility to trade beyond regular hours.

Cons:

  • Less liquidity can mean wider spreads and potentially less favorable execution.

Conclusion

Understanding these different types of orders can make a big difference in how you trade in the stock market. Whether you want to execute trades quickly with a market order, control your price with a limit order, or manage risks with stop-loss orders, knowing your options will help you trade more effectively. If you have any questions or need more details, just let me know! Happy trading!

Why Do Some Companies Have Zero Promoter Holding in India?

https://feelthecandlesticks.com/some-companies-have-zero-promoter-holding/

Promoter holding plays an essential role in shaping the sentiments of investors. Typically, promoters are seen as the backbone of a company, as they are often the founders or major stakeholders. However, some companies, like ITC, HDFC, Paytm, L&T, Ujjivan Bank, and ICICI Bank, have zero promoter holding. But why is this the case? Why do some companies operate without promoters? In this article, we’ll explore the entire concept of promoters and promoter holding in a company. Let’s get started!

What are promoters?

Promoters are individuals or entities who play a major role in creating and developing a company. They are the ones who bring together resources, arrange funding, and guide the company in its early stages. Promoters often hold a significant number of shares in the company and help make strategic decisions.

Why Do Some Companies Have Zero Promoter Holding in India?

Is a Promoter the Owner?

While a promoter can own a large portion of the company, they are not always the sole owner. Ownership is shared among all shareholders. However, promoters usually have more influence on the company’s decisions compared to regular shareholders.

What Is the Legal Status of a Promoter?

Promoters have a special legal status. They are responsible for setting up the company and are involved in drafting important documents like the company’s memorandum and articles of association. Although they may not always own the company, they play a key role in its foundation and early growth.

What does it mean when promoter holding is zero?

There could be many companies where promoter holding is zero. It simply means no single person or entity has a significant ownership stake. These companies are often referred to as “professionally managed companies.” In these companies, decision-making is done by a Board of Directors and professional managers instead of a single promoter or group of promoters.

What happens when promoter holding is zero? 

When a company has zero promoter holding, it means the company is managed by professionals and not controlled by a single entity. This can have both positive and negative effects:

Advantages

  • Balanced Decisions: Since no single promoter controls the company, decisions are often more balanced and consider the interests of all stakeholders.
  • Professional Management: The company is managed by experienced professionals who focus on the company’s long-term growth and stability.

Disadvantages

  • Ownership Dilution: To retain talented employees, the company might offer Employee Stock Option Plans (ESOPs), which can dilute ownership.
  • Lack of Promoter Interest: If a company had promoters who reduced their stake or left, it might be seen as a lack of interest or confidence in the company. This could worry some investors.

Also Read – Inflation and CPI Explained – What’s the Effect on the Stock Market?

What is the difference between a promoter and a shareholder?

A promoter is a specific type of shareholder who is involved in setting up the company. However, not every shareholder is a promoter. Shareholders can simply be people who buy shares of the company without being involved in its creation or operations.

What is the 75% shareholding rule?

Promoters would have to release minimum 25% ownership to the public if it is a public company and listed in a stock exchange.

What if promoter holding is more than 75%?

If a promoter holds more than 75% of the company’s shares, they are required to sell the extra shares to bring their holding down to 75% or less. This rule applies to public companies listed on a stock exchange. It ensures that at least 25% of the company’s shares are available to the public.

Conclusion

A company with zero promoter holdings can still be a good investment if it shows strong fundamentals, has good management, and follows sound governance practices. Always do thorough research and consider multiple factors before making investment decisions. While promoter holding is important, it is just one of the many factors to look at when evaluating a company.

Can a promoter leave a company?

Yes, a promoter can leave a company by selling their ownership stake to others. This could happen gradually or all at once, depending on the situation.

Can a company have only one promoter?

Yes, a company can have only one promoter. This promoter would be responsible for starting and growing the company.

How to Apply for the Nucleus Software Buyback 2024 -A Complete Guide

https://feelthecandlesticks.com/how-to-apply-for-the-nucleus-software-buyback/

Nucleus Software Exports Limited offers software solutions for the banking and financial services sector. The company recently announced a share buyback plan worth ₹72.35 crore. It has set September 3, 2024, as the record date for this buyback. This buyback represents 1.67% of the company’s total paid-up equity capital and aims to improve financial ratios and enhance shareholder value. In this article, we will discuss the complete details of the buyback and how to apply for it.

Company Overview

Nucleus Software specializes in providing IT and consultancy services to the banking and financial services sector. The company’s products support operations for more than 200 financial institutions across 50 countries. Their software solutions cover areas like retail lending, corporate banking, cash management, mobile and internet banking, and automotive finance.

Business Overview

The company’s services include Professional Services, Application Services, and Managed Infrastructure Services. Nucleus Software also provides application development and maintenance, along with managed infrastructure solutions. The key products of the company, FinnOne Neo and FinnAxia, are widely used in the financial sector, enhancing the company’s global reach and influence.

Buyback Details

The buyback plan is a strategic move by Nucleus Software to enhance shareholder value by distributing surplus cash. The buyback will also help improve financial ratios like earnings per share (EPS) and return on equity (ROE) by reducing the equity base. Here are the details of the buyback:

Buyback Size₹72.35 crore
Number of Shares4,48,018
Buyback Price₹1,615 per share
Percentage of Total Equity1.67%
Record DateSeptember 3, 2024
Buyback MethodTender offer route

Read the official notification here – OFFICIAL NOTIFICATION

How to Apply for the Nucleus Software Buyback?

Eligible shareholders can participate in the buyback by submitting their shares through the tender offer route.

  • The company has reserved up to 15% of the buyback size for small shareholders, which means that smaller investors have a good chance of benefiting from this buyback.

Shareholders can apply through their brokers or directly through online trading platforms that support tender offers.

Recent Financial Performance of the Stock

The company’s financial performance has seen a decline in recent quarters.

PeriodRevenue (₹ crore)Net Profit (₹ crore)EBITDA Margin (%)
Q1 FY25195.430.214.8
Q4 FY2421053.627.7

Also Read – What is an IPO in Simple Words? – 6 Important Steps to Know

Key Financial Metrics

Its Price to Earnings (P/E) ratio is 22.84, which means investors are willing to pay 22.84 times the company’s earnings per share. This is lower than the industry’s average P/E of 39.2, suggesting that the company might be undervalued compared to its peers. The Price to Book Value (P/BV) of 4.95 is higher than the industry’s 3.93, indicating that the stock is priced higher relative to its book value. The company shows strong profitability with a Return on Equity (ROE) of 21.66%, a Return on Capital Employed (ROCE) of 32.0%, and a Return on Assets (ROA) of 16.8%. Lastly, the company’s Debt to Equity ratio is very low at 0.01, showing that it has minimal debt compared to its equity.

Stock Performance

https://feelthecandlesticks.com/how-to-apply-for-the-nucleus-software-buyback/
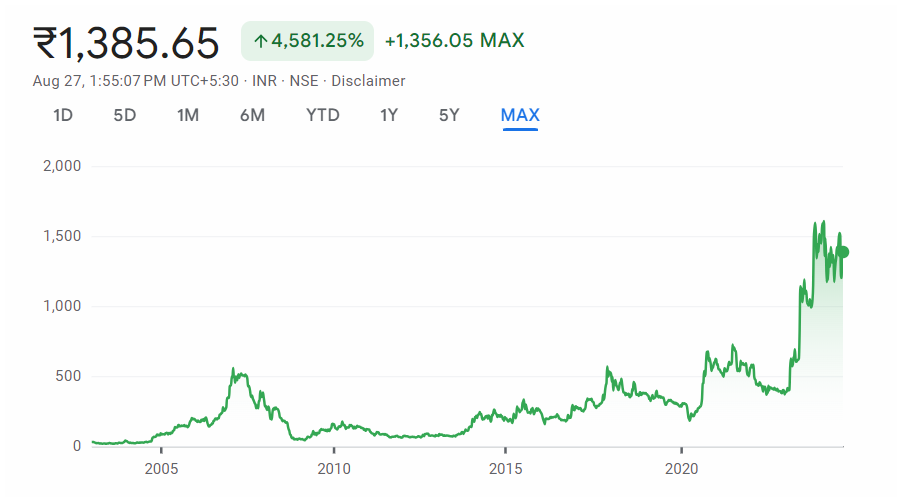
Time PeriodReturns
All time4,592.57%
Past 5 Years328.36%
Past 1 Year38.77%
Past 3 months10.93%

Shareholding Pattern

Shareholder CategoryHolding (%)
Promoters73.27%
Foreign Institutional Investors (FII)5.35%
Domestic Institutional Investors (DII)2.10%
Public25.06%

Conclusion

The Nucleus Software buyback presents an opportunity for shareholders to either cash out at a premium price or benefit from an increased shareholding percentage post-buyback. With a strategic focus on enhancing shareholder value, this buyback is a key step for the company in optimizing its capital structure.

for more information, visit the official site

MIC Electronics Limited Bags Order Worth Rs. 2.54 Crore

https://feelthecandlesticks.com/mic-electronics-limited-bags-order-worth-2-cr/

MIC Electronics Limited has recently announced a significant achievement. The company has secured a substantial order worth Rs. 2,54,73,441.45 from the Northern Railway Zone’s Lucknow Division. This order is for the provision of an Integrated Passenger Information System at several key stations in preparation for the Mahakumbh-2025.

Company Overview

MIC Electronics Limited is a prominent Indian company based in Hyderabad, specializing in the electronics and technology sector. Established with a vision to lead in electronic solutions, MIC Electronics focuses on designing, developing, and manufacturing advanced electronic products.

Join Our Telegram Group for Faster Updates

Business Overview

MIC Electronics Limited operates across several domains within the electronics industry. The company’s core business areas include the development of LED displays, which are utilized for public information systems, advertising, and entertainment purposes. Additionally, MIC Electronics provides Integrated Passenger Information Systems (IPIS), particularly for railway stations, to enhance passenger communication and operational efficiency.

https://feelthecandlesticks.com/mic-electronics-limited-bags-order-worth-2-cr/

Details of the Order

The order involves installing the Integrated Passenger Information System at three important stations: PRG, PYGS, and PFM. This system will enhance passenger experience by providing real-time information, improving efficiency, and supporting smooth operations at these stations during the upcoming Mahakumbh event.

MIC Electronics Limited is expected to complete this project within 9 months from the date of receiving the Letter of Acceptance. This timeline ensures that the system will be operational well before the Mahakumbh-2025, which is a major event attracting a large number of pilgrims and visitors.

The new system will likely bring several benefits to the stations, including better passenger communication and improved management of station operations. This upgrade is crucial for handling the high volume of passengers expected during the Mahakumbh-2025, making travel more convenient and efficient.

Read the official notification here

Recent Financial Performance

MetricQuarter Ended June 2024Quarter Ended June 2023% Change
Sales (₹ Crore)10.717.0252.56%
Net Profit (₹ Crore)1.971.2458.87%

For the quarter ended June 2024, the company’s sales increased by 52.56%, rising from ₹7.02 crore in June 2023 to ₹10.71 crore. Similarly, net profit saw a significant boost of 58.87%, climbing from ₹1.24 crore in June 2023 to ₹1.97 crore in June 2024.

Key Financial Metrics

With a Price to Earnings (P/E) ratio of 33.8, it is trading below the industry average P/E of 78.8, suggesting it might be undervalued compared to its peers. However, the Price to Book Value (P/BV) ratio is 14.3, which is significantly higher than the industry average of 7.18, indicating that investors are willing to pay a premium for the company’s stock.

The company demonstrates strong profitability metrics, with a Return on Equity (ROE) of 60.3% and a Return on Assets (ROA) of 51.3%, reflecting efficient management and a robust ability to generate profits from its equity and assets.

Also Read – This famous FMCG company completes the acquisition of a majority stake in a specialty chemical company

Stock Performance

https://feelthecandlesticks.com/mic-electronics-limited-bags-order-worth-2-5-crore/
Time PeriodReturns
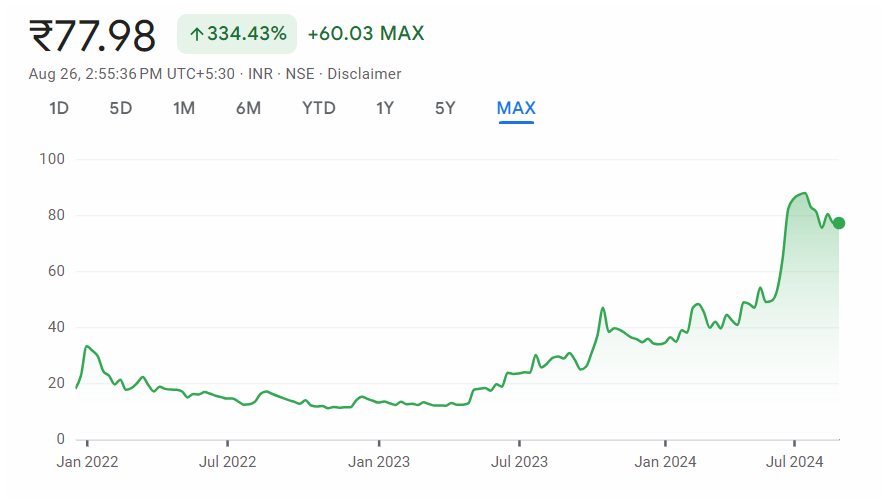
All time334.43%
Past 5 Years334.43%
Past 1 Year167.60%
Past 1 month-6.58%

The stock has delivered a return of 149.4% CAGR over the last 5 years.

Shareholding Pattern

Shareholder CategoryHolding (%)
Promoters67.51%
Foreign Institutional Investors (FII)8.38%
Domestic Institutional Investors (DII)0%
Public24.11%

The Bottom Line

MIC Electronics Limited’s successful acquisition of this order highlights its capability and commitment to providing advanced solutions for major infrastructure projects. The company is well-positioned to meet the needs of the Northern Railway Zone and contribute significantly to the smooth running of the Mahakumbh-2025 event.

For more information, visit the official site.

Jagatjit Industries Limited Share Price Target 2025 to 2030: Complete Overview

https://feelthecandlesticks.com/jagatjit-industries-share-price-target-2025-to-2030/

In this article, we will study about Jagatjit Industries Limited and its business. We will also discuss about Jagatjit Industries Limited Share Price Target from 2025 to 2030. So let us begin.

Company Overview

Jagatjit Industries Limited (JIL) was founded in 1944. The company started its journey with Jagatjit Chemical and Pharmaceutical Works and Jagatjit Laboratories in 1946, followed by the launch of its distillery in 1948. Over the decades, JIL has established itself as a pioneer in the industry, producing several premium brands, including the famous Aristocrat and Teachers whiskies. In 2023, JIL received approval for its Ethanol plant, marking another significant milestone in its long history.

Business Overview

Jagatjit Industries Limited is a global leader in the premium drinks segment, operating the largest integrated distilleries in Asia for manufacturing potable alcohol. The company is a trailblazer in India, being the first to have in-house capabilities for producing molasses and non-molasses based potable alcohol through fully automated distillation plants. Beyond alcoholic beverages, JIL’s diverse product range includes malt, malt extract, nutritious planned food, milk powder, ghee, dairy products, and malted milk foods.

Recent Financial Performance

MetricQuarter Ended June 2024Quarter Ended June 2023% Change
Sales (₹ Crore)153.65174.11−11.75%
Net Profit (₹ Crore)-4.262.74−255.47%

In the quarter ended June 2024, the company’s sales decreased by 11.75% compared to the same quarter in June 2023, dropping from ₹174.11 crore to ₹153.65 crore. Additionally, the company’s financial performance worsened significantly, with a net loss of ₹4.26 crore in June 2024, compared to a net profit of ₹2.74 crore in June 2023. This resulted in a negative change of 255.47% in net profit, indicating a sharp decline in profitability.

Key Financial Metrics

The company’s Market Cap stands at ₹971 crore, reflecting its overall valuation in the stock market. The Price to Earnings Ratio (P/E) is notably high at 357.07, significantly above the industry average of 39.6, indicating that the stock may be overvalued compared to its peers. The Debt to Equity ratio is 3.56, which suggests the company is heavily leveraged, relying more on debt than equity for financing. Lastly, the Return on Equity (ROE) is 11.1%, showing a moderate level of profitability in generating returns for shareholders relative to the equity invested.

Also Read – Promoters Increase Stake by Acquiring 6.16 Lakh Shares in NBFC

Stock Performance till now

https://feelthecandlesticks.com/jagatjit-industries-share-price-target-2025-to-2030/
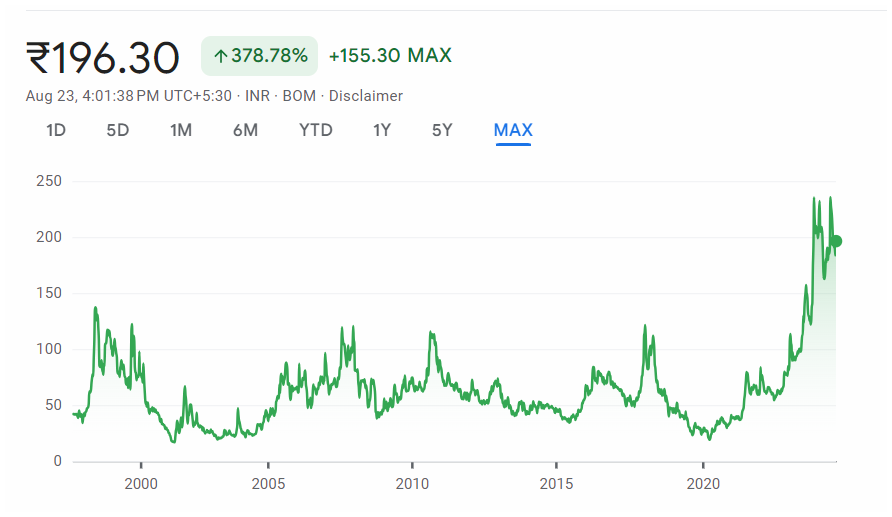
Time PeriodReturns
All time408.29%
Past 5 Years804.12%
Past 1 Year61.24%
Past 1 month4.58%

The stock has given a return of 10% CAGR in the past 10 years.

Share Price Target

While it’s tough to predict exact prices, you can use a simple method to guess future prices.

For example, if a stock is currently at ₹100 and the company has grown by 18% per year, you might expect the stock to grow at a similar rate if the company continues to perform well. The company’s growth refers to an increase in its revenue and profits.

If the company keeps growing at 18% per year, the stock might increase to about ₹118 (₹100 + 18% of ₹100).

On the other hand, if the stock has been falling by 10% due to poor financial performance, the price might drop to around ₹90 (₹100 – 10% of ₹100).

Remember, these are just rough estimates. Markets are inherently uncertain, and predicting exact future prices is nearly impossible.

Focus on the fundamentals of the business and make decisions accordingly. Whether to stay invested or to exit depends entirely on the financial performance of the company. Stay informed through regular analysis.

Don’t know how to analyze a company? Join our YouTube channel to learn fundamental analysis for free – Feel The Candlesticks

Share Holding Pattern

Shareholder CategoryHolding (%)
Promoters87.34%
Foreign Institutional Investors (FII)0%
Domestic Institutional Investors (DII)0.01%
Public12.66%

Promoters hold a significant stake of 87.34% in the company, which shows their confidence in the company’s long-term profitability.

The Bottom Line

The company operates the largest integrated distilleries in Asia, producing premium brands like Aristocrat and Teachers whiskies. JIL is also known for its diverse product range, including dairy products and malted milk foods. Despite recent market challenges, the company remains committed to innovation and profitability, as evidenced by its approval for an Ethanol plant in 2023 and strong promoter confidence with a significant 87.34% ownership stake. JIL’s focus on growth positions it well for future success.

Visit the official site for more information

What is IBZ and ISZ in Trading? – Important Points to Know

what-is-ibz-and-isz-in-trading

In the world of trading, two important concepts often used by traders are Institutional Buying Zones (IBZ) and Institutional Selling Zones (ISZ). These zones are closely linked to support and resistance levels on price charts. Understanding these concepts can help you create a more effective IBZ and ISZ trading strategy while avoiding potential pitfalls. So, let’s begin the lesson.

What is IBZ in Trading?

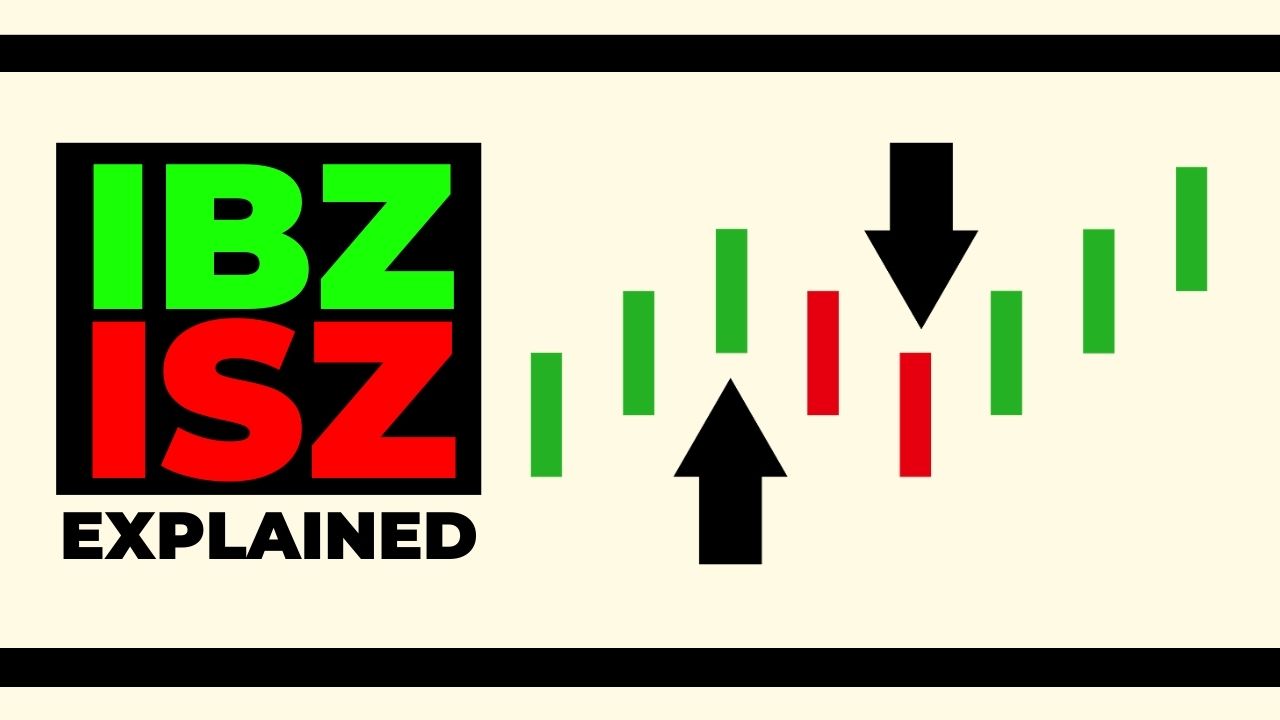
IBZ simply means Institutional Buying Zone.

IBZ is a price range where large institutional investors, such as mutual funds or hedge funds, are likely to buy a stock in significant quantities.

These investors have the power to influence the market due to the large volumes they trade. When institutions buy, they typically do so at price levels where they believe the stock is undervalued or has strong potential to rise.

https://feelthecandlesticks.com/what-is-ibz-and-isz-in-trading/

The IBZ is often identified as a support zone on a price chart. A support zone is a level where the price tends to stop falling and starts to rise. This happens because there is strong demand for the stock at that level. When institutions buy at these levels, it reinforces the support, making it harder for the price to drop below that zone.

For example, if a stock consistently finds buyers around ₹100, this level could be considered a support zone. If large institutions are buying at this price, it becomes an Institutional Buying Zone. Traders who recognize this zone may also buy, expecting the price to rise.

What is IBZ in Trading?

ISZ simply means Institutional Selling Zone.

ISZ is the opposite of an IBZ. It is a price range where large institutional investors are likely to sell off their holdings.

When these institutions decide to sell, it can lead to a decrease in the stock’s price due to the large volumes being offloaded.

https://feelthecandlesticks.com/what-is-ibz-and-isz-in-trading/

The ISZ is often identified as a resistance zone on a price chart. A resistance zone is a level where the price tends to stop rising and starts to fall. This occurs because there is strong selling interest at that level. When institutions sell at these levels, it reinforces the resistance, making it difficult for the price to move higher.

For instance, if a stock consistently faces selling pressure around ₹150, this level could be considered a resistance zone. If large institutions are selling at this price, it becomes an Institutional Selling Zone. Traders who recognize this zone may decide to sell or avoid buying, expecting the price to fall.

How do IBZ and ISZ Relate to Support and Resistance?

Support and resistance levels are key concepts in technical analysis.

  • Support is a level where a stock’s price tends to find buying interest, preventing it from falling further.
  • Resistance is a level where the price tends to find selling interest, preventing it from rising further.

When we talk about IBZ and ISZ, we are essentially talking about support and resistance levels where large institutional players are involved. The involvement of these large players makes these zones even more significant.

IBZ as Support: When a stock enters an IBZ, it means that institutions are likely to buy the stock, creating a strong support level. This support level is where the price is less likely to fall below because of the high demand from these big players. Traders often look for buying opportunities in these zones, expecting the price to bounce back.

ISZ as Resistance: When a stock enters an ISZ, it indicates that institutions are likely to sell their holdings, creating a strong resistance level. This resistance level is where the price is less likely to rise above because of the strong selling pressure. Traders often look for selling opportunities in these zones, expecting the price to drop.

Also Read – What is a Candlestick Chart?- 7 Important Things to Know

How to Use IBZ and ISZ in Your Trading Strategy?

Understanding where IBZ and ISZ are on a price chart can be very useful in developing a trading strategy. Here are a few tips on how to use these zones effectively:

  1. Identify the Zones: Look for these zones in higher time frames. Higher time frame support and resistance are basically IBZ and ISZ. Use technical analysis tools to identify potential IBZ and ISZ on your price chart.
  2. Follow the Trend: If the overall trend is up, consider buying in the IBZ. If the trend is down, consider selling in the ISZ.
  3. Watch for Confirmation: Before entering a trade, wait for confirmation that the price is respecting the IBZ or ISZ. This could be a reversal pattern or a strong price movement in the expected direction.
  4. Manage Your Risk: Always set stop-loss orders to protect yourself from unexpected market movements. For example, if you buy in an IBZ, set your stop loss just below the support level.
  5. Be Aware of False Breakouts: Sometimes, the price may temporarily break through a support or resistance level, only to return back. These are known as false breakouts. It’s important to confirm the breakout before taking action.

Conclusion

Understanding Institutional Buying Zones (IBZ) and Institutional Selling Zones (ISZ) can give you an edge in trading. By recognizing these zones as areas of strong support and resistance, you can make more informed decisions about when to buy or sell.

Also Read – What is Price Action in trading?-12 Important Questions Answered

Dye Making Company Announces Record Date for Dividend

Hindprakash Industries Limited, through an official communication dated August 23, 2024, announced the record date for determining the eligibility of shareholders to receive the final dividend for the financial year ending March 31, 2024. The record date has been set for September 6, 2024, applicable to equity shares with a face value of ₹10 each.

The final dividend, if approved at the upcoming Annual General Meeting (AGM), will be disbursed to eligible shareholders within 30 days from the date of approval.

Company Overview

Hindprakash Industries Limited was started in 2008. It is a well-known company in India. It has a strong presence in the chemical manufacturing industry. Over time, the company has gained a good reputation by providing a variety of products and services to its customers.

Business Overview

Hindprakash Industries focuses primarily on the manufacturing and trading of dyes, intermediates, auxiliary chemicals, and other merchandise. These products are essential in various industries, including textiles and pharmaceuticals, where they play a crucial role in production processes. The company’s diverse product portfolio allows it to cater to a broad range of industrial needs, ensuring its significant role in the market.

What is the latest update?

On August 23, 2024, Hindprakash Industries made an important announcement regarding the final dividend for the financial year ending March 31, 2024. The company has set September 6, 2024, as the record date to determine which shareholders are eligible to receive the dividend. This means that if you own shares of the company as of this date, you may be entitled to receive a dividend. The final dividend will be paid out within 30 days after it is approved at the company’s upcoming Annual General Meeting (AGM).

Read the official notification here

Recent Financial Performance

Hindprakash Industries recently released its financial results for the quarter ending in June 2024.

MetricQuarter Ended June 2024Quarter Ended June 2023% Change
Sales (₹ Crore)22.4827.49-18.22%
Net Profit (₹ Crore)0.260.58-55.17%

As shown in the table above, the company’s sales dropped by 18.22%, reaching ₹22.48 crore in June 2024, down from ₹27.49 crore in June 2023. Similarly, the net profit saw a significant decline of 55.17%, falling to ₹0.26 crore from ₹0.58 crore during the same period last year.

Key Financial Metrics

With a market cap of ₹157 crore, has a higher valuation compared to its industry peers, as shown by its P/E ratio of 130 against the industry average of 41.2. The stock is also trading at a premium with a P/BV of 3.13 compared to the industry’s 2.09.

Also Read – What is Dividend? – Complete Guide in Simple Words

Stock Performance

https://feelthecandlesticks.com/hindprakash-industries-limited-announces-record-date-for-dividend/
Time PeriodReturns
All time48.90%
Past 5 Years48.90%
Past 1 Year26.37%
Past 1 month-6.23%

Shareholding Pattern

Shareholder CategoryHolding (%)
Promoters74.95%
Foreign Institutional Investors (FII)0
Domestic Institutional Investors (DII)0
Public25.06%

Promoters own about 75% of the company, showing their strong confidence in it.

The Bottom Line

Hindprakash Industries Limited has announced an important date for shareholders, especially those looking forward to receiving the final dividend for the financial year 2023-2024. However, the company’s recent financial performance shows some challenges, with significant declines in both sales and net profit. Investors and stakeholders will be keeping a close watch on how the company navigates these challenges and whether it can bounce back in the coming quarters.

for more information, visit the official site

This Company Secures a ₹478 Cr Project from the Mumbai Metropolitan Region Development Authority

https://feelthecandlesticks.com/ashoka-buildcon-limited-latest-project/

Ashoka Buildcon Limited, a Fortune India 500 company and one of the leading highway developers in India, has recently secured a significant project by emerging as the Lowest Bidder (L-1) for a major contract awarded by the Mumbai Metropolitan Region Development Authority (MMRDA). The project, valued at ₹478 crore plus applicable GST, involves the design and construction of an elevated road connecting key locations in the Mumbai region.

Company Overview

Ashoka Buildcon Limited is a Fortune India 500 company and one of the leading highway developers in India. Established in 1976, Ashoka Buildcon has grown through its unwavering commitment to quality, safety, consistency, and environmental consciousness.

The company is listed on both the National Stock Exchange (NSE) and the Bombay Stock Exchange (BSE).

Business Overview

Ashoka Buildcon is engaged in the construction and infrastructure industry.

The company is an integrated player in the Engineering, Procurement, and Construction (EPC), Build-Operate-Transfer (BOT), and Hybrid Annuity Model (HAM) segments.

The company is involved in various sectors, including highways and bridges, power (EPC), railway works, buildings (EPC), city gas distribution, and smart infrastructure. Additionally, Ashoka Buildcon is involved in the sale of Ready Mix Concrete (RMC). The company has executed or is executing 41 Public-Private Partnership (PPP) projects and has a presence in over 20 states in India.

What is the latest update?

Ashoka Buildcon Limited has emerged as the Lowest Bidder (L-1) for a significant project awarded by the Mumbai Metropolitan Region Development Authority (MMRDA). The project involves the design and construction of an elevated road connecting various key locations in the Mumbai region, including Kalyan-Murbad Road, Badlapur Road, and Pune Link Road. This project, valued at ₹478 crore (plus applicable GST), is an Engineering, Procurement, and Construction (EPC) contract, and is expected to be completed within 36 months, including the monsoon period. The project is awarded by a domestic entity.

Read the official notification here

Recent Financial Performance

MetricQuarter Ended June 2024Quarter Ended June 2023% Change
Sales (₹ Crore)2465193527.39%
Net Profit (₹ Crore)15872119.44%
  • The sales increased by 27.39% from ₹1935 crore in June 2023 to ₹2465 crore in June 2024.
  • The net profit saw a significant increase of 119.44%, rising from ₹72 crore in June 2023 to ₹158 crore in June 2024.

Also Read – What do you mean by Net Profit? – Explained

Key Financial Metrics

Stock Performance

Ashoka Buildcon Limited latest project
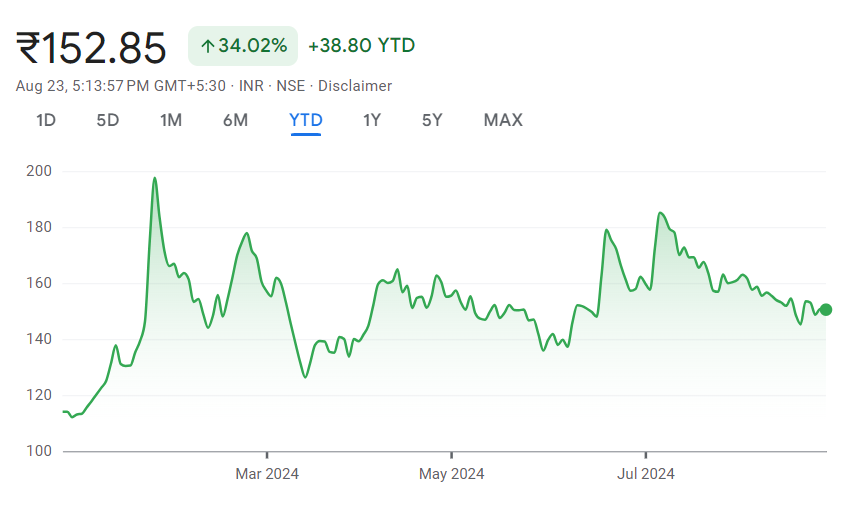
Time PeriodReturns
All time232.29%
Past 5 Years118.47%
Past 1 Year134.5%
Past 1 month-10.31%

Shareholding Pattern

Shareholder CategoryHolding (%)
Promoters54.48%
Foreign Institutional Investors (FII)7.63%
Domestic Institutional Investors (DII)19.32%
Public18.56%

The Bottom Line

In summary, Ashoka Buildcon Limited continues to solidify its position as a leading player in the infrastructure sector. The company’s recent success in securing a ₹478 crore project from the Mumbai Metropolitan Region Development Authority underscores its expertise and reputation in the industry. Furthermore, the impressive financial performance in the June 2024 quarter, with a 27.39% increase in sales and a remarkable 119.44% rise in net profit, reflects the company’s strong operational capabilities and strategic growth.

For more information, visit the official site

Interest Rates and Inflation – The Complete Guide to Learn the Relation Between Them

This article will break down inflation and interest rates in a simple way so you never have to look for explanations again.

What Is Inflation?

Inflation is the rise in prices of goods and services over time. When inflation happens, each dollar you have buys less than it did before. That is why a cup of coffee or a movie ticket costs more today than it did ten years ago.

There are a few reasons why inflation happens.

  • People may have more money to spend, so demand goes up and sellers charge higher prices.
  • It may cost businesses more to make products, such as higher wages or raw materials, so they pass those costs on to you.
  • Shortages or conflicts can make certain products harder to find, driving prices higher.
  • Governments or central banks might add too much money to the economy, reducing the value of each dollar.

In simple words, inflation means things get more expensive, and the value of your money goes down.


What Are Interest Rates?

Interest, in simple terms, is the money charged over money. When you borrow, you pay interest; when you save, you earn interest. But here, we are talking specifically about the Federal Reserve’s interest rate.

The Federal Reserve, or the Fed, is the central bank of the United States and one of the most closely followed financial institutions in the world. The Fed charges interest on the money it lends to banks. That interest rate is the foundation for almost every other rate in the financial system — from home loans to car loans and even business financing.

When you hear about the fuss over “interest rates” in the news, it usually means whether the Fed will increase or decrease this key rate. Because banks build their own rates on top of it, any change by the Fed affects the cost of borrowing and the return on savings across the entire economy.


How Do Interest Rates and Inflation Connect?

Interest rates and inflation work together like a thermostat controls temperature.

When inflation is too high and prices are rising too quickly, the central bank raises interest rates. Higher rates make loans more expensive, so people and businesses borrow and spend less, which can help cool down price increases.

When inflation is too low or the economy is struggling, the central bank lowers interest rates. This makes loans cheaper, encouraging people to spend and invest, which supports jobs and helps the economy grow.

You can think of interest rates as the gas pedal and brake of the economy, and inflation as how hot the engine is running.


How Do Federal Reserve Interest Rates Impact Stock Markets Around the World?

The U.S. Federal Reserve’s interest rate decisions affect stock markets around the world, not just in the United States. This happens because the U.S. dollar is the world’s reserve currency, and many countries trade and borrow in dollars.

When the Federal Reserve raises rates, the dollar often gets stronger. That can pull money away from other countries and their stock markets because investors look for safer returns in the U.S. Higher U.S. rates also mean higher borrowing costs for countries and businesses worldwide that have dollar-based debt.

As a result, global stock markets often react sharply. When rates go up, stock markets may fall because companies face higher borrowing costs and growth may slow down. When rates go down, stocks often rise because it becomes easier for businesses to borrow, invest, and grow.

In other words, a single decision by the Federal Reserve can send ripples through financial markets all over the world.


Why Does This Matter for You?

Interest rates and inflation affect your daily life in many ways.

  • Your home loan or car loan payments can change based on interest rates.
  • Your bank savings can earn more or less interest depending on rates.
  • The prices of groceries, fuel, and everyday goods are shaped by inflation.
  • Businesses hire and grow based on how affordable borrowing is.

The Big Picture

Central banks try to keep inflation steady, usually around two percent per year, so prices remain predictable and people can plan ahead. Their most important tool to manage this balance is interest rates.

If inflation gets out of control, they raise rates to slow it down. If the economy is weak, they lower rates to boost activity.

In short, inflation is about prices rising, and interest rates are the tool to control how fast or slow that happens.