The first time most people open a stock market app, it doesn’t feel like money at all.
It feels like noise.
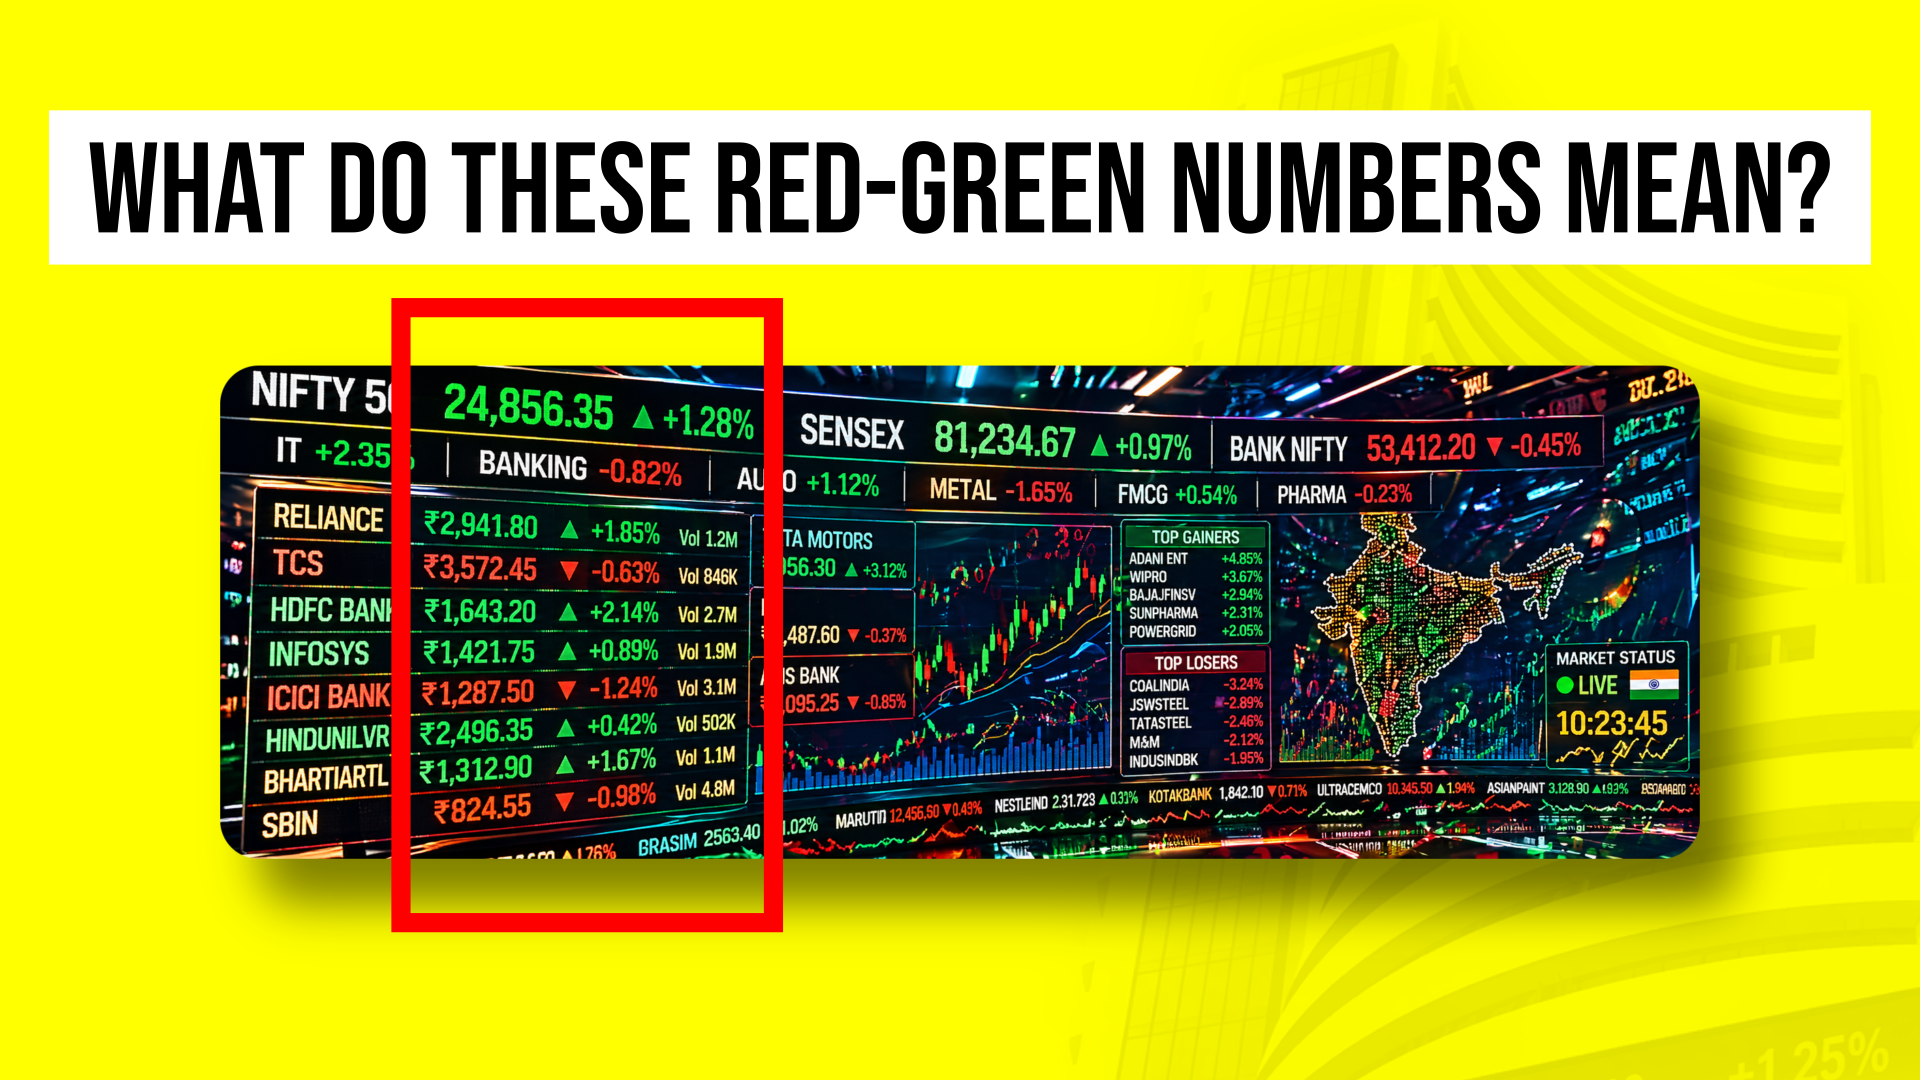
Red numbers, green numbers, percentages, values constantly moving… everything changing every second. It almost looks like a control panel instead of something related to investing.
And naturally, the first thought that comes to mind is simple:
What do these numbers actually mean?
The truth is, these numbers are not complicated. They just look complicated because no one explains them in a simple, relatable way.
Once you understand the basic idea behind them, everything starts to feel much clearer.
Understanding the Most Important Concept: Closing Price
Before understanding all the numbers, you need to understand one single concept:
Closing price.
When someone says a stock “closed at ₹100”, it simply means this:
Throughout the day, people are buying and selling that stock. Because of this, the price keeps changing continuously. It might go from ₹98 to ₹101, then to ₹99, then to ₹100, and so on.
At the end of the day, just before the market closes, the last transaction that happens between a buyer and a seller determines the final price.
That final price is called the closing price.
So if a stock “closed at ₹100”, it means the last deal of the day happened at ₹100.
This closing price becomes the most important reference point for the next day.
What do the green and red numbers mean in the stock market?
Now imagine this.
Yesterday, the stock closed at ₹100.
Today, you open your app and see ₹103.
What does that mean?
It simply means the price is ₹3 higher than where it ended yesterday.
That’s it.
The entire system of stock market numbers revolves around comparing the current price with the previous closing price.
Breaking Down Stock Market Numbers
When you look at a stock, you will usually see something like this:
₹103 +3 (+3%)
This may look confusing at first, but it’s actually very simple when broken down.
The first number, ₹103, is the current price. This tells you where the stock is right now.
The second number, +3, is the absolute change. This shows how much the price has moved compared to yesterday’s closing price.
The third number, +3%, is the percentage change. This shows how big that movement is in percentage terms.
All three numbers are just different ways of telling the same story.
Understanding Positive and Negative Changes
Now let’s look at both scenarios clearly.
If yesterday the stock closed at ₹100 and today it is at ₹103, then:
₹103 +3 (+3%)
This means the price has increased by ₹3.
This is usually shown in green.
On the other hand, if yesterday it closed at ₹100 and today it is at ₹97, then:
₹97 -3 (-3%)
This means the price has decreased by ₹3.
This is usually shown in red.
So the logic is simple.
Positive change means the price has gone up.
Negative change means the price has gone down.
Watch this video for a better understanding!
Why Are Some Numbers Green and Some Red?
The colors in the stock market are there to make things easier to understand visually.
If the current price is higher than the previous closing price, it is shown in green. This indicates that the stock is up.
If the current price is lower than the previous closing price, it is shown in red. This indicates that the stock is down.
There is nothing more complicated behind it. It is simply a visual indicator of whether the price is higher or lower compared to the last closing price.
What Do Percentage Changes Really Mean?
A common beginner confusion is this:
If the absolute change is already shown, why do we need percentage?
The answer is simple.
Absolute change alone does not tell you how significant the movement is.
For example, if a stock moves from ₹100 to ₹103, that is a 3% move.
But if a stock moves from ₹1000 to ₹1003, that is only a 0.3% move.
Even though the change is ₹3 in both cases, the impact is very different.
Percentage helps you understand the intensity of the movement, not just the number.
What is Meant by “Points” in the Stock Market in India?
When people talk about the stock market moving in “points”, they are usually referring to an index like Nifty or Sensex.
If someone says the market went up by 100 points, it simply means the index value increased by 100 units.
This is very similar to how individual stock prices move, but instead of a single company, an index represents a group of companies.
So “points” is just another way of expressing numerical movement, especially for indices.
What Does It Mean When the Market Drops 1,000 Points?
You might often hear statements like:
“The market dropped 1,000 points today.”
This does not mean that every stock lost value equally.
It means that a major index, like Sensex or Nifty, has fallen by 1,000 points compared to its previous closing value.
This usually indicates a broad decline in the market, but the actual impact can vary across different stocks.
Some stocks may fall more, some less, and a few might even rise.
Bringing It All Together
At first, stock market numbers look confusing because they are presented all at once.
But in reality, they are just telling one simple story in three ways.
The current price tells you where the stock is right now.
The absolute change tells you how much it has moved compared to the last closing price.
The percentage change tells you how big that movement is.
And all of this is always being compared to one reference point:
Where the price last ended.
Final Thought
Once you understand this, the stock market stops feeling like a complicated system full of random numbers.
It starts feeling like a simple comparison.
Every number you see is just answering one question:
Where is the price now, compared to where it was before?
And once this clicks, the entire screen that once felt confusing starts making sense.
What are Q1, Q2, Q3, and Q4 in the stock market?
In the stock market, Q1, Q2, Q3, and Q4 simply refer to the four quarters of a financial year (fiscal year). Instead of reporting performance for the entire year at once, companies break it into these four parts to show progress step by step. Q1 represents the first three months of the financial year, Q2 covers the next three months, Q3 includes the following three months, and Q4 represents the final three months of the year.
What does it mean when the Dow drops 1,000 points?
It means the Dow Jones Industrial Average is 1,000 points lower than its previous closing level. In simple terms, the combined value of 30 major U.S. stocks has declined compared to the last trading day’s close. This reflects overall market weakness and selling pressure.
What is Meant by “Points” in the Stock Market in India?
When people talk about the stock market moving in ‘points,’ they usually mean the index has moved up or down by a certain number of units. For example, if the market goes up by 100 points, it means the index value has increased by 100