With over 3 years of experience in financial markets, we focus on simplifying global and Indian markets through clear, practical insights. Our expertise also extends to the evolving landscape of digital finance, including blockchain, stablecoins, and decentralized finance (DeFi).
Return on equity (ROE) simply means how much return you are generating over the shareholders’ funds.
Shareholders’ funds are called equity.
What is Equity?
The money a company receives after selling its ownership is called equity or shareholders’ funds.
Suppose you open a samosa shop in your local area. You raise ₹5 lakh after selling 25% ownership of your shop. At the end of the year, you generate ₹1 lakh in profit.
To calculate the return on equity (ROE), you divide the profit by the total shareholders’ funds, which is ₹5 lakh in this case. So, your ROE will be:
This means that for every ₹100 invested by the shareholders, your samosa shop is generating ₹20 in return. In simple words, ROE shows how well you’re using the money invested by the shareholders to generate profits.
With over 3 years of experience in financial markets, we focus on simplifying global and Indian markets through clear, practical insights. Our expertise also extends to the evolving landscape of digital finance, including blockchain, stablecoins, and decentralized finance (DeFi).
An ETF, or Exchange Traded Fund, is similar to a mutual fund but offers more flexibility. As the name suggests, ETFs are traded on stock exchanges, just like regular stocks. Essentially, ETFs are baskets of different securities (like stocks, bonds, or commodities) that hold a collective value. When you invest in an ETF, you’re investing in a wide range of securities indirectly, meaning you don’t own each security individually, but you own a part of the overall fund.
ETFs combine the features of both mutual funds and stocks. They provide the diversification of a mutual fund with the ease of trading in the stock market.
Table of Contents
Types of ETFs
There are different types of ETFs, depending on what they focus on. Some common ones include:
Equity ETFs: These hold stocks from various companies.
Bond ETFs: These focus on different types of bonds.
Commodity ETFs: These track assets like gold, oil, or other commodities.
Sector ETFs: These focus on specific sectors like technology or healthcare.
International ETFs: These invest in stocks or bonds from international markets.
How are ETFs made?
ETFs are built by fund managers who own various underlying assets like stocks, bonds, or commodities. The fund manager creates a “basket” of these assets, known as a fund, which aims to track the performance of those assets.
Once the fund is created, it is divided into shares, which investors can buy. However, as an investor, you do not directly own the individual assets inside the ETF, but rather a share of the overall fund.
3 Important Points to Know about ETFs
Trade on Exchanges: ETFs can be bought and sold on stock exchanges just like regular company shares.
Dividends: ETFs pay dividends if the stocks within the fund distribute dividends to their shareholders.
Flexibility: ETFs can be traded throughout the day, unlike mutual funds which are only bought or sold at the end of the trading day.
Flexibility: Since ETFs are traded on stock exchanges, you can buy or sell them at any time during market hours, just like stocks.
Diversification: By investing in an ETF, you’re indirectly investing in a wide range of securities, which helps in spreading your risk.
Lower Fees: ETFs often have lower management fees compared to mutual funds, making them cost-effective.
Transparency: The holdings of an ETF are usually disclosed daily, so investors always know what assets are inside the fund.
What are the disadvantages of an ETF?
Liquidity Issues: Sometimes, certain ETFs can face liquidity problems, meaning they can be hard to buy or sell quickly, especially in less popular markets.
Trading Costs: While ETFs have low management fees, each time you buy or sell them, you might have to pay a brokerage fee, which can add up if you trade frequently.
Investing in ETFs is quite simple and similar to buying stocks. Here’s how you can do it:
Open a Demat Account: You need a Demat account with a registered broker.
Deposit Funds: Add money to your trading account.
Find an ETF: Search for the ETF you want to invest in.
Buy or Sell: You can buy or sell the ETF directly from the stock exchange.
Conclusion
ETFs are a great tool for investors who want to diversify their investments without having to pick individual stocks or bonds. They offer flexibility, transparency, and the potential for lower fees compared to mutual funds. Whether you’re a beginner or an experienced investor, ETFs can be a useful part of your investment portfolio to spread risk across various asset classes.
If you’re looking to diversify your portfolio, trade easily, and gain exposure to a variety of assets, ETFs might be a smart choice.
Disclaimer: This information is for educational purposes only and does not constitute financial advice. Always conduct your own research and consult with financial professionals before making investment decisions.
With over 3 years of experience in financial markets, we focus on simplifying global and Indian markets through clear, practical insights. Our expertise also extends to the evolving landscape of digital finance, including blockchain, stablecoins, and decentralized finance (DeFi).
Panic selling happens when people quickly sell their investments during a stock market drop because they feel scared and uncertain. This can cause prices to fall even faster. It’s a natural reaction based on human psychology, where people try hard to avoid losing money and protect what they have.
Table of Contents
Basic Human Psychology
Loss Aversion: People tend to prefer avoiding losses rather than acquiring equivalent gains. This means that the pain of losing money is psychologically more impactful than the pleasure of gaining the same amount.
Herd Behavior: Individuals often follow the actions of a larger group, especially in uncertain situations. If a significant number of investors start selling their assets, others are likely to follow, fearing they might miss the opportunity to minimize their losses.
Scenario Example: The Great Market Crash
Let’s explore a hypothetical scenario to understand how panic selling unfolds.
Scenario: The Great Market Crash
Imagine a stock market that has been performing well for several years. Investors are confident, and asset prices are high. Suddenly, unexpected news hits the market – perhaps a major geopolitical event or a significant economic downturn. Investors start feeling uncertain about the future.
Initial Trigger: A few large investors, sensing potential trouble, begin to sell their assets. This initial selling causes a slight drop in asset prices.
Spread of Fear: Seeing the drop, other investors become anxious. They start thinking, “If others are selling, there must be something wrong.” The fear of losing their investments kicks in.
Mass Selling: As more investors sell, asset prices continue to fall. The media reports the decline, further fueling the fear. At this point, even those who weren’t initially concerned start to panic. They sell their assets to avoid further losses.
Market Plunge: The collective panic leads to a significant market downturn. Asset prices plummet, often beyond what the initial news warranted.
Several psychological factors contribute to this behavior:
Fear of the Unknown: Uncertainty about the future makes people anxious. In financial markets, this translates to fear of losing money.
Overreaction to Negative News: Negative news has a more substantial impact on human emotions than positive news. This causes exaggerated responses, like panic selling.
Confirmation Bias: Investors seek information that confirms their fears. During a downturn, they are more likely to notice and believe negative news, reinforcing their decision to sell.
Regret Aversion: The fear of regretting not selling earlier can drive people to sell, even if they haven’t fully analyzed the situation.
5 Important Points to Know
Be greedy when everyone is fearful, and be fearful when everyone is greedy: Fear causes people to miss the opportunity of buying fundamentally good companies. Stay calm and look for value during market downturns.
Do your own research: Always make informed decisions based on your own research. Relying solely on tips or market rumors can lead to bad investments. Understanding a company’s fundamentals is important.
Invest for the long term: Patience pays off in the stock market. The power of compounding works best over time, so focus on long-term growth rather than short-term gains.
Diversify your portfolio: Never put all your money into one stock or sector. A diversified portfolio helps spread risk and protects against unexpected downturns.
Don’t let emotions drive your decisions: Market volatility can trigger fear or greed, but it’s important to stay calm. Stick to your investment strategy and avoid reacting impulsively to short-term market movements.
Conclusion
Panic selling happens because of how our minds work. Understanding this can help investors control their emotions during times when the market is falling. It’s normal to want to avoid losing money, but making decisions based on fear or following what everyone else is doing can lead to bad financial choices.
By being aware of these feelings, investors can stay calm, think clearly, and avoid the mistakes of panic selling.
With over 3 years of experience in financial markets, we focus on simplifying global and Indian markets through clear, practical insights. Our expertise also extends to the evolving landscape of digital finance, including blockchain, stablecoins, and decentralized finance (DeFi).
When investors analyze companies in the stock market, they often come across the terms ‘industry’ and ‘sector’. These terms might seem confusing, but they are important for understanding how companies are grouped and compared. In this article, we’ll clear up the confusion between these two terms with simple examples. Let’s begin.
Table of Contents
What is a sector?
A sector represents a broad category within the economy. It includes multiple industries that share common characteristics. For example, the technology sector includes industries related to software, hardware, and telecommunications.
What is an industry?
An industry is a group of companies that are closely related based on the products and services they offer. For instance, within the technology sector, the software industry includes companies that create and sell software products.
Sectors are broader categories that include various industries.
Industries are subsets of sectors. Every industry belongs to a sector, but a sector is not limited to one industry.
Conclusion
Understanding the difference between sectors and industries is important for investors who want to make informed decisions in the stock market. Sectors provide a broad view of the economy, while industries offer a more focused look at specific groups of companies. By knowing how these terms relate, you can better analyze companies, compare their performance, and make smarter investment choices.
With over 3 years of experience in financial markets, we focus on simplifying global and Indian markets through clear, practical insights. Our expertise also extends to the evolving landscape of digital finance, including blockchain, stablecoins, and decentralized finance (DeFi).
With over 3 years of experience in financial markets, we focus on simplifying global and Indian markets through clear, practical insights. Our expertise also extends to the evolving landscape of digital finance, including blockchain, stablecoins, and decentralized finance (DeFi).
A share buyback happens when a company decides to buy back its own shares from the market. They usually offer a price higher than what the shares are currently worth. This reduces the number of shares available for trading. When there are fewer shares, the value of the remaining shares can go up. Companies buy back shares for different reasons, like returning cash to shareholders or showing confidence in the company’s future.
Table of Contents
How does share buyback work?
There are two main ways a company can buy back shares:
Open Market Buyback: The company buys shares directly from the stock market over time. They buy shares at the market price when they think the time is right.
Tender Offer Buyback: The company offers to buy shares from shareholders at a fixed price, which is usually higher than the market price. Shareholders can choose to sell their shares during a specific period.
What is the purpose of share buyback?
Companies buy back shares for several reasons:
Undervalued Stock: The company might think its shares are worth more than the current market price. By buying them back, they hope to boost the stock price.
Rewarding Shareholders: Shareholders who sell their shares in a buyback can get a higher price than the market offers.
Tax Benefits: Sometimes, buybacks are more tax-friendly for shareholders compared to getting dividends.
Reducing Outstanding Shares: When there are fewer shares in the market, the earnings per share (EPS) can increase, which might make the stock more valuable.
To take part in a share buyback, follow these steps:
Check the Buyback Offer: The company will send you details about the buyback. Look at the offer price and the time period.
Apply Through Broker/Demat Account: Use your broker or demat account to submit your shares for the buyback during the offer period.
Receive Payment: If your shares are accepted, you’ll get the money directly into your bank account.
How to check buyback status?
You can check the status of your buyback application in two ways:
Company’s Website: Some companies post updates about the buyback process on their website.
Broker Portal: Many brokers provide updates on buyback status through their online platforms.
Key terms related to share buybacks
a. Record Date
The record date is the cut-off date set by the company. Only shareholders who own shares on or before this date can participate in the buyback.
b. Entitlement Ratio
The entitlement ratio shows how many shares you can offer for buyback based on your current holding. It gives you an idea of how many shares you might be able to sell back to the company.
c. Acceptance Ratio
The acceptance ratio shows the actual number of shares the company accepts compared to the number of shares shareholders offered in the buyback. This ratio can change depending on how many people participate.
5 Important Facts to Know About Share Buybacks
A company cannot buy back more than 25% of its total paid-up equity capital in a financial year. For buybacks up to 10% of the total paid-up equity capital and free reserves, only Board approval is needed. For larger buybacks, shareholders must approve it.
Companies cannot borrow money to finance a buyback. They must use their free reserves, securities premium account, or proceeds from other shares.
The Securities and Exchange Board of India (SEBI) requires companies to reserve 15% of the buyback offer for small investors holding shares worth up to ₹2 lakhs on the record date.
After a buyback, the company’s debt-to-equity ratio should not exceed 2:1. This means the company’s total debt should not be more than twice its equity.
The buyback must be completed within 12 months from the date of the special resolution or Board resolution authorizing it.
What are the advantages and disadvantages of share buybacks?
Advantages
Sell at a Premium: Shareholders can sell their shares at a higher price than the market value.
Improved Financial Ratios: Fewer shares in the market can lead to a higher earnings per share (EPS), which might increase the stock price.
Sign of Confidence: A buyback shows that the company believes its shares are undervalued.
Disadvantages
Reduced Cash Reserves: The company’s cash reserves decrease, which might affect other investments.
Signals Lack of Growth Opportunities: Frequent buybacks might mean the company doesn’t have better ways to use its cash.
Potential Market Manipulation: Buybacks can temporarily increase share prices, which may not reflect the company’s true value.
Limited by Regulations: Companies face restrictions like not being able to borrow money for buybacks and must finish the process within a certain time.
Is there any tax on buyback income?
Yes, starting from October 2024, the entire amount shareholders receive from buybacks will be treated as dividend income. This income will be taxed according to your income tax slab. The company will also deduct tax at source (TDS).
Previously, buyback income was taxed as capital gains for shareholders, and the company paid a dividend distribution tax.
Conclusion
A share buyback can be a good opportunity for shareholders to sell their shares at a higher price. It can also help increase the value of the remaining shares. However, it’s important to consider your own investment goals and the company’s financial health before deciding to participate. Staying informed about regulations and tax implications is also important when thinking about a buyback.
Yes, a company can cancel a planned buyback if it decides not to proceed, often due to changes in financial or market conditions.
Do I have to sell my shares in a buyback compulsorily?
No, participation in a buyback is voluntary. Shareholders can choose whether or not to sell their shares back to the company.
Who is eligible for a buyback of shares?
Shareholders who hold shares in their demat account on the Record Date are eligible for the buyback.
Disclaimer: This information is for educational purposes only and does not constitute financial advice. Always conduct your own research and consult with financial professionals before making investment decisions.
With over 3 years of experience in financial markets, we focus on simplifying global and Indian markets through clear, practical insights. Our expertise also extends to the evolving landscape of digital finance, including blockchain, stablecoins, and decentralized finance (DeFi).
The debt market, also known as the bond market or credit market, is an essential part of the financial world. It’s where different types debt instruments are bought and sold. In simple terms, the debt market is where people, companies, and governments borrow money by issuing bonds or similar securities. Investors lend money by purchasing these bonds. This market plays an important role in the economy, helping governments fund projects, companies expand, and investors earn steady returns.
Table of Contents
What are Debt Instruments?
Debt instruments are financial instruments that represent a loan. When an investor buys a debt instrument, they are essentially lending money to the issuer, whether it’s a government, a company, or another organization. The issuer promises to pay back the borrowed amount, known as the principal, along with interest at a specified time in the future.
Unlike stocks, where investors become partial owners of a company, debt instruments do not grant ownership. Instead, they provide a fixed income in the form of interest payments. This makes debt instruments a more predictable investment compared to stocks, which can fluctuate widely in value.
Types of Debt Instruments
There are several types of debt instruments, each with its own characteristics and uses. Here are some of the most common types:
Government Securities (G-secs): Government Securities, or G-Secs, are financial instruments issued by the Reserve Bank of India on behalf of the Government of India. G-secs are often used by governments to fund infrastructure projects, public services, and other essential activities. They come with different maturity periods, ranging from 1 year to 30 years. These securities pay a fixed interest rate every six months. For shorter-term investments, the Reserve Bank issues Treasury Bills (T-Bills), with maturities of 91, 182, or 364 days. G-Secs are considered very safe investments with no risk of default.
Corporate Bonds: Corporate Bonds are issued by companies or public sector undertakings and can last up to 15 years, with some even being perpetual. Compared to government bonds, corporate bonds typically offer higher returns to compensate for the higher risk of default. The risk associated with corporate bonds depends on the financial health of the issuing company, market conditions, and the industry in which the company operates. As a result, corporate bonds usually provide higher yields than government bonds.
Certificates of Deposit (CDs): Certificates of Deposit (CDs) are short-term investment products offered by banks and financial institutions. Banks offer CDs with maturities from 7 days to 1 year, while financial institutions can offer them for up to 3 years. CDs usually provide higher returns than regular savings accounts. They are issued in amounts starting from Rs. 1 lakh. CDs are considered very safe investments.
Commercial Papers: Commercial papers are short-term loans issued by companies to meet their immediate financial needs. They have maturities from 7 days to 1 year and are sold at a discount. The minimum investment amount is Rs. 5 lakh. Because they are short-term, commercial papers usually offer lower interest rates than long-term bonds, but they are still a valuable tool for companies needing quick financing. However, they generally offer higher returns than fixed deposits and CDs.
How Does the Debt Market Work?
The debt market functions through the issuance and trading of debt instruments. Here’s a simple breakdown of how it works:
Issuance: When a government, company, or other entity needs to raise money, they issue a debt instrument such as a bond. This bond is a promise to repay the loan with interest over a specified period.
Purchase: Investors buy these debt instruments, effectively lending money to the issuer. The price of the bond is usually based on the interest rate, the creditworthiness of the issuer, and the bond’s maturity date (the date when the principal amount will be repaid).
Interest Payments: Over the life of the bond, the issuer pays interest to the investor, usually on a regular basis, such as quarterly or annually. This interest is the investor’s return on their investment.
Maturity: When the bond reaches its maturity date, the issuer repays the principal amount to the investor, completing the transaction.
The debt market allows for the buying and selling of these debt instruments in the secondary market as well. Investors can trade bonds before they mature, potentially making a profit if the bond’s price has increased.
How Is the Bond Market Better Than the Equity Market?
The bond market has several advantages over the equity (stock) market, particularly for investors who prioritize safety and predictability. Here are some key reasons why the bond market might be considered better than the equity market:
Safety: Bonds are generally safer than stocks. While stocks can offer higher returns, they come with higher risks. The value of stocks can fluctuate widely based on market conditions, company performance, and investor sentiment. In contrast, bonds provide a fixed income through regular interest payments and are less likely to lose value.
Fixed Returns: Bonds offer predictable returns. When you buy a bond, you know exactly how much interest you will earn and when you will receive it. This makes bonds an attractive option for investors who need a reliable income stream, such as retirees.
Priority in Payment: If a company goes bankrupt, bondholders are paid before shareholders. This means that in the event of financial trouble, investors in bonds are more likely to get their money back compared to investors in stocks.
Lower Volatility: The bond market is generally less volatile than the stock market. This means that bond prices tend to fluctuate less than stock prices, providing a more stable investment environment.
Conclusion
The debt market is a vital part of the financial system that offers a way for governments, companies, and other entities to raise money. Debt instruments like bonds, debentures, commercial papers, and government securities provide investors with a relatively safe and predictable way to earn returns. While the bond market may not offer the same potential for high returns as the stock market, it provides safety, fixed income, and priority in payments, making it an essential part of a well-rounded investment strategy. For beginners and conservative investors, understanding the debt market is a key step toward making informed investment decisions.
With over 3 years of experience in financial markets, we focus on simplifying global and Indian markets through clear, practical insights. Our expertise also extends to the evolving landscape of digital finance, including blockchain, stablecoins, and decentralized finance (DeFi).
In this article, we’ll explore an important topic in stock trading: the different types of orders you can place in the stock market. The order pages of various brokers often present many options, which can be confusing. This article will help you understand limit orders, market orders and stop orders, so you can make more informed decisions when buying or selling stocks or any type of financial instrument in the financial markets. So, Let’s get started!
Table of Contents
A Simple Analogy to Understand Market Order, Limit Order, & Stop Order
Let’s say you are out to buy some apples. There could be three possible scenarios:
You want to buy apples only if the price is 100 rs per kg or less – This is like a limit order. You have a fixed price in mind and will only buy if the apples cost 100 rs or less. If the price goes higher, you won’t buy.
You are willing to buy apples at any price – This is like a market order. You don’t care about the price; you just want to buy apples immediately, no matter what they cost.
You want to buy apples only if the price goes above 100 rs per kg – This works like a buy stop order. You believe that if the price exceeds 100 rs, it shows strong demand, and you think it might go even higher, so you want to buy once the price reaches 100 rs or more.
Now, suppose you are a seller. You have to sell apples, and again, there are three possible scenarios:
You want to sell your apples only if the price reaches 120 rs per kg – This is a limit order. You have set a specific price and will only sell your apples when the price hits 120 rs or more.
You are willing to sell apples at any price – This is a market order. You don’t care about the current price; you just want to sell immediately at whatever price the market offers.
You want to sell your apples only if the price drops below 110 rs per kg – This is a stop-loss order. You’re waiting for the price to fall below 110 rs to sell because you think the price might keep dropping, and you want to sell before it goes even lower.
A buyer typically aims to buy at the lowest possible price to maximize their value and minimize the cost of acquiring an asset. A seller typically wants to sell at the highest possible price to maximize their profit from the transaction.
What is a limit order?
A limit order allows you to set a specific price at which you want to buy or sell a stock.
If you’re buying, you set a maximum price you’re willing to pay.
If you’re selling, you set a minimum price you’re willing to accept.
Analogy:
If you want to buy apples only if the price is 100 rs per kg or less, that’s a buy limit order. You won’t buy the apples if the price goes above 100 rs.
If you want to sell apples only if the price is 120 rs per kg or more, that’s a sell limit order. You won’t sell unless the price reaches at least 120 rs.
Pros:
You have control over the price at which you buy or sell.
Cons:
There’s a chance that your order may not execute if the stock price doesn’t hit your limit.
What is a market order?
A market order is executed immediately at the current market price, regardless of what that price is. You prioritize speed over price.
Analogy:
If you want to buy apples at any price as long as you can get them right now, that’s a market order. You don’t care whether the price is 90 rs or 110 rs, you just want to buy right away.
If you want to sell apples immediately at whatever price the market offers, that’s a sell market order. You’ll take the best available offer, even if it’s not what you ideally wanted.
Pros:
It executes quickly, ensuring you get in or out of a trade without delay.
Cons:
The final price may be different from what you expected, especially in a fast-moving market. Your order could be executed at 110 Rs too.
What is a stop order?
A stop order (or stop-loss order) turns into a market order once a specified “stop” price is hit. There are two types: buy stop order and sell stop order.
Buy Stop Order:
A buy stop order is placed above the current market price. You use it when you want to buy a stock only after its price rises to a certain level, believing it will keep going up.
Analogy:
If apples are currently priced at 90 rs per kg, and you believe the price will keep rising if it crosses 100 rs, you might place a buy stop order at 100 rs. This means you will only buy the apples if the price hits or exceeds 100 rs.
Sell Stop Order:
This type of order can be used in two situation. One, if you are short selling a stock , second, If you want to protect your long positiom from losses happening because of a declining price which is called a stop loss order.
A sell stop order is placed below the current market price. It’s used to prevent further losses if the price drops too much. Once the price hits the stop level, it triggers a market order to sell the stock.
Analogy:
If you own apples and want to sell them if the price drops below 110 rs per kg, you place a sell stop order at 110 rs. When the price hits 110 rs or lower, it triggers a sale to avoid further loss in case the price continues to fall.
Stop-Loss Limit Order
What It Is: This is a combination of a stop-loss order and a limit order. It sells the stock when it hits a stop price but only at a limit price you specify.
How It Works:
Stop Price: The price at which the order becomes active.
Limit Price: The minimum price you’re willing to accept once the order is active.
Pros:
Gives you more control over the price at which you sell.
Cons:
If the stock price falls rapidly below your limit price, the order might not be executed.
What It Is: A cover order is a disciplined type of order that includes both a buy price and a stop-loss price. It’s designed to help traders manage their risk.
How It Works:
You set a buy price and a stop-loss price at the same time.
If the stock price falls to your stop-loss price, the order will be executed to limit your losses.
Pros:
Helps manage risk with predefined stop-loss levels.
Cons:
More suitable for short-term traders rather than long-term investors.
One Cancels the Other (OCO) Order
What It Is: An OCO order allows you to set both a target price and a stop-loss price. If one order is executed, the other is automatically canceled.
How It Works:
Target Price: The price at which you want to sell for profit.
Stop-Loss Price: The price at which you want to sell to limit losses.
If the stock hits the target price, the stop-loss order is canceled. If it hits the stop-loss price, the target price order is canceled.
Pros:
Automatically manages both profit-taking and risk control.
Cons:
Requires careful planning to set both target and stop-loss prices effectively.
After-Market Order (AMO)
What It Is: An after-market order lets you place trades outside regular trading hours, usually after 3:30 PM, for execution in the next trading session.
How It Works:
Allows you to set trades for after the market closes.
Pros:
Provides flexibility to trade beyond regular hours.
Cons:
Less liquidity can mean wider spreads and potentially less favorable execution.
Conclusion
Understanding these different types of orders can make a big difference in how you trade in the stock market. Whether you want to execute trades quickly with a market order, control your price with a limit order, or manage risks with stop-loss orders, knowing your options will help you trade more effectively. If you have any questions or need more details, just let me know! Happy trading!
With over 3 years of experience in financial markets, we focus on simplifying global and Indian markets through clear, practical insights. Our expertise also extends to the evolving landscape of digital finance, including blockchain, stablecoins, and decentralized finance (DeFi).
Promoter holding plays an essential role in shaping the sentiments of investors. Typically, promoters are seen as the backbone of a company, as they are often the founders or major stakeholders. However, some companies, like ITC, HDFC, Paytm, L&T, Ujjivan Bank, and ICICI Bank, have zero promoter holding. But why is this the case? Why do some companies operate without promoters? In this article, we’ll explore the entire concept of promoters and promoter holding in a company. Let’s get started!
Table of Contents
What are promoters?
Promoters are individuals or entities who play a major role in creating and developing a company. They are the ones who bring together resources, arrange funding, and guide the company in its early stages. Promoters often hold a significant number of shares in the company and help make strategic decisions.
Is a Promoter the Owner?
While a promoter can own a large portion of the company, they are not always the sole owner. Ownership is shared among all shareholders. However, promoters usually have more influence on the company’s decisions compared to regular shareholders.
What Is the Legal Status of a Promoter?
Promoters have a special legal status. They are responsible for setting up the company and are involved in drafting important documents like the company’s memorandum and articles of association. Although they may not always own the company, they play a key role in its foundation and early growth.
What does it mean when promoter holding is zero?
There could be many companies where promoter holding is zero. It simply means no single person or entity has a significant ownership stake. These companies are often referred to as “professionally managed companies.” In these companies, decision-making is done by a Board of Directors and professional managers instead of a single promoter or group of promoters.
What happens when promoter holding is zero?
When a company has zero promoter holding, it means the company is managed by professionals and not controlled by a single entity. This can have both positive and negative effects:
Advantages
Balanced Decisions: Since no single promoter controls the company, decisions are often more balanced and consider the interests of all stakeholders.
Professional Management: The company is managed by experienced professionals who focus on the company’s long-term growth and stability.
Disadvantages
Ownership Dilution: To retain talented employees, the company might offer Employee Stock Option Plans (ESOPs), which can dilute ownership.
Lack of Promoter Interest: If a company had promoters who reduced their stake or left, it might be seen as a lack of interest or confidence in the company. This could worry some investors.
What is the difference between a promoter and a shareholder?
A promoter is a specific type of shareholder who is involved in setting up the company. However, not every shareholder is a promoter. Shareholders can simply be people who buy shares of the company without being involved in its creation or operations.
What is the 75% shareholding rule?
Promoters would have to release minimum 25% ownership to the public if it is a public company and listed in a stock exchange.
What if promoter holding is more than 75%?
If a promoter holds more than 75% of the company’s shares, they are required to sell the extra shares to bring their holding down to 75% or less. This rule applies to public companies listed on a stock exchange. It ensures that at least 25% of the company’s shares are available to the public.
Conclusion
A company with zero promoter holdings can still be a good investment if it shows strong fundamentals, has good management, and follows sound governance practices. Always do thorough research and consider multiple factors before making investment decisions. While promoter holding is important, it is just one of the many factors to look at when evaluating a company.
Can a promoter leave a company?
Yes, a promoter can leave a company by selling their ownership stake to others. This could happen gradually or all at once, depending on the situation.
Can a company have only one promoter?
Yes, a company can have only one promoter. This promoter would be responsible for starting and growing the company.
With over 3 years of experience in financial markets, we focus on simplifying global and Indian markets through clear, practical insights. Our expertise also extends to the evolving landscape of digital finance, including blockchain, stablecoins, and decentralized finance (DeFi).
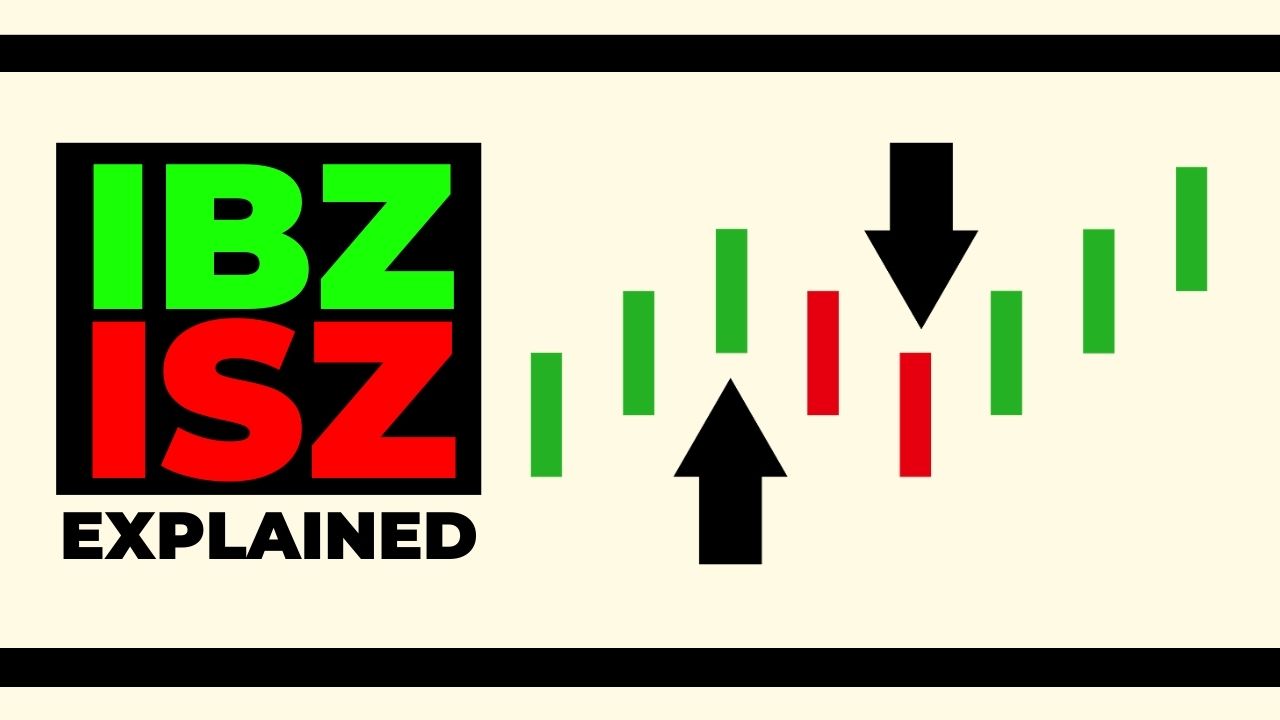
In the world of trading, two important concepts often used by traders are Institutional Buying Zones (IBZ) and Institutional Selling Zones (ISZ). These zones are closely linked to support and resistance levels on price charts. Understanding these concepts can help you create a more effective IBZ and ISZ trading strategy while avoiding potential pitfalls. So, let’s begin the lesson.
Table of Contents
What is IBZ in Trading?
IBZ simply means Institutional Buying Zone.
IBZ is a price range where large institutional investors, such as mutual funds or hedge funds, are likely to buy a stock in significant quantities.
These investors have the power to influence the market due to the large volumes they trade. When institutions buy, they typically do so at price levels where they believe the stock is undervalued or has strong potential to rise.
The IBZ is often identified as a support zone on a price chart. A support zone is a level where the price tends to stop falling and starts to rise. This happens because there is strong demand for the stock at that level. When institutions buy at these levels, it reinforces the support, making it harder for the price to drop below that zone.
For example, if a stock consistently finds buyers around ₹100, this level could be considered a support zone. If large institutions are buying at this price, it becomes an Institutional Buying Zone. Traders who recognize this zone may also buy, expecting the price to rise.
What is IBZ in Trading?
ISZ simply means Institutional Selling Zone.
ISZ is the opposite of an IBZ. It is a price range where large institutional investors are likely to sell off their holdings.
When these institutions decide to sell, it can lead to a decrease in the stock’s price due to the large volumes being offloaded.
The ISZ is often identified as a resistance zone on a price chart. A resistance zone is a level where the price tends to stop rising and starts to fall. This occurs because there is strong selling interest at that level. When institutions sell at these levels, it reinforces the resistance, making it difficult for the price to move higher.
For instance, if a stock consistently faces selling pressure around ₹150, this level could be considered a resistance zone. If large institutions are selling at this price, it becomes an Institutional Selling Zone. Traders who recognize this zone may decide to sell or avoid buying, expecting the price to fall.
How do IBZ and ISZ Relate to Support and Resistance?
Support and resistance levels are key concepts in technical analysis.
Support is a level where a stock’s price tends to find buying interest, preventing it from falling further.
Resistance is a level where the price tends to find selling interest, preventing it from rising further.
When we talk about IBZ and ISZ, we are essentially talking about support and resistance levels where large institutional players are involved. The involvement of these large players makes these zones even more significant.
IBZ as Support: When a stock enters an IBZ, it means that institutions are likely to buy the stock, creating a strong support level. This support level is where the price is less likely to fall below because of the high demand from these big players. Traders often look for buying opportunities in these zones, expecting the price to bounce back.
ISZ as Resistance: When a stock enters an ISZ, it indicates that institutions are likely to sell their holdings, creating a strong resistance level. This resistance level is where the price is less likely to rise above because of the strong selling pressure. Traders often look for selling opportunities in these zones, expecting the price to drop.
Understanding where IBZ and ISZ are on a price chart can be very useful in developing a trading strategy. Here are a few tips on how to use these zones effectively:
Identify the Zones: Look for these zones in higher time frames. Higher time frame support and resistance are basically IBZ and ISZ. Use technical analysis tools to identify potential IBZ and ISZ on your price chart.
Follow the Trend: If the overall trend is up, consider buying in the IBZ. If the trend is down, consider selling in the ISZ.
Watch for Confirmation: Before entering a trade, wait for confirmation that the price is respecting the IBZ or ISZ. This could be a reversal pattern or a strong price movement in the expected direction.
Manage Your Risk: Always set stop-loss orders to protect yourself from unexpected market movements. For example, if you buy in an IBZ, set your stop loss just below the support level.
Be Aware of False Breakouts: Sometimes, the price may temporarily break through a support or resistance level, only to return back. These are known as false breakouts. It’s important to confirm the breakout before taking action.
Conclusion
Understanding Institutional Buying Zones (IBZ) and Institutional Selling Zones (ISZ) can give you an edge in trading. By recognizing these zones as areas of strong support and resistance, you can make more informed decisions about when to buy or sell.
With over 3 years of experience in financial markets, we focus on simplifying global and Indian markets through clear, practical insights. Our expertise also extends to the evolving landscape of digital finance, including blockchain, stablecoins, and decentralized finance (DeFi).