SX40 is the flagship index of the Metropolitan Stock Exchange of India (MSEI).
With the news of the weekly expiry of the MSEI SX40 index going viral, many people are curious to look at the candlestick chart of the SX40 index.
Table of Contents
What is MSEI?
MSEI, also known as the Metropolitan Stock Exchange of India, is one of the major stock exchanges in India, alongside NSE (National Stock Exchange) and BSE (Bombay Stock Exchange).
Being less popular than NSE and BSE, MSEI has significantly lower liquidity compared to these two exchanges.
MSEI primarily facilitates trading in currency derivatives and debt instruments.
It has notably low liquidity in equity and equity derivatives.
MSEI is closely associated with MCX (Multi Commodity Exchange of India).
What is MSEI SX40 Index?
The SX40 is the main index of the Metropolitan Stock Exchange of India Limited. It is calculated based on the market value of stocks, considering only the shares available for public trading (free float).
To keep the index balanced:
- No single sector can make up more than 40% of the total index.
- Each sector can only include up to 10 stocks, and these stocks can’t contribute more than 25% of the total index.
How many Indices are there in MSEI?
Unlike NSE and BSE, the Metropolitan Stock Exchange of India (MSEI) currently has two indices:
- SX40 – This index includes the top 40 large-cap companies in India.
- SXBANK – This index represents the banking sector stocks.
What is the current price of MSEI SX40 index in India?
The current price of the MSEI SX40 index in India is 53,190.99.
SX40 Live Chart
As of now, there is no free resource available for a live SX40 chart. However, according to the MSEI SX40 Index factsheet, daily index values can be accessed on the MSE website. These values are also displayed by data vendors, as listed below:
| Sr. No | Data Feed Vendor | Index Code |
|---|---|---|
| 1 | Bloomberg | SX40 Index |
| 2 | Thomson Reuters | SX40 Index |
| 3 | Tickerplant | MCSX40 |
These vendors provide the SX40 index data for their users.
However, in our research, we couldn’t find the desired result. You may need to subscribe to access the index price data, but we are unsure about this.
How to find the SX40 chart on TradingView?
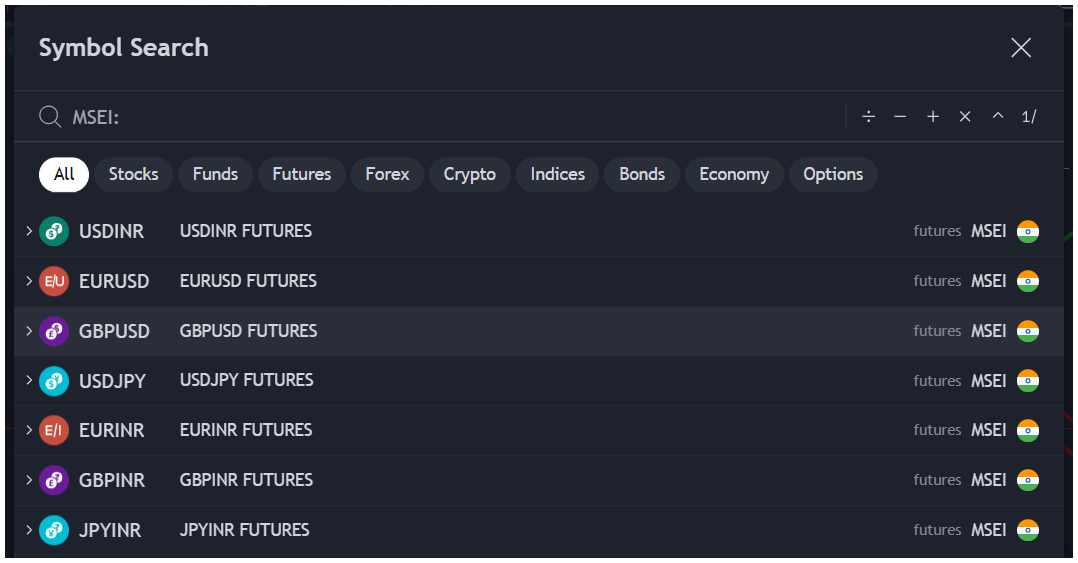
According to the TradingView blog, only currency derivative charts are available on TradingView at present.
To access the newly added currency derivatives data, open the symbol search and type the prefix “MSEI:” followed by the currency pair in the search field.

How to Find SX40 Candlestick Chart on Zerodha?
With the recent news about top brokers like Zerodha investing in the Metropolitan Stock Exchange of India (MSEI), there is a high chance that SX40 index derivative trading will soon become common on Zerodha. Increased participation in trading can benefit both the exchange and brokers by driving higher profits.
Currently, SX40 is not available for trading or charting on Zerodha. However, according to discussions on Zerodha’s forum, a team member hinted that the SX40 index and its derivatives might be introduced on the platform soon. This development is highly anticipated by traders looking to explore new opportunities.

When the SX40 index chart becomes available on the Zerodha platform, you will be notified right here on our website. Make sure to enable notifications to stay updated with the latest news and updates from us.
Learn More About the Metropolitan Stock Exchange of India (MSEI).
What is the New Weekly Expiry Day for SX40?
The weekly expiry day has now been shifted to Friday.
What is the New Lot Size for SX40?
The lot size for SX40 index derivatives has been updated to 40.

