
Palantir Technologies (ticker: PLTR) has been on a powerful upward run, drawing strong attention from both retail and institutional investors. The stock’s rally isn’t just a product of hype – it’s backed by solid business developments, expanding contracts, and a decisive technical breakout.
Let’s break down the six major reasons why Palantir is soaring in November 2025, with both fundamental and technical insights.
1. Revenue Explosion in U.S. Commercial Business
Palantir’s U.S. commercial segment jumped 121% year-over-year to US$397 million, with a 29% sequential growth. Moreover, the company’s remaining performance obligations (RPO) surged by 66% to US$2.6 billion, signaling a robust pipeline of future revenue.
2. Q2 2025 Revenue Up 48% and Full-Year Outlook Raised
Palantir’s Q2 results stunned the market with 48% year-over-year growth, pushing quarterly revenue past US$1 billion. The company also raised its full-year revenue outlook to US$4.14–4.15 billion, up from the previous guidance of around US$3.91 billion.
3. U.S. Army Enterprise Agreement Worth Up to US$10 Billion
A massive win came when Palantir secured a U.S. Army enterprise contract valued up to US$10 billion over 10 years. This agreement consolidates several previous deals into a single, scalable framework.
4. Strategic Partnership in Nuclear Energy Sector
Palantir recently partnered with The Nuclear Company to develop and deploy NOS, an AI-driven real-time software system designed for nuclear plant construction and operations. The announcement pushed PLTR shares to record highs.
5. NATO Acquisition of Palantir’s Maven Smart System
In a major milestone, NATO acquired Palantir’s Maven Smart System, an advanced AI platform designed for defense intelligence and decision-making. The deal was completed in just six months, which is unusually fast for defense procurement.
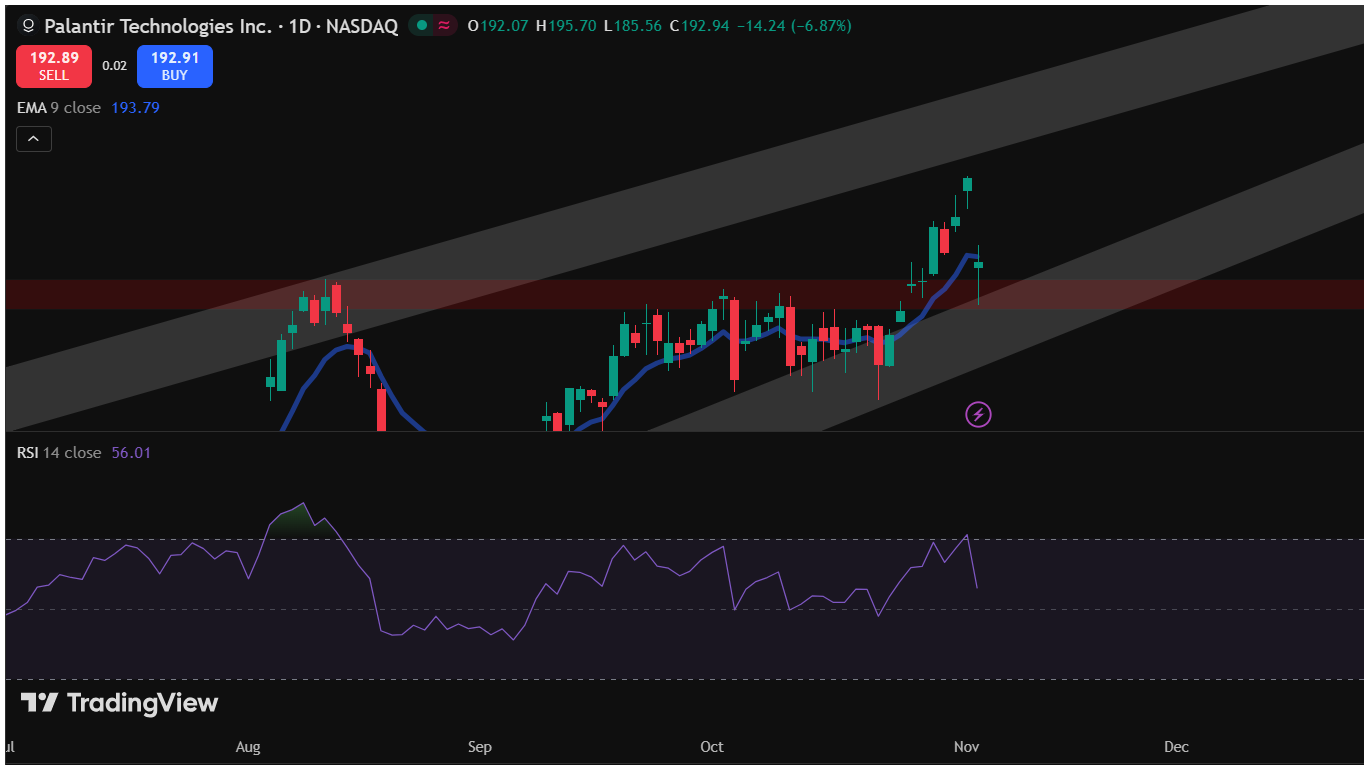
6. Technical Breakout Above the 184–190 Resistance Zone
Beyond the fundamentals, technical indicators confirm bullish momentum. PLTR has broken out above the 184–190 resistance zone, which had previously acted as a strong supply area. Post-breakout, the stock has sustained higher highs and strong volume confirmation, signaling institutional buying.

The breakout above the 184–190 range represents a shift from accumulation to expansion.
Also Read – 3 Important Differences Between Cryptography and Blockchain
Technical Analysis for November 2025
Palantir has been in a strong bull run since 2023, and the long-term chart continues to reflect this steady momentum.

If we analyze the yearly trend, it’s clear that the stock has maintained higher highs and higher lows, supported by sustained institutional demand. However, for the ongoing rally to stay healthy, a retracement may be necessary – allowing bulls to accumulate at more efficient buying zones below current levels.

- Timeframe: 1 Week (Weekly Candles)
Palantir’s price action shows a clear long-term uptrend within a rising parallel channel. Both the upper and lower boundaries of this channel have been well respected for several months, confirming a disciplined bullish structure.
- The current weekly candle shows some bearish pressure near the upper boundary, signaling mild profit booking or short-term exhaustion. Despite the pause, the broader trend remains decisively upward.
As of writing, PLTR is trading above the 9 EMA on the weekly timeframe.
In summary, Palantir continues to trade within a structurally bullish channel, but minor corrections are expected as part of normal trend behavior.
Support & Resistance Levels
| Level Type | Zone (USD) | Technical Context |
|---|---|---|
| Immediate Resistance | $205–$210 | Upper trendline + recent rejection zone |
| Immediate Support | $180–$185 | Midline support + EMA confluence |
| Major Channel Support | $160–$165 | Lower channel trendline (long-term support) |
These levels indicate that any retracement toward $180–$185 could present a high-probability accumulation area, as it aligns with both the mid-channel and the dynamic EMA zone.
A weekly close below the EMA could trigger a short-term correction, possibly toward the midline of the channel around $180.
Also Read – Circle Internet Group Monthly Outlook- November 2025 Technical Analysis
This article is for informational purposes only and should not be considered financial advice. Investing in stocks, cryptocurrencies, or other assets involves risks, including the potential loss of principal. Always conduct your own research or consult a qualified financial advisor before making investment decisions. The author and publisher are not responsible for any financial losses incurred from actions based on this article. While efforts have been made to ensure accuracy, economic data and market conditions can change rapidly. The author and publisher do not guarantee the completeness or accuracy of the information and are not liable for any errors or omissions. Always verify data with primary sources before making decisions.