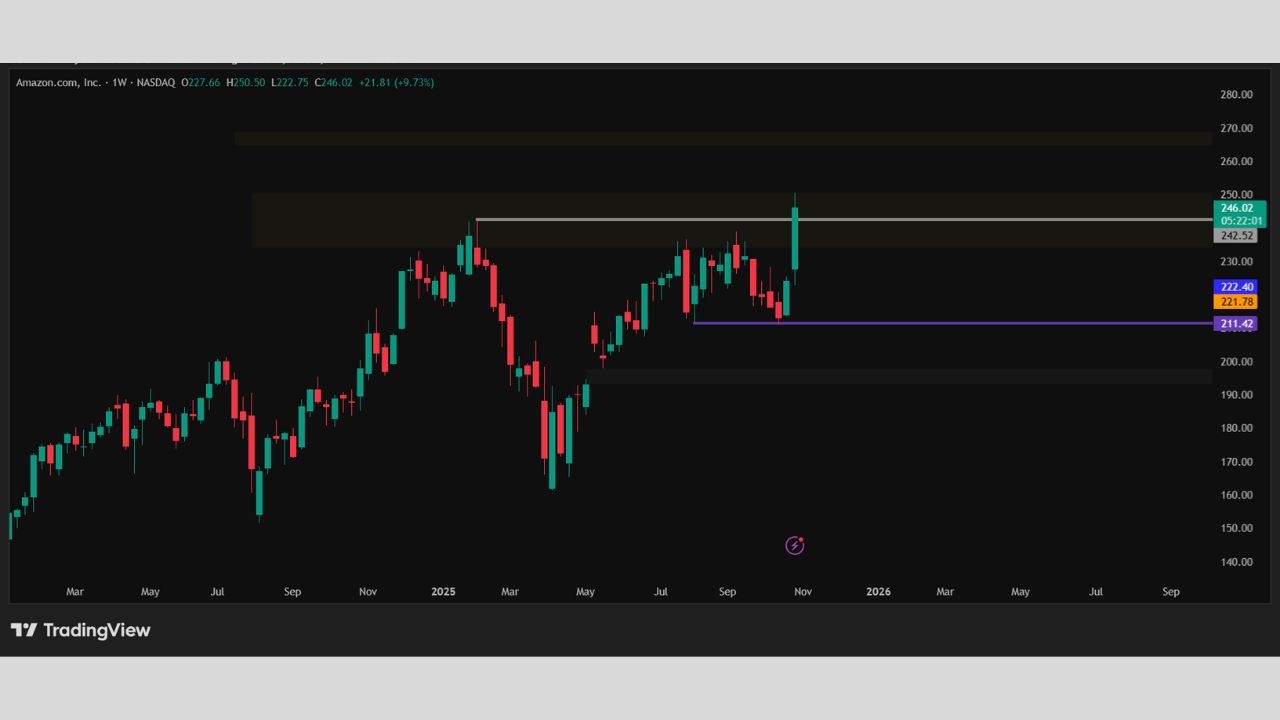
Amazon (NASDAQ: AMZN) reported third-quarter results for the period ended September 30, 2025. Revenue came in at $180.2 billion, up about 13% year-over-year, and EPS was $1.95, comfortably above expectations. The quarter was driven by a strong Amazon Web Services showing with roughly 20% year-over-year growth.
The market cheered the print and Amazon stock opened with a big gap higher, rising roughly 12–13% on the earnings reaction.
1. Introduction & company snapshot
Company profile. Amazon is a global e-commerce and cloud computing company. Its core businesses are online retail, third-party marketplace services, subscription services (Prime), digital advertising, and Amazon Web Services (AWS), the company’s cloud platform. Amazon operates across consumer retail, cloud, digital media, logistics, and advertising.
Primary sector: Technology / Consumer Discretionary with large exposure to cloud computing and digital advertising.
Recent performance (context). Over the last quarter Amazon lagged some peers but showed accelerating cloud growth in this report. The earnings beat and strong AWS growth produced the sharp post-earnings gap up of about 12–13% which pushed the stock to fresh highs. That gap is the immediate context for the technical read below.
Latest news highlights (top items).
- Q3 revenue $180.2B and EPS $1.95.
- AWS grew about 20% year over year.
- Company signaled materially higher capital expenditures tied to AI and data center expansion.
- Amazon disclosed workforce reductions of about 14,000 corporate roles as part of cost actions.
- Management gave a Q4 revenue guide range that investors will monitor for sustainability of the momentum.
Analyst sentiment- The immediate analyst reaction was broadly positive. Several firms raised estimates and price targets after the AWS beat and the AI investment signal. That shift is one reason the market moved aggressively higher. Specific recent price target moves differ by firm so check the broker notes you follow for exact numbers.
2. Fundamental analysis – company financial health
Key financials (Q3 2025).
- Revenue: $180.2 billion.
- EPS: $1.95.
- AWS contribution: fastest cloud growth since 2022 at about 20% y/y.
Valuation notes. Amazon’s market cap expanded meaningfully on the rally. With an earnings beat and higher profitability this quarter the trailing and forward P/E will change quickly as analyst estimates update. For actionable valuation comparisons use the latest consensus EPS and shares outstanding from the IR site or your data provider.
Special holdings. Not applicable in the sense of material crypto treasuries. Amazon’s earnings are driven by its operating businesses and investment gains including some non-operating gains disclosed in the release.
3. Technical analysis – what the charts are saying
Below I fold your technical observations into a structured TA narrative with cleaned grammar and clarity.

Monthly trend (big picture). The monthly chart shows a strong uptrend that accelerated after this earnings beat and gap higher. The new all-time highs mean prior resistance levels are now the reference for support on any retracement. The long term trend is bullish while also structurally vulnerable to sharp mean reversion because large gaps and vertical moves often attract profit taking.
Short term (daily / weekly). The weekly RSI is 64.84, which is below the overbought threshold but indicates firm bullish momentum. Weekly momentum is positive. The daily action after the gap shows a rapid run higher with thin consolidation. That type of move often creates “retail froth” near the highs which can fail without a healthy pullback.
Key levels to watch
- Immediate resistance: 264–268. This is the near term supply zone to watch on any rally.
- Gap zone: 193–197. Gaps often act as magnets and support or resistance. The 193–197 gap is a logical area where price may revisit.
- Support band: 170–178 is identified as strong support.
- Retracement target range you proposed: 206–189 as the zone where the price may retrace to allow “big bulls” to build positions at more efficient prices.
These levels create a short term map: if price holds above the 193–197 gap and reclaims 206 quickly then bullish momentum can resume. If the gap fills and 170–178 remains intact then the long term uptrend stays valid. If 170 breaks then the risk profile shifts materially.
50 EMA / 200 EMA relationship. After a gap that takes price to new highs the 50 EMA will trail above the 200 EMA and remain bullish until a crossing occurs. Monitor any acceleration of moving averages as a confirmation or a warning sign.
Volume. The earnings session saw high volume and conviction. Future volume on pullbacks will tell whether the move is a healthy consolidation or a distribution. Higher volume on down moves would warn that the run may be topping.
Chart patterns. The rapid breakout to ATH with little resistance suggests a spike top risk and a higher probability of at least a moderate retracement. Look for reversal candlestick patterns and increased selling volume near resistance to signal weakness.
Also Read – Fed Interest Rates vs Gold Prices
4. Market sentiment & volatility
Social media and retail sentiment. After the beat social chatter turned exuberant on X and Reddit. That elevated retail enthusiasm increases the chance of a short term pullback as newer buyers chase the move.
Investor sentiment & macro. The broader market is sensitive to AI and cloud narratives. Positive AI signals and durable cloud growth create a favorable macro tailwind for Amazon relative to broader cyclicals.
Implied volatility. IV spiked into earnings and usually declines afterward. Elevated option IV means the market expects bigger moves in the near term. Traders using options should account for premium decay if IV compresses from here.
5. Forecast & conclusion – September outlook and trade-map
Probabilities and scenario framing.
- Base case (highest probability given current structure). A pullback into the 206–189 zone to clear retail froth and let institutional buyers scale in.
- Bull case. Price holds above the 193–197 gap and reclaims 264–268 resistance. Continued AWS strength and positive guidance push price higher.
- Bear case. The gap fills and price breaks 170–178 support. That would invalidate the near term bullish thesis and open larger downside.
Targets and watchlist. Use the support and resistance zones above as intra-month targets. Watch volume and day-session price action immediately after the gap. Pay attention to management language on capex and AI. Continued robust AWS updates are the single largest fundamental tailwind for a sustained rally.
Final verdict for September. Given the sharp gap up and the retail froth around the highs it is reasonable to expect a retracement into the 206–189 zone in November before the bulls can establish a stronger and more sustainable base. This is a probability view not a certainty.
This analysis is for educational purposes only. It is not investment advice. We do not provide buy or sell recommendations. The analysis may be incorrect. Always do your own due diligence and consult a licensed financial professional before acting.
This article is for informational purposes only and should not be considered financial advice. Investing in stocks, cryptocurrencies, or other assets involves risks, including the potential loss of principal. Always conduct your own research or consult a qualified financial advisor before making investment decisions. The author and publisher are not responsible for any financial losses incurred from actions based on this article. While efforts have been made to ensure accuracy, economic data and market conditions can change rapidly. The author and publisher do not guarantee the completeness or accuracy of the information and are not liable for any errors or omissions. Always verify data with primary sources before making decisions.

