Last Updated: June 24, 2025, 2:46 PM ET
Circle Internet Group Inc. (NASDAQ: CRCL) thrilled markets on Monday, closing up 9.64% at $263.45, a gain of $23.17 from the previous session. The stock surged nearly 25% intraday, touching a high of $298.99, before swiftly retreating 12% from its peak. With pre-market trading pointing to a modest – 1.27% dip at 260.10, one question remains to be answered that Is a correction toward $200 inevitable?
Latest Article – 4 Reasons Circle (CRCL) Stock is Crashing
Fiserv Partnership Ignites Rally
The day’s dramatic move was catalyzed by Fiserv’s (NASDAQ: FI) announcement of a strategic partnership with Circle to develop stablecoin-powered financial tools. The fintech giant also revealed plans to launch its own stablecoin, FIUSD, by year-end – leveraging Circle’s infrastructure alongside Paxos.
Also Read – CRCL’s USDC & FI’s FIUSD – The Stablecoin Business Model Everyone Should Understand
This news comes on the heels of the U.S. Senate passing a federal regulatory framework for stablecoins, a move expected to mainstream digital dollar alternatives and provide legal certainty for companies like Circle. The one-two punch of regulatory clarity and enterprise adoption sent CRCL shares soaring.
CRCL’s 750% Run Since IPO
Since its IPO on June 5, 2025, at $31 per share, CRCL has delivered a jaw-dropping +749.84% return – crushing the S&P 500’s modest 2.44% year-to-date gain. The company’s reach spans stablecoin issuance (via USDC), AI infrastructure, and early-stage tech investing, drawing attention from retail traders and institutional funds alike.
| Market Cap | $63.9 Billion |
| Trailing P/E | 3,020 |
| Price/Sales (TTM) | 31.02 |
| Price/Book (MRQ) | 78.70 |
| EV/Revenue | 30.59 |
| EV/EBITDA | 197.04 |
These metrics suggest premium pricing, even by high-growth tech standards, and indicate heightened downside risk if growth expectations are not met.
Technical Outlook: Is Volatility Here to Stay?

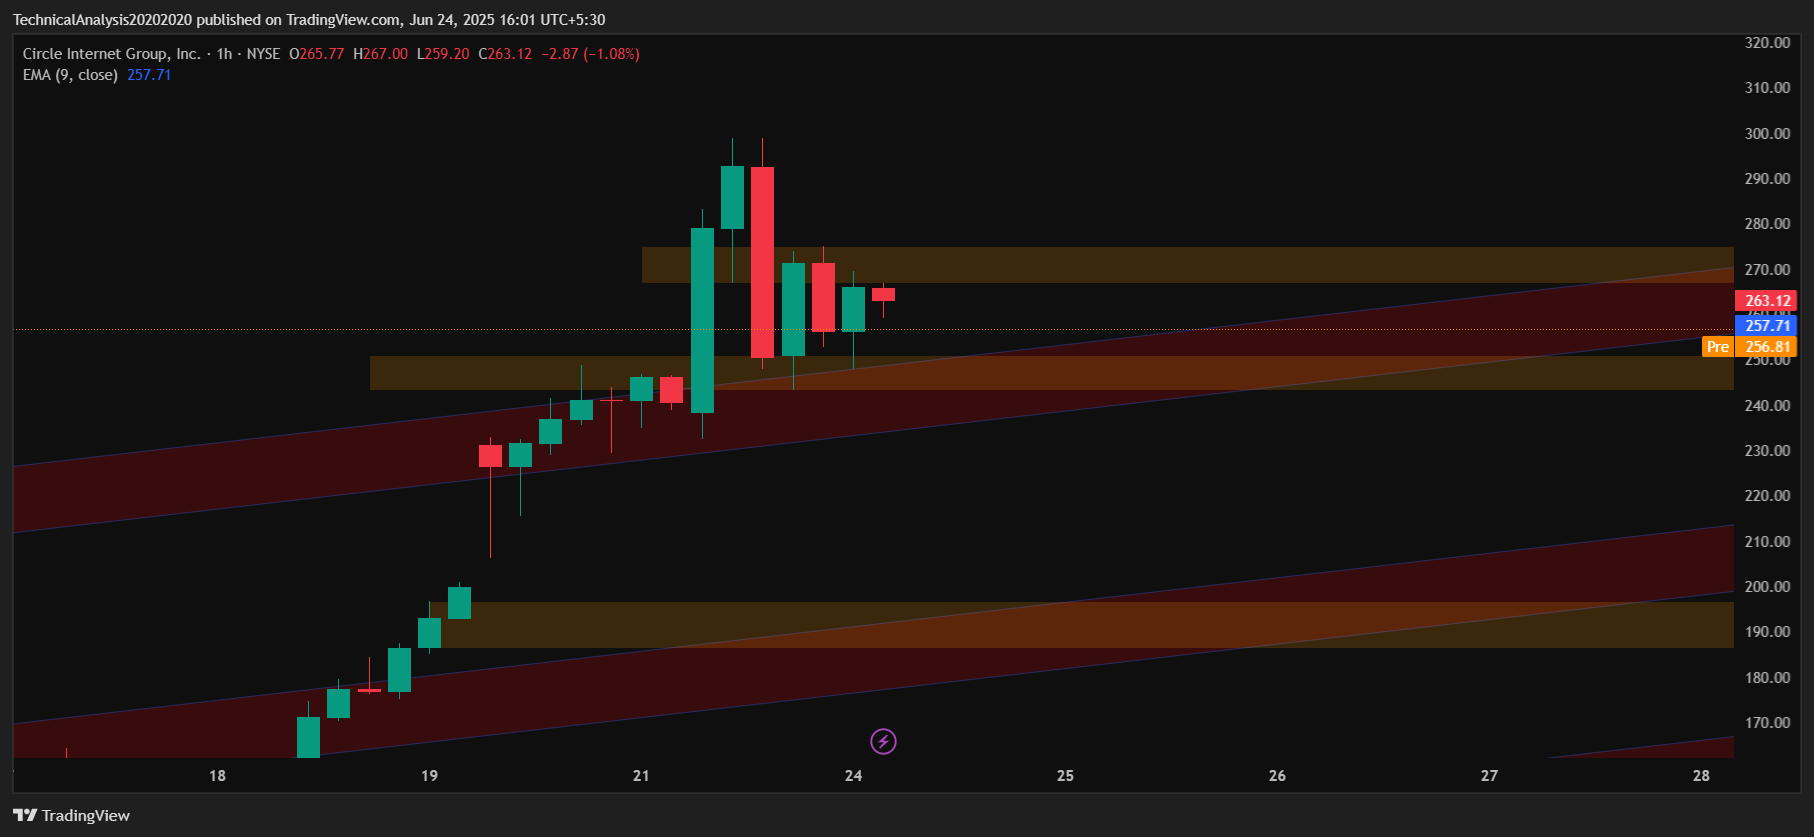
Monday’s trading range, from $232.48 to $298.99, underscored the volatility dominating CRCL. The inability to hold above $295 suggests heavy profit-taking near resistance.
Currently, CRCL is range-bound between $250 and $270. If the crucial support level of $250 is breached, the stock may crash with a high probability, potentially falling toward $200.
Conversely, if CRCL breaks and sustains above the $270 zone, it may resume its upward rally.
This analysis is based on technical analysis using candlestick chart price action.
However, the fundamentals tell a different story. With such an elevated P/E ratio, the stock appears overheated and may require a correction to slow down and trade closer to its mean valuation.
Also Read – USDC vs. RLUSD vs. USDT – Key Differences and Why They Matter
CRCL vs. S&P 500: A Performance Breakdown
| Period | CRCL Return | S&P 500 Return |
|---|---|---|
| YTD | +749.84% | +2.44% |
| 1-Year | +749.84% | +10.26% |
| 3-Year | +749.84% | +58.74% |
| 5-Year | +749.84% | +92.42% |
The stock has dramatically outpaced the broader market, but history shows such parabolic moves often correct sharply.
What’s Next for Circle?
Despite short-term volatility, Circle’s fundamentals remain solid. It remains the primary issuer behind USDC, the second-largest stablecoin, and is expanding aggressively into institutional and fintech partnerships. The Fiserv deal and the anticipated FIUSD stablecoin launch further cement Circle’s role in the digital finance space.
Also Read – 6 Must-Know Things About DeFi in 2025
Still, the elevated valuation and fast-paced gains introduce caution for new entrants.
Investors should monitor:
- Key Support Zones: $210–$190 could provide a technical floor.
- Catalysts: More partnerships or global adoption of USDC may reignite buying.
- Macro Sentiment: Crypto and fintech sector moves will influence the stock.
This article is for informational purposes only and should not be considered financial advice. Investing in stocks, cryptocurrencies, or other assets involves risks, including the potential loss of principal. Always conduct your own research or consult a qualified financial advisor before making investment decisions. The author and publisher are not responsible for any financial losses incurred from actions based on this article. While efforts have been made to ensure accuracy, economic data and market conditions can change rapidly. The author and publisher do not guarantee the completeness or accuracy of the information and are not liable for any errors or omissions. Always verify data with primary sources before making decisions
Dawson Blake is a financial markets expert with over 10 years of experience, focusing mainly on stock market news and price movements. He aims to become a top-tier authority in curating stock news content that readers can trust as their go-to source for market information. Dawson enjoys breaking down market activity, company updates, and daily trends to help investors stay informed and make smarter financial decisions. His writing is simple, clear, and designed to make the stock market easy to follow for everyone.

