Opendoor Technologies Inc. (NASDAQ: OPEN) is once again on investors’ radar, posting significant gains and leading the charge among the day’s most active stocks. As a trailblazer in the iBuying sector, Opendoor’s recent momentum is grabbing attention – and for good reason.
Latest Market Snapshot
At the time of writing, Opendoor Technologies Inc. (OPEN) is trading at $3.60, up a robust 11.80% for the session. The stock opened at $3.21 and has ranged between $3.13 and $3.71 so far today, climbing from a previous close of $3.22. With a market capitalization near $2.65 billion and today’s trading volume already topping 199 million shares, investor interest is undeniable.
For the trailing twelve months, Opendoor has reported revenues of $5.18 billion – though the company remains unprofitable, recording a net loss of approximately $305 million (EPS: -$0.43). The stock’s 52-week range of $0.508 to $4.97 underscores its volatility and recent upward momentum.
So, what’s behind this renewed surge in Opendoor shares?
Here are the five key factors every investor should watch:
1. Strong Q3 2024 Earnings Results
Opendoor surpassed expectations in its recent Q3 2024 report, showcasing improved operational efficiency and narrowed losses. Management’s focus on cost controls and better unit economics is restoring faith in the company’s long-term model.
2. Housing Market Recovery Signs
Signs of stronger housing demand are emerging, as the Federal Reserve hints at potential interest rate cuts and affordability shows incremental improvements. This macro environment could accelerate home transactions and play directly into Opendoor’s strengths.
3. Technology and AI Advancements
Tech is at the core of Opendoor’s edge. Robust investments in artificial intelligence and machine learning are enhancing pricing accuracy and operational workflows, helping the company make smarter buying decisions and minimize holding costs.
4. Market Share Expansion
Opendoor is pressing its advantage with aggressive expansion into new and existing real estate markets. This broader geographic reach is capturing a greater share of total transaction volume and fueling growth prospects.
5. Institutional Investor Interest
The smart money is paying attention: notable hedge funds and institutional players have increased their positions in Opendoor, signaling professional confidence in the company’s recovery and future growth trajectory.
This article is for informational purposes only and should not be considered financial advice. Investing in stocks, cryptocurrencies, or other assets involves risks, including the potential loss of principal. Always conduct your own research or consult a qualified financial advisor before making investment decisions. The author and publisher are not responsible for any financial losses incurred from actions based on this article. While efforts have been made to ensure accuracy, economic data and market conditions can change rapidly. The author and publisher do not guarantee the completeness or accuracy of the information and are not liable for any errors or omissions. Always verify data with primary sources before making decisions.
Bullish Inc., one of the leading digital assets platforms in the United States, made its public debut on the New York Stock Exchange on August 13, 2025. The IPO was priced at $37 per share, valuing the company at $5.4 billion.
On its first trading day, Bullish (BLSH) stock opened at $90 on the New York Stock Exchange, a 143% surge above its IPO price of $37, reflecting strong investor interest in blockchain-powered financial services. The stock peaked at $118 during the day before closing at $68, a gain of more than 83% from the IPO price.
At the time of writing, BLSH is trading in the post-market session at $70.39, up 3.51% from its regular session close.
Bullish raised $1.1 billion through the offering of 30 million shares, marking another sign of mainstream adoption in a crypto sector that has recently crossed the $4 trillion mark in total market value.
Following its listing, the company’s market capitalization moved beyond its IPO valuation, underscoring optimism for future growth. The debut also comes as several other crypto-focused firms, including Gemini and Grayscale, have confidentially filed to go public, signaling a rising wave of digital asset companies entering public markets.
Notably, Bullish acquired cryptocurrency news outlet CoinDesk in 2023, strengthening its industry presence and media influence.
Sector & Industry Analysis
The digital asset and blockchain sector has witnessed significant volatility but also massive expansion opportunities. With over $4 trillion in total market capitalization, the sector has become a serious contender in global finance.
However, the sector remains sensitive to regulatory risks, security threats, and market cycles. Sudden policy changes or extended bear markets in crypto can heavily impact revenues. Competition is also fierce, with established exchanges, fintech giants, and decentralized platforms all vying for market share.
The Bullish Opportunity
Bullish enters public markets at a pivotal time for the digital assets industry. Institutional adoption is accelerating, regulatory frameworks are slowly becoming clearer, and blockchain technology is increasingly integrated into traditional financial systems. The company’s core business model revolves around offering secure, high-liquidity trading for digital assets while bridging the gap between decentralized platforms and regulated financial markets.
Growth drivers include the widespread adoption of tokenized assets, the rise of institutional-grade trading infrastructure, and clearer compliance pathways in major economies. For Bullish, these factors could translate into a growing user base and higher transaction volumes.
The proceeds from the IPO are expected to be used for technology expansion, regulatory licensing, and global market penetration. This positions Bullish to potentially become a dominant player in a market still in its early growth phase.
Bullish Stock Price Forecast for 2030
Predicting an exact price for Bullish in 2030 is impossible, but we can make reasoned scenarios based on current fundamentals and industry trends.
Bullish Case – If the company captures a significant share of institutional digital asset trading, maintains revenue growth above 20% annually, and avoids regulatory setbacks, the stock could trade between $95 and $120 by 2030.
Base Case – With steady growth, moderate adoption, and rising competition, a price range of $70 to $85 is more realistic.
Bearish Case – If regulatory challenges mount or the company struggles to scale, the stock could retreat to $40–$50.
How Investors Should Approach?
Rather than fixating on a specific 2030 price target, investors should track:
Quarterly revenue and profitability trends
Growth in active users and transaction volumes
Progress in securing regulatory licenses in key markets
Competitive positioning against major exchanges
The long-term investment case for Bullish will depend on its ability to remain profitable, innovative, and compliant in an evolving industry.
Lessons from the Past – Why Caution Is Necessary?
While Bullish’s IPO performance is encouraging, history offers examples of companies that soared early only to face sharp declines later.
CRCL stock, once a market favorite, fell more than 48% from its all-time high. Similarly, Figma saw its valuation crash after an initially strong IPO.
These cases illustrate a critical point – fundamentals ultimately drive sustainable price performance, and technical momentum or early hype can quickly fade if earnings and market share fail to grow.
This article is for informational purposes only and should not be considered financial advice. Investing in stocks, cryptocurrencies, or other assets involves risks, including the potential loss of principal. Always conduct your own research or consult a qualified financial advisor before making investment decisions. The author and publisher are not responsible for any financial losses incurred from actions based on this article. While efforts have been made to ensure accuracy, economic data and market conditions can change rapidly. The author and publisher do not guarantee the completeness or accuracy of the information and are not liable for any errors or omissions. Always verify data with primary sources before making decisions.
The latest Consumer Price Index (CPI) report, released by the U.S. Bureau of Labor Statistics (BLS) on August 12, 2025, indicates a continued cooling of inflationary pressures. The all-items CPI, often referred to as headline inflation, rose by 2.7% on a year-over-year (YoY) basis in July, unchanged from the previous month’s rate. On a month-over-month (MoM) basis, prices increased by 0.2%.
This data reflects ongoing progress toward the Federal Reserve’s 2% inflation target, down from peaks above 9% in 2022, though some underlying pressures persist.
Understanding the Key Metrics
The CPI measures the average change in prices paid by urban consumers for a basket of goods and services.
CPI-U: The Consumer Price Index for All Urban Consumers is the broadest and most commonly cited measure of inflation, covering about 93% of the U.S. population. It includes a wide range of expenses, from food and housing to transportation and medical care.
Core CPI: This version removes volatile food and energy prices to give a clearer picture of underlying inflation trends. In July, Core CPI rose by 3.1% YoY, showing that while headline inflation is moderating, prices for goods and services outside food and energy remain a factor.
Breakdown of Major Categories
Category
MoM Change
YoY Change
Notes
Shelter (Housing)
+0.2%
+3.7%
Remains a major driver of core inflation due to lingering rent and homeownership costs
Food
0.0%
+2.2%
Food at home dipped slightly (-0.1% MoM) but overall stable
One of the hotter areas, reflecting higher repair and claim costs
Core (ex-food/energy)
+0.3%
+3.1%
Shows stickier inflation in non-volatile items
While some areas like energy are cooling, others like housing and insurance are keeping costs elevated for many households.
Comparison to Expectations and Trends
The July data largely met economists’ expectations, with headline CPI in line at 2.7% YoY and 0.2% MoM. However, core CPI came in slightly higher than anticipated (3.1% YoY vs. a forecasted 3.0%), signaling that underlying inflation is not cooling as quickly as hoped.
Inflation has been on a downward trajectory since mid-2022, but the pace has slowed recently, with rates hovering around 2.7–3.0% over the past few months.
How CPI is Calculated
The CPI data is released every month and is a statistical estimate based on a weighted average of prices.
The BLS collects around 80,000 price quotes monthly from retail stores and service establishments. These prices are compared on both a month-over-month and year-over-year basis.
The YoY comparison is generally considered more reliable for tracking long-term trends, as it removes seasonal fluctuations. For example, comparing July 2025’s prices to July 2024’s provides a more stable view than comparing July to June, which might be influenced by seasonal demand.
Implications for Everyday People and the Economy
Moderating inflation means your purchasing power is not eroding as quickly. Groceries, gas, and other essentials might stabilize or even drop in some cases. With headline inflation at 2.7%, closer to the Fed’s 2% goal, there is growing expectation for interest rate cuts soon, which could make borrowing cheaper for homes, cars, or credit cards.
However, sticky core inflation (driven by shelter and services) suggests challenges remain, especially for renters facing higher housing costs or drivers dealing with rising insurance premiums. Overall, this report is positive for economic stability but underscores the need to monitor categories that affect daily life.
CPI’s Influence on Federal Reserve Policy and Stock Markets
The CPI plays a pivotal role in shaping monetary policy and financial markets.
The Federal Reserve, the U.S. central bank, adjusts interest rates to achieve its dual mandate of maximum employment and stable prices. When inflation runs high, the Fed raises rates to cool the economy by making borrowing more expensive, reducing spending and investment. Conversely, when inflation moderates, as in the July report, the Fed may cut rates to stimulate growth by lowering borrowing costs, encouraging business expansion and consumer spending.
July’s CPI data, with headline inflation steady at 2.7% and core at 3.1%, has fueled market bets on a September rate cut, easing fears of tariff-driven spikes and increasing the odds of 75 basis points of cuts in the final three Fed meetings of 2025. While the slight uptick in core inflation may not halt cuts, it highlights the need for ongoing vigilance.
For U.S. stock markets, CPI data is significant because it signals potential Fed actions that directly impact valuations. Lower-than-expected inflation boosts investor confidence in rate cuts, leading to rallies as cheaper borrowing supports corporate profits and economic expansion.
High inflation readings, however, could prompt rate hikes, pressuring stocks by increasing costs and reducing growth prospects.
CPI often acts as a barometer for market sentiment, with softer data sparking broad gains in equities.
This article is for informational purposes only and should not be considered financial advice. Investing in stocks, cryptocurrencies, or other assets involves risks, including the potential loss of principal. Always conduct your own research or consult a qualified financial advisor before making investment decisions. The author and publisher are not responsible for any financial losses incurred from actions based on this article. While efforts have been made to ensure accuracy, economic data and market conditions can change rapidly. The author and publisher do not guarantee the completeness or accuracy of the information and are not liable for any errors or omissions. Always verify data with primary sources before making decisions.
Figma, Inc. (NYSE: FIG) – the popular design software company – made headlines with its blockbuster IPO on July 31, 2025. The stock jumped by 250% on its debut day, rising from its issue price of $33 to close at $115.50. At its peak, Figma’s valuation touched nearly $60 billion.
However, just four trading sessions later, after reaching an intraday peak of $142.91, the stock dropped significantly to $79 by August 5, 2025 – a 45% slide from its peak.
This sharp correction has made investors ask one key question – Why is Figma’s stock dropping?
Here are five possible reasons behind this sudden drop:
1. Post-IPO Profit-Taking
Figma’s IPO saw overwhelming demand, with subscriptions exceeding 40 times the available shares. This demand pushed the stock to an intraday high of $142.91. However, once trading began, early investors and institutions quickly started booking profits.
Only 7% of the company’s shares were available for trading (free float), making the stock more volatile. In such cases, even modest selling can trigger sharp price swings. This is a classic example of a “buy the hype, sell the news” pattern, often seen in popular tech IPOs.
2. Overvaluation Concerns
After its debut, Figma was trading at a forward price-to-sales (P/S) ratio of over 60x. For context:
Microsoft trades at about 14.1x
Datadog trades near 17.8x
What is Price-to-Sales (P/S)? It’s a metric used to compare a company’s stock price with its sales. A high P/S means investors are paying a premium for every dollar of revenue – which is only justified if the company grows rapidly and profitably.
Even after dropping to $79, Figma’s valuation still looks expensive when compared to its peers. While it grew revenue by 46% year-over-year, some investors are questioning whether that’s enough to support such a high price.
3. Competitive Pressures and AI Disruption
Figma is a market leader in design software with over 40% market share, serving major clients like Google and Netflix. However, the company’s IPO filing mentioned increasing competition, especially from AI-powered design tools.
Startups like Lovable and Bolt are using generative AI to create design systems more efficiently. Meanwhile, giants like Canva and Microsoft are expanding their presence by integrating design tools into existing software platforms.
Some tech analysts believe AI could even replace traditional design tools, allowing developers to convert code directly into designs. Figma has launched Figma Make to stay ahead, but investor concerns about its long-term competitive edge may be weighing on the stock.
4. Macro Market Turbulence
Figma’s decline is also linked to wider market conditions. Around the same time, the NASDAQ Composite and other tech-heavy indices experienced notable pullbacks, driven by:
Uncertainty over President Trump’s tariff policies
A general sell-off in high-growth tech stocks
Even though Figma’s business remains strong, the timing of its listing overlapped with broader negative investor sentiment in tech. As a result, it may have been caught in a sector-wide correction.
5. Looming Insider Selling Pressure
A major concern for investors is the upcoming expiration of the IPO lock-up period, set for January 2026. Currently, most of Figma’s shares are held by insiders, including venture firms like Sequoia Capital and Index Ventures, whose stakes are collectively worth around $24 billion.
Although insiders cannot sell now, the fear of future selling often pushes current investors to exit early- adding psychological pressure to the stock.
If a large number of shares are released into the market when the lock-up ends, it could increase supply significantly, putting downward pressure on prices.
Despite Figma’s correction, the overall IPO market remains very active in 2025. So far, 123 tech companies have gone public, raising a total of $19.7 billion, which is 48% higher than last year.
But investors seem to be becoming more cautious and selective. They’re still excited about new listings – but only when valuations are seen as reasonable and the growth story is convincing.
Figma’s 250% debut-day gain was historic, but the subsequent 45% drop is a reminder that post-IPO volatility is common, especially in richly valued tech stocks.
This article is for informational purposes only and should not be considered financial advice. Investing in stocks, cryptocurrencies, or other assets involves risks, including the potential loss of principal. Always conduct your own research or consult a qualified financial advisor before making investment decisions. The author and publisher are not responsible for any financial losses incurred from actions based on this article. While efforts have been made to ensure accuracy, economic data and market conditions can change rapidly. The author and publisher do not guarantee the completeness or accuracy of the information and are not liable for any errors or omissions. Always verify data with primary sources before making decisions.
Cayman Islands-based Bullish, a global digital asset platform backed by billionaire investor Peter Thiel, announced the launch of its initial public offering (IPO) roadshow on August 4, 2025, aiming to raise up to $724 million. The company has applied to list its shares on the New York Stock Exchange (NYSE) under the ticker symbol “BLSH”, marking a significant step in bridging the crypto and traditional financial markets.
The IPO includes an offer of 20.3 million ordinary shares in a price range of $28 to $31 per share, potentially raising $629.3 million at the top end. Bullish has also granted underwriters a 30-day option to purchase up to an additional 3.045 million shares, which could add $94.4 million in proceeds, bringing the total potential raise to $723.7 million (rounded to $724 million).
This is an Offer for Sale (OFS), meaning the proceeds will go to existing shareholders rather than the company itself. However, Bullish noted that the funds may still support “general corporate purposes,” including potential acquisitions.
The company operates a regulated spot and derivatives exchange in Germany, Hong Kong, and Gibraltar, focusing on institutional-grade liquidity. Bullish also owns CoinDesk, a leading crypto media brand, and provides market indices and data services through its CoinDesk Indices and CoinDesk Data divisions.
The offering is being led by J.P. Morgan, Jefferies, and Citigroup, and taps into growing institutional interest in regulated crypto infrastructure – similar to recent listings by players like Circle.
Bullish has filed a Form F-1 with the U.S. Securities and Exchange Commission (SEC). The offering is subject to market conditions and regulatory approval.
If fully subscribed, Bullish could be valued at around $4.23 billion, positioning BLSH as a potential bellwether for crypto on Wall Street.
Bullish’s IPO reflects crypto’s ongoing push into mainstream financial markets. As the roadshow unfolds, final terms will be determined, making this one of the most closely watched IPOs in the digital asset space this year.
This article is for informational purposes only and should not be considered financial advice. Investing in stocks, cryptocurrencies, or other assets involves risks, including the potential loss of principal. Always conduct your own research or consult a qualified financial advisor before making investment decisions. The author and publisher are not responsible for any financial losses incurred from actions based on this article. While efforts have been made to ensure accuracy, economic data and market conditions can change rapidly. The author and publisher do not guarantee the completeness or accuracy of the information and are not liable for any errors or omissions. Always verify data with primary sources before making decisions.
Figma Inc. (NYSE: FIG) went public on July 31, 2025, pricing at $33 and raising approximately $1.22 billion by selling around 36.94 million shares. Demand was enormous – oversubscribed about 40×.
The stock opened at $85, hit an intraday high of around $124.63 (nearly +277%), and closed at $115.50, representing a 250% gain and boosting Figma’s market capitalization to roughly $67 billion by day’s end. This sets a new record for U.S. IPOs raising over $500 million.
The stock is trading at $127 in pre-market at the time of writing, up 9.96% from yesterday’s closing price of $115.50.
Financially, Figma’s Q1 2025 revenue was $228.2 million, up 46% year-over-year, with net income of $44.9 million. It reported 13 million monthly active users and claimed usage by ~95% of Fortune 500 companies. At its IPO price, the valuation was $19.3 billion, comparable to the previously proposed $20 billion acquisition by Adobe – an earlier deal terminated due to regulatory concerns in late 2023. Figma received a $1 billion breakup fee from Adobe.
Circle Internet Group (CRCL) IPO: A Crypto Counterpoint
Circle, issuer of the USDC stablecoin, launched its IPO on June 5, 2025, pricing at $31, raising around $1.1 billion, and oversubscribed approximately 25×. It opened near $69, closed the first day at $83.23 (a 168% gain), and hit $123.49 the next day (~300% gain), before trading near $150+ within weeks.
Figma’s IPO action is somewhat similar to the CRCL IPO launched in 2025, which also raised over $1 billion and had a strong debut and investor craze. Both IPOs were significantly oversubscribed, reflecting strong market demand during the 2025 tech IPO resurgence.
Adobe’s IPO: Perspective from the 1980s
Adobe Systems went public on August 20, 1986. Its split-adjusted IPO price was around $0.17, closing at $0.22, a modest ~29% gain. In contrast to Figma’s dramatic trajectory, Adobe’s debut was more restrained, reflecting different market dynamics in the 1980s. Adobe eventually grew to a behemoth – $158 billion market cap – through gradual expansion via its software suite.
Adobe’s failed bid to acquire Figma in 2022 highlights the shift: Figma’s standalone valuation post-IPO (~$67 billion) significantly surpasses the scuttled deal value, underscoring the company’s modern strength.
Figma vs. Circle vs. Adobe: Summary Table
Metric
Figma (FIG)
Circle (CRCL)
Adobe (1986)
IPO Price
$33
$31
~$0.17 (split-adjusted)
First-Day % Gain
~250% (closed $115.50)
~168% (closed $83.23)
~29%
Peak Intraday Gain
~277%
~300%+ (two-day high ~$123)
—
Capital Raised
~$1.22 billion
~$1.1 billion
Small, modest float
Oversubscription
~40×
~25×
Nan
Revenue Model
SaaS (Design platform)
Stablecoin interest/reserves
Traditional software sales
Can Figma’s Rally Persist?
Drivers That Support Continued Momentum
Massive demand & tight float: The 40× oversubscription and limited share supply sustained the initial pop.
Strong fundamentals: Reliable revenue base, significant MBU growth (~13 M users), and major enterprise penetration (~95 % of Fortune 500) provide a stable foundation.
AI powered innovation: Launch of tools like Figma Make, Dev Mode, Figma Sites, and Buzz provide differentiation in AI-enhanced design workflows.
IPO market revival: Figma joins a string of successful tech IPOs in 2025, signalling renewed investor appetite.
Risks That Could Trim Gains
High valuation: The ~$67 billion cap equates to ~11× next‒twelve-months revenue – premium for SaaS.
Lock‑up expiry: Around 180 days post-IPO (~late January 2026), insider sales could increase supply and pressure prices.
Competitive dynamics: Adobe’s entrenched position and emerging AI-backed design offerings could challenge growth.
This article is for informational purposes only and should not be considered financial advice. Investing in stocks, cryptocurrencies, or other assets involves risks, including the potential loss of principal. Always conduct your own research or consult a qualified financial advisor before making investment decisions. The author and publisher are not responsible for any financial losses incurred from actions based on this article. While efforts have been made to ensure accuracy, economic data and market conditions can change rapidly. The author and publisher do not guarantee the completeness or accuracy of the information and are not liable for any errors or omissions. Always verify data with primary sources before making decisions.
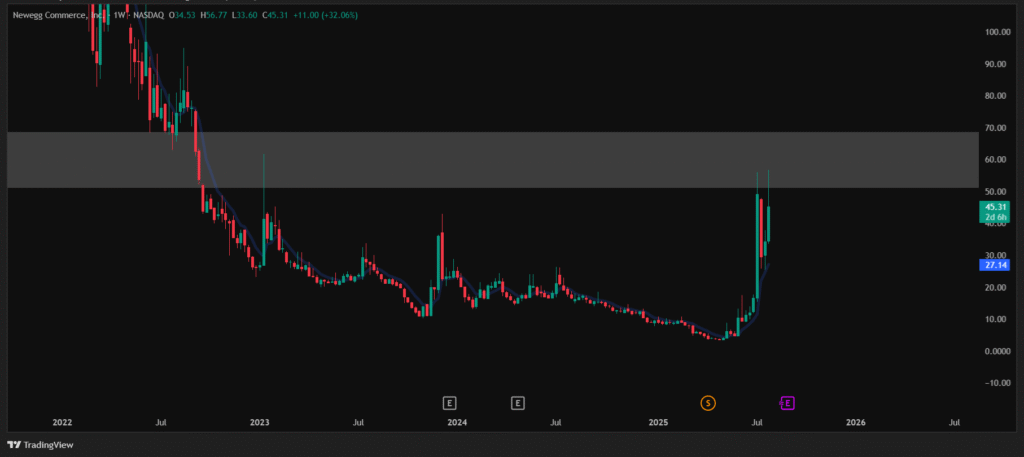
Newegg Commerce Inc. (NEGG) stock shocked retail investors today with a sharp drop of nearly 20%, falling from an opening price of $46.98 to an intraday low of $41.01, before stabilizing slightly. After a powerful rally in recent weeks, this sudden crash has raised many questions in the minds of traders and long-term investors.
Let’s take a closer look at the 4 most likely reasons behind today’s fall:
1. Selling Pressure from the $55 Supply Zone
One of the most probable technical reasons for NEGG’s sharp fall is strong selling pressure from the supply zone around $55. The stock recently touched a high of $56.77, which falls right into this zone.
Historically, NEGG had formed a crucial support in the $50–$60 range. But after it broke down from this range earlier, the same zone has now turned into a resistance. As the stock retraced back to that level with a parabolic structure, it gave swing traders and short-term holders the perfect chance to sell and exit.
This kind of resistance-based selling is common after vertical rallies, especially in stocks with high volatility like NEGG.
2. Parabolic Rally Followed by Exhaustion
NEGG had been consolidating for a long time, and once it broke out, the movement was nothing short of parabolic. But when stocks rise too fast, they often run out of momentum just as quickly.
This rally lacked consistent volume spikes or major news-based triggers. So, when the price reached overextended levels, exhaustion selling kicked in – driven by both retail and institutional traders trying to book profits before a possible correction.
3. Broader Market and Sector Rotation
The internet retail sector as a whole has seen some weakness recently. Even large-cap players have faced pressure due to mixed earnings and slower e-commerce growth projections.
In such a scenario, speculative or mid-cap retail stocks like NEGG tend to fall faster, especially when overall investor sentiment turns cautious.
Investors are also rotating money into safer sectors such as energy, utilities, or dividend-yielding assets-leaving tech and e-commerce under pressure.
4. No New Fundamental Trigger to Sustain the Rally
While there was buzz around insider buying, and a temporary momentum spike followed it, there’s been no concrete news related to revenue growth, partnerships, or new launches from the company.
That means the recent rally was largely speculation-driven, and when such stocks don’t follow up with strong news or numbers, they often face sharp corrections – just like we saw today.
What Next for NEGG?
Even though the fall was sharp, some traders still believe NEGG could move higher in the coming weeks. But the path may not be easy. Given the past price behavior, expect a bumpy ride with ups and downs along the way.
The stock will likely face strong resistance in the $50–$55 range again, and unless there’s a solid fundamental trigger, the rally might remain limited.
This article is for informational purposes only and should not be considered financial advice. Investing in stocks, cryptocurrencies, or other assets involves risks, including the potential loss of principal. Always conduct your own research or consult a qualified financial advisor before making investment decisions. The author and publisher are not responsible for any financial losses incurred from actions based on this article. While efforts have been made to ensure accuracy, economic data and market conditions can change rapidly. The author and publisher do not guarantee the completeness or accuracy of the information and are not liable for any errors or omissions. Always verify data with primary sources before making decisions.
Dawson Blake is a financial markets expert with over 10 years of experience, focusing mainly on stock market news and price movements. He aims to become a top-tier authority in curating stock news content that readers can trust as their go-to source for market information. Dawson enjoys breaking down market activity, company updates, and daily trends to help investors stay informed and make smarter financial decisions. His writing is simple, clear, and designed to make the stock market easy to follow for everyone.
The “No Tax on Overtime” provision, part of the recently passed One Big Beautiful Bill Act (H.R. 1), is making headlines for its potential to increase take-home pay for millions of American workers. Signed into law by President Trump on July 4, 2025, the bill eliminates federal income tax on overtime earnings and tips for qualifying individuals starting January 1, 2025.
This article explains how the bill works, who qualifies, and what changes workers and employers should expect.
What Is the “No Tax on Overtime” Bill?
The “No Tax on Overtime” proposal grants a federal income tax deduction for overtime pay, targeting non-exempt employees under the Fair Labor Standards Act (FLSA). These workers typically receive time-and-a-half for hours worked beyond 40 in a workweek. The provision is a key part of H.R. 1, also known as the One Big Beautiful Bill, spearheaded by the GOP and endorsed by President Donald Trump.
The bill includes provisions for a deduction of up to $12,500 for single filers and $25,000 for joint filers on eligible overtime income. These deductions apply to tax years 2025 through 2028 and phase out for individuals earning over $150,000 and couples over $300,000 annually.
A separate bill, the Overtime Pay Tax Relief Act of 2025 (H.R. 561), proposed a partial deduction capped at 20% of wages, but it has not passed. Similarly, Senate Bill S. 1046, which proposed a full exemption, was not incorporated into the final version of H.R. 1.
Importantly, while overtime pay becomes exempt from federal income tax, FICA taxes (Social Security and Medicare) still apply.
What Is the “One Big Beautiful Bill”?
Passed by the House on May 22, re-approved on July 3, and cleared by the Senate on July 1, 2025, with Vice President JD Vance casting the deciding vote, the One Big Beautiful Bill Act is a sweeping tax and budget reform law. It delivers several key campaign promises from the 2024 Trump campaign, including:
No federal income tax on tips and overtime
A deduction for certain Social Security income (not a full exemption)
An extension of the 2017 Tax Cuts and Jobs Act provisions
Auto loan interest deductibility
Adjustments to Medicaid and border security spending
Republican lawmakers, including House Ways and Means Chairman Jason Smith, call it the largest tax cut in U.S. history. However, nonpartisan estimates from the Tax Policy Center and Tax Foundation suggest the total cost could reach $3 to $5 trillion over the next decade, with concerns over the potential deficit impact and inequities in the tax code.
How Will the Bill Affect Your Paycheck?
Eligible workers will begin earning tax-free overtime starting January 1, 2025, but changes in paycheck withholding may not occur immediately. The IRS is expected to update federal withholding tables by 2026. Until then, employees will need to claim the deduction when filing their 2025 tax returns in early 2026.
To illustrate the impact:
A worker earning $20 per hour, who works 10 overtime hours weekly at $30/hour, earns $300 in weekly overtime – or $15,600 annually. At a 22% tax bracket, this worker currently pays around $3,432 in federal income tax on that amount. Under the new law, up to $12,500 of that can be deducted, reducing federal income tax liability by about $2,750, depending on their tax situation.
However, Social Security (6.2%) and Medicare (1.45%) taxes will still apply, reducing net savings somewhat.
Employers are required to separately track and report overtime earnings on W-2 forms. Payroll systems will need updating, and HR departments should prepare to explain these changes to employees. Note that state income taxes will still apply unless states pass their own exemptions (Alabama, for instance, has one expiring in June 2025).
Are Tips Included?
Yes. The no tax on tips provision allows eligible workers to deduct up to $25,000 in tip income per year ($50,000 for joint filers), subject to the same income thresholds and time limits (2025–2028). This applies to:
Employees (e.g., restaurant servers, salon workers)
Gig workers and independent contractors who receive qualified tips
Again, while tips are exempt from federal income tax, they remain subject to FICA taxes, and the deduction does not apply to non-cash tips or service charges.
Employers must report tips separately on W-2s. Independent contractors must track tips for Form 1099-NEC or 1099-K. Critics argue that this could lead to administrative burdens and even “tip inflation” or classification abuse by businesses.
When Does No Tax on Overtime Start?
The law takes effect for taxable years beginning January 1, 2025, and applies through December 31, 2028, unless extended by Congress.
Although the bill is now signed into law, most workers will only notice the benefit when filing their 2025 tax returns in early 2026. The IRS is expected to issue revised withholding guidance by late 2025 or early 2026.
Employers and payroll providers should begin tracking eligible income streams—overtime and tips—separately to ensure compliance with W-2 reporting standards and support accurate tax filings.
Has the Bill Been Passed?
Yes. The No Tax on Overtime and No Tax on Tips provisions are now law under the One Big Beautiful Bill, signed by President Trump on July 4, 2025. The Senate approved the package by a 51–50 vote on July 1, with the House concurring on July 3. IRS implementation guidance is expected in the coming months.
Frequently Asked Questions (FAQ)
Is overtime currently taxed in the U.S.?
Yes. Before 2025, overtime pay is taxed like regular wages—federal income tax, Social Security, and Medicare apply. Starting in 2025, federal income tax will no longer apply to qualifying overtime income, but FICA taxes remain.
Who qualifies?
Non-exempt workers earning less than $160,000 (or $300,000 for joint filers) with a valid Social Security number qualify. Highly compensated employees and independent contractors are not eligible for the overtime tax break.
Will part-time workers benefit?
Only if they work more than 40 hours in a week and are classified as non-exempt under the FLSA. Most part-timers won’t see significant changes.
What’s in the Overtime Tax Relief?
The bill provides an annual deduction on overtime earnings: $12,500 for individuals, $25,000 for joint filers, phasing out beyond $150,000/$300,000. It does not eliminate all taxes on overtime—payroll taxes still apply.
Do states offer similar exemptions?
Most states do not. Alabama implemented a temporary exemption through June 2025, and others like Connecticut and Delaware are considering similar measures. Federal law does not override state income tax unless states act independently.
Conclusion
The No Tax on Overtime and No Tax on Tips provisions are now officially part of U.S. tax law, promising real benefits for hourly and tipped workers. Although full withholding changes may not show up in paychecks until 2026, the law retroactively applies to all qualifying income from January 1, 2025. Employers and workers alike should prepare now by tracking income accurately and consulting tax professionals to maximize savings.
This article is for informational purposes only and should not be considered financial advice. Investing in stocks, cryptocurrencies, or other assets involves risks, including the potential loss of principal. Always conduct your own research or consult a qualified financial advisor before making investment decisions. The author and publisher are not responsible for any financial losses incurred from actions based on this article. While efforts have been made to ensure accuracy, economic data and market conditions can change rapidly. The author and publisher do not guarantee the completeness or accuracy of the information and are not liable for any errors or omissions. Always verify data with primary sources before making decisions.
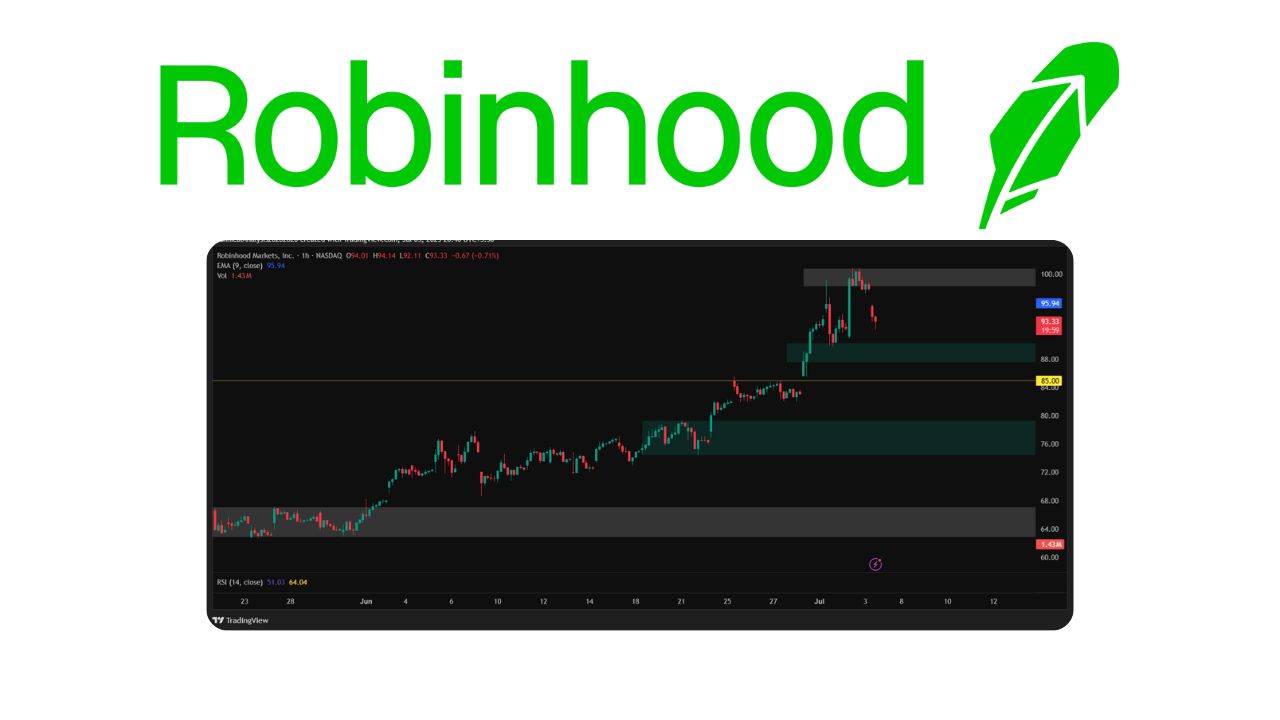
Shares of Robinhood Markets Inc (NASDAQ: HOOD) declined sharply Thursday morning, trading at $94.21, down $3.77 or 3.85% as of 10:24 AM ET. The stock is reversing after a high-profile rally, pressured by fresh doubts and technical resistance.
Why Is Robinhood Falling?
OpenAI Denial Hits Tokenized Shares Sentiment
Robinhood shares had initially surged after the company launched tokenized shares for private giants like OpenAI and SpaceX, promoting the products as a way for retail investors to access Silicon Valley startups via blockchain.
However, OpenAI quickly issued a strong statement on X, denying any partnership with Robinhood, clarifying that it had never authorized any transfer of its equity, and explicitly rejecting any endorsement of these offerings. That swift denial rattled market confidence and triggered a rapid reversal from fresh highs.
HOOD: Technical Outlook for July 2025
Robinhood had broken its all-time high of $85 on June 25, closing above it on June 30, and touched $100 for the first time on July 2. This move encouraged profit booking by traders.
Now, price action shows a double-top pattern forming around the $100 mark, which could continue to pressure the stock unless it breaks out decisively above that resistance. If Robinhood fails to hold support near $89.70, the next support area could be in the $74–79 zone, followed by a stronger level between $62–67 if selling deepens.
On the hourly timeframe, the Relative Strength Index (RSI) is near 50, indicating the stock is still far from oversold territory.
The company holds a market capitalization of $82.87 billion with a trailing price-to-earnings ratio of 53.90 and earnings per share of $1.75. Robinhood’s next earnings announcement is expected on July 30, 2025. Year to date, the stock has surged 153.17%, far outperforming the S&P 500’s gain of 6.63%. Over one year, Robinhood is up 312.10% versus the S&P 500’s 13.27%, and its three-year return is an impressive 1,053.18% compared to the broader index’s 63.95%. Over the past five years, Robinhood has gained 148.24%, modestly outpacing the S&P 500’s 100.37%.
This article is for informational purposes only and should not be considered financial advice. Investing in stocks, cryptocurrencies, or other assets involves risks, including the potential loss of principal. Always conduct your own research or consult a qualified financial advisor before making investment decisions. The author and publisher are not responsible for any financial losses incurred from actions based on this article. While efforts have been made to ensure accuracy, economic data and market conditions can change rapidly. The author and publisher do not guarantee the completeness or accuracy of the information and are not liable for any errors or omissions. Always verify data with primary sources before making decisions.
Dawson Blake is a financial markets expert with over 10 years of experience, focusing mainly on stock market news and price movements. He aims to become a top-tier authority in curating stock news content that readers can trust as their go-to source for market information. Dawson enjoys breaking down market activity, company updates, and daily trends to help investors stay informed and make smarter financial decisions. His writing is simple, clear, and designed to make the stock market easy to follow for everyone.
Figma, the widely used cloud-based collaborative design platform, has officially filed for its highly anticipated initial public offering (IPO), capturing significant attention among technology investors. While this article does not make a buy or sell recommendation, it provides eight critical factors you should weigh before deciding whether Figma’s IPO fits your investment goals.
1. IPO Date, Listing Timeline, and Exchange Details
Figma filed its S-1 registration with the U.S. Securities and Exchange Commission (SEC) on July 1, 2025, confirming plans to list on the New York Stock Exchange under the ticker symbol FIG. Industry analysts suggest the IPO will take place in late summer or early fall 2025, possibly as early as August if the SEC review progresses smoothly.
Trading for FIG shares will occur during normal NYSE hours (9:30 AM–4:00 PM ET), with pre-market (4:00 AM–9:30 AM ET) and after-hours (4:00 PM–8:00 PM ET) trading potentially available through certain brokers.
Advantage: The NYSE listing brings high liquidity and investor trust.
Risk: SEC approval delays could push the listing into September or beyond.
2. IPO Price, Valuation, and Market Cap
Figma has not yet disclosed the specific IPO share price or offering size in its S-1. However, the company was valued at $12.5 billion during a 2024 private tender transaction. Analysts expect a public valuation in the range of $15 billion to $20 billion, depending on pricing and demand.
Industry sources, including Renaissance Capital, estimate the IPO could raise as much as $1.5 billion, making it one of 2025’s most significant technology IPOs alongside other big names such as CoreWeave. The final market capitalization will be determined by the share price and total shares outstanding, which will be updated closer to the listing date.
Advantage: A strong valuation reflects robust investor interest and confidence in the company’s business model.
Risk: High valuations carry downside if growth momentum slows post-IPO, potentially leading to share price corrections.
3. How and Where to Buy IPO Shares?
If you wish to participate in Figma’s IPO at the offering price, you will need to work through underwriters such as Morgan Stanley, Goldman Sachs, J.P. Morgan, or Allen & Co. Typically, these allocations are reserved for institutional clients and high-net-worth individuals, though some brokers – for example, Fidelity, Charles Schwab, or Robinhood – might offer limited retail IPO allocations.
For most retail investors, buying will be easier once FIG begins public trading on the NYSE. Like all IPOs, oversubscription is possible, which could mean limited availability for retail investors at the initial price.
Advantage: Multiple reputable brokerages may participate, expanding accessibility.
Risk: Retail buyers could face allocation challenges or higher prices if demand is very strong on day one.
4. S-1 Filing Details and Financials
Figma’s S-1 filing reveals a company with compelling growth metrics and a sharp turnaround in profitability:
2024 Revenue: $749 million, a 48% increase from 2023
Q1 2025 Revenue: $228.2 million, a 46% jump year-over-year
Rolling 12-month revenue (as of March 2025): $821 million
Gross Margin: A standout 91%
Q1 2025 Net Income: $44.9 million, compared to $13.5 million the previous year
2024 Net Loss: $732 million, largely from a one-time stock-based compensation expense
Cash and Equivalents: $1.54 billion
Debt: Minimal, consisting mostly of a revolving credit facility
Enterprise Customers: 78% of Forbes 2000 companies, with over 1,000 clients generating more than $100,000 in annual recurring revenue
According to its filing, IPO proceeds will fund global expansion, research in artificial intelligence, and selective acquisitions.
Advantage: Strong revenue growth, improving profitability, and a solid cash reserve.
Risk: High stock-based compensation expenses could weigh on future earnings, depending on how aggressively Figma continues to incentivize employees.
5. Business Model and Competitive Advantages
Figma runs on a subscription-based SaaS model, providing design and collaboration tools through the cloud to individuals, businesses, and large enterprises. Unlike traditional desktop software, its browser-based platform allows real-time teamwork.
Competitive advantages include:
95% adoption rate among Fortune 500 companies
132% net dollar retention, reflecting upsell success
76% of Fortune 500 customers use multiple Figma products
85% of monthly users located internationally
Generative AI tools, including partnerships with Adobe Firefly and third-party AI models
Competition includes: Adobe, Canva, Sketch, and InVision, as well as new players leveraging AI such as Anthropic or tools developed by OpenAI.
Advantage: Market leadership with strong lock-in through collaborative features and sticky customers.
Risk: Emerging AI-native competitors could challenge Figma’s market share.
6. Leadership and Ownership
Founded in 2012 by Dylan Field and Evan Wallace, Figma remains founder-led, with Field as CEO. He is widely credited with pushing its collaborative-first design model and expanding its AI capabilities.
Major shareholders include:
Index Ventures: 16.8%
Greylock: 15.7%
Kleiner Perkins: 14%
Sequoia Capital: 8.7%
Cumulatively, Figma has raised around $749 million across several funding rounds involving top-tier Silicon Valley investors.
Advantage: Visionary founder leadership, with respected and experienced backers.
Risk: Heavy dependence on Field’s strategic direction could be a weakness if leadership transitions are needed in the future.
7. Crypto Exposure and USDC Holdings
In an unusual twist for a design company, Figma reported in its S-1 that it holds approximately $69.5 million in Bitcoin ETFs (specifically, the Bitwise Bitcoin ETF) and another $30 million in USDC stablecoins, which it plans to convert to Bitcoin.
While this allocation is small compared to its cash reserves, it signals a forward-looking approach to treasury management, similar to moves by Tesla or Block.
Advantage: Diversification of assets could enhance returns over time.
Risk: Exposure to cryptocurrency volatility and potential regulatory scrutiny around digital assets.
8. Broader Investment Considerations: Risks, Opportunities, and Sentiment
Opportunities:
Figma has strong revenue growth and world-class gross margins.
A customer base of 13 million monthly active users, with two-thirds outside the design profession, creates future upsell opportunities.
Ongoing investment in AI features positions Figma to adapt to rapidly evolving design workflows.
Risks:
Fierce competition from Adobe, Canva, and newer AI-native design apps
Heavy R&D spending (over $750 million in 2024, largely in stock-based compensation)
Exposure to crypto market swings, though small, could unsettle conservative investors
Lofty valuations could face corrections if macroeconomic or sector-specific headwinds emerge
Market sentiment so far is cautiously optimistic, with pre-IPO commentary on social media platforms like X showing excitement about its 132% net dollar retention, profitability turnaround, and high user stickiness.
Expert analysts at Renaissance Capital have expressed bullish projections for the IPO, while some caution that valuations above $15 billion might be aggressive if the tech sector weakens.
Timing considerations: IPOs often trade with high volatility in the first 30 to 90 days. Some investors prefer to wait for a post-lock-up period (commonly 90–180 days) before initiating a position, as early employees and insiders become eligible to sell.
Conclusion
Figma’s IPO represents one of the most significant SaaS opportunities of 2025, showcasing robust growth, profitability improvements, and dominant market share in the collaborative design space. Its dual focus on AI-driven innovation and a proven subscription business model gives it an enviable position relative to many rivals.
However, the combination of intense competition, a possibly high valuation, and modest but nontrivial crypto exposure should caution even growth-oriented investors.
Ultimately, whether Figma is “worth it” depends on your personal risk tolerance, IPO pricing, and a careful reading of the S-1 and subsequent SEC updates. Monitoring institutional demand, short interest, and broader tech-sector sentiment will also be important in the weeks before the IPO. Investors should consider consulting a qualified financial advisor to match this opportunity with their portfolio objectives.
This article is for informational purposes only and should not be considered financial advice. Investing in stocks, cryptocurrencies, or other assets involves risks, including the potential loss of principal. Always conduct your own research or consult a qualified financial advisor before making investment decisions. The author and publisher are not responsible for any financial losses incurred from actions based on this article. While efforts have been made to ensure accuracy, economic data and market conditions can change rapidly. The author and publisher do not guarantee the completeness or accuracy of the information and are not liable for any errors or omissions. Always verify data with primary sources before making decisions.
Dawson Blake is a financial markets expert with over 10 years of experience, focusing mainly on stock market news and price movements. He aims to become a top-tier authority in curating stock news content that readers can trust as their go-to source for market information. Dawson enjoys breaking down market activity, company updates, and daily trends to help investors stay informed and make smarter financial decisions. His writing is simple, clear, and designed to make the stock market easy to follow for everyone.

")
")


")