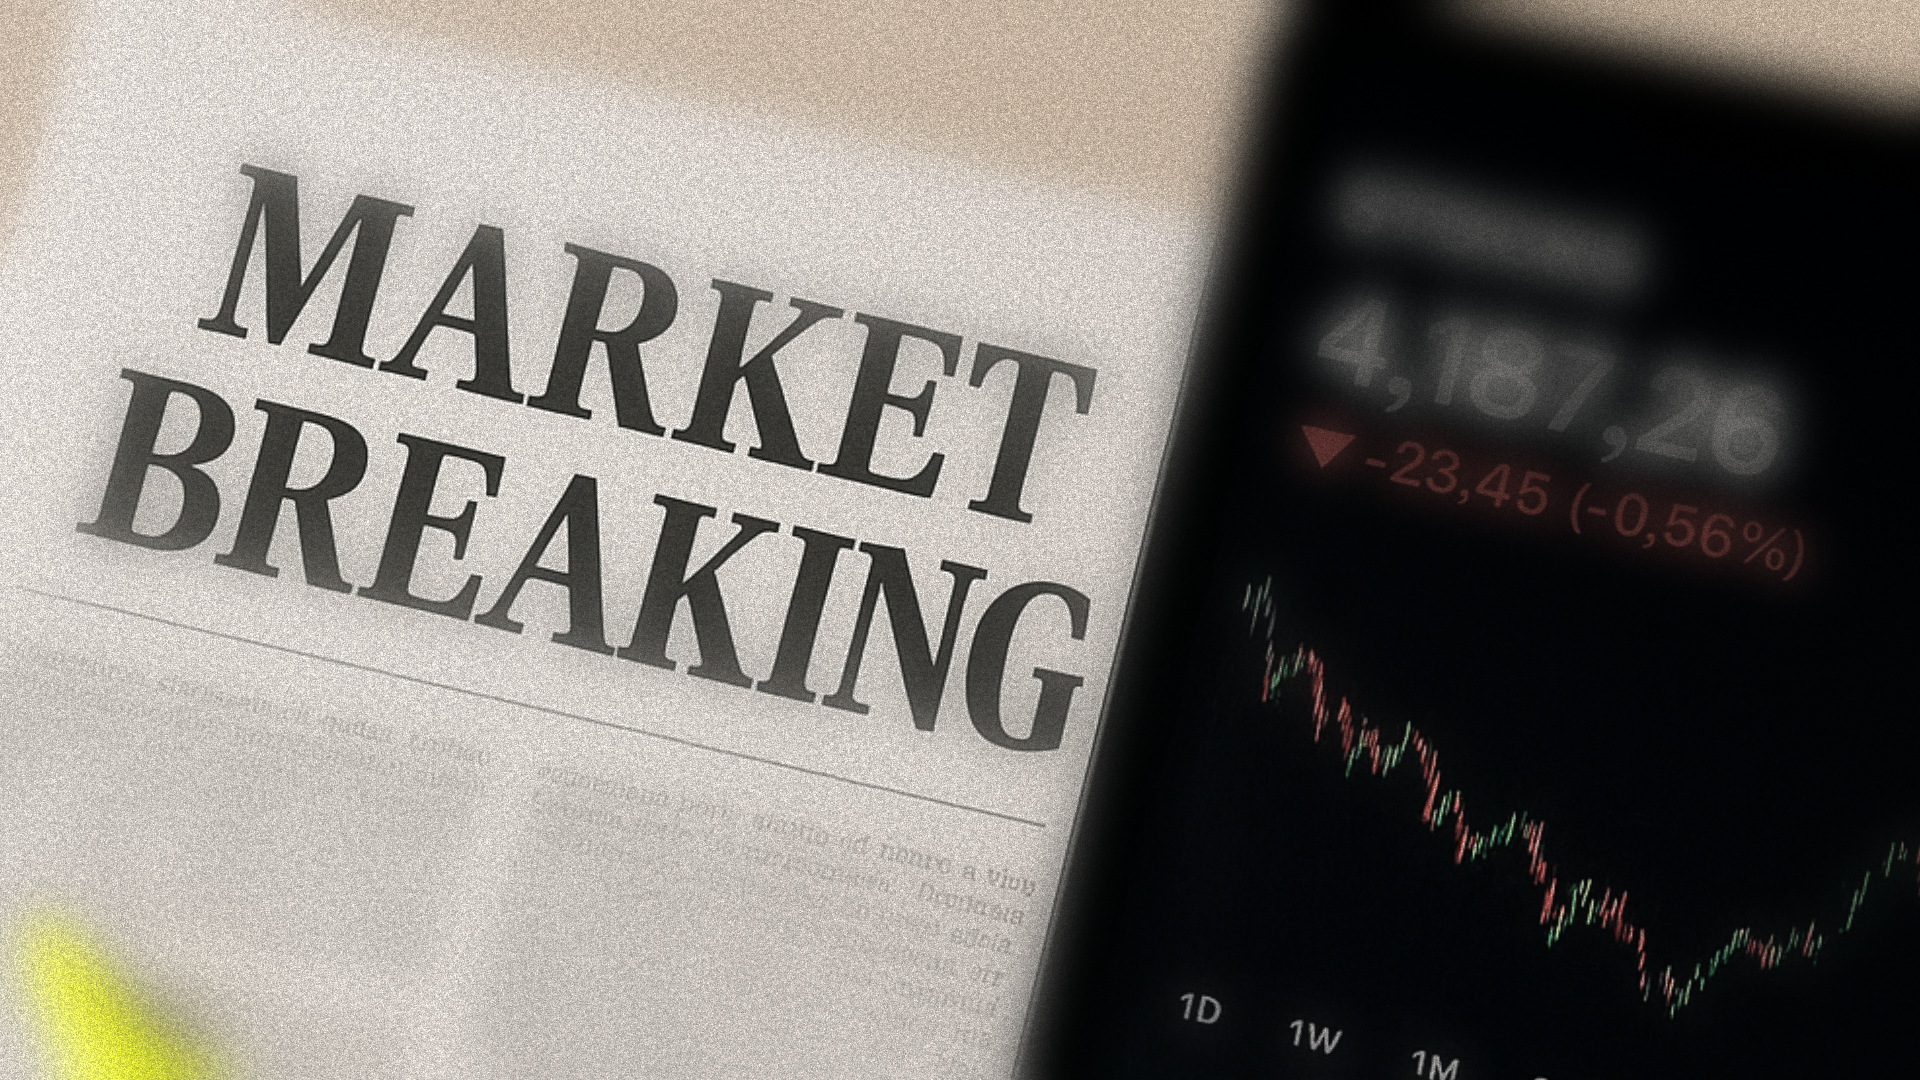
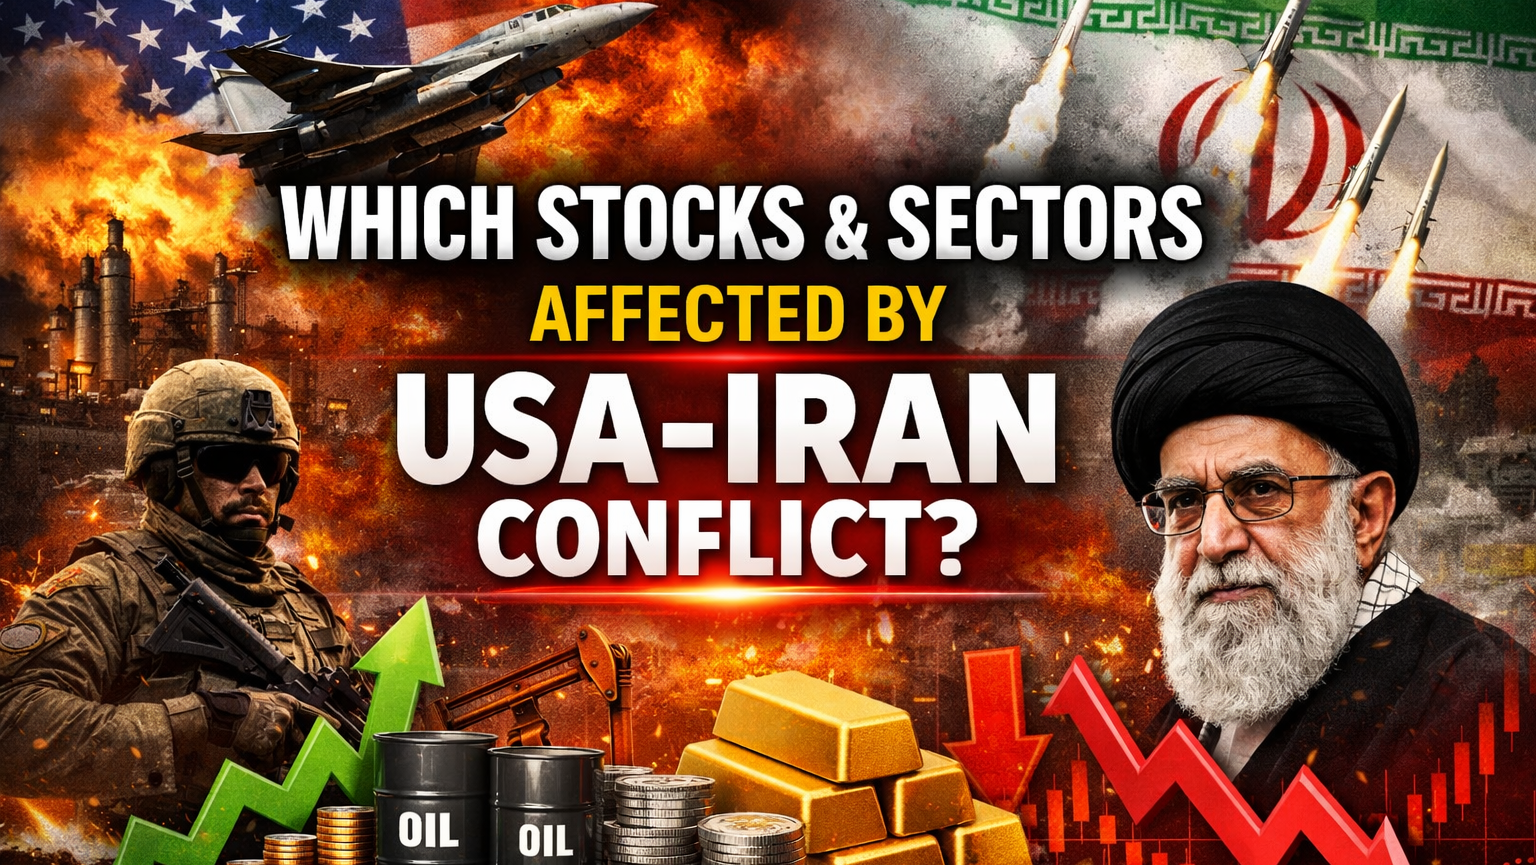
When Does No Tax on Overtime Start & How Does It Work?

The “No Tax on Overtime” provision, part of the recently passed One Big Beautiful Bill Act (H.R. 1), is making headlines for its potential to increase take-home pay for millions of American workers. Signed into law by President Trump on July 4, 2025, the bill eliminates federal income tax on overtime earnings and tips for qualifying individuals starting January 1, 2025.

This article explains how the bill works, who qualifies, and what changes workers and employers should expect.

What Is the “No Tax on Overtime” Bill?

The “No Tax on Overtime” proposal grants a federal income tax deduction for overtime pay, targeting non-exempt employees under the Fair Labor Standards Act (FLSA). These workers typically receive time-and-a-half for hours worked beyond 40 in a workweek. The provision is a key part of H.R. 1, also known as the One Big Beautiful Bill, spearheaded by the GOP and endorsed by President Donald Trump.

The bill includes provisions for a deduction of up to $12,500 for single filers and $25,000 for joint filers on eligible overtime income. These deductions apply to tax years 2025 through 2028 and phase out for individuals earning over $150,000 and couples over $300,000 annually.

A separate bill, the Overtime Pay Tax Relief Act of 2025 (H.R. 561), proposed a partial deduction capped at 20% of wages, but it has not passed. Similarly, Senate Bill S. 1046, which proposed a full exemption, was not incorporated into the final version of H.R. 1.

Importantly, while overtime pay becomes exempt from federal income tax, FICA taxes (Social Security and Medicare) still apply.

What Is the “One Big Beautiful Bill”?

Passed by the House on May 22, re-approved on July 3, and cleared by the Senate on July 1, 2025, with Vice President JD Vance casting the deciding vote, the One Big Beautiful Bill Act is a sweeping tax and budget reform law. It delivers several key campaign promises from the 2024 Trump campaign, including:

  • No federal income tax on tips and overtime
  • A deduction for certain Social Security income (not a full exemption)
  • An extension of the 2017 Tax Cuts and Jobs Act provisions
  • Auto loan interest deductibility
  • Adjustments to Medicaid and border security spending

Republican lawmakers, including House Ways and Means Chairman Jason Smith, call it the largest tax cut in U.S. history. However, nonpartisan estimates from the Tax Policy Center and Tax Foundation suggest the total cost could reach $3 to $5 trillion over the next decade, with concerns over the potential deficit impact and inequities in the tax code.

How Will the Bill Affect Your Paycheck?

Eligible workers will begin earning tax-free overtime starting January 1, 2025, but changes in paycheck withholding may not occur immediately. The IRS is expected to update federal withholding tables by 2026. Until then, employees will need to claim the deduction when filing their 2025 tax returns in early 2026.

To illustrate the impact:

A worker earning $20 per hour, who works 10 overtime hours weekly at $30/hour, earns $300 in weekly overtime – or $15,600 annually. At a 22% tax bracket, this worker currently pays around $3,432 in federal income tax on that amount. Under the new law, up to $12,500 of that can be deducted, reducing federal income tax liability by about $2,750, depending on their tax situation.

However, Social Security (6.2%) and Medicare (1.45%) taxes will still apply, reducing net savings somewhat.

Employers are required to separately track and report overtime earnings on W-2 forms. Payroll systems will need updating, and HR departments should prepare to explain these changes to employees. Note that state income taxes will still apply unless states pass their own exemptions (Alabama, for instance, has one expiring in June 2025).

Are Tips Included?

Yes. The no tax on tips provision allows eligible workers to deduct up to $25,000 in tip income per year ($50,000 for joint filers), subject to the same income thresholds and time limits (2025–2028). This applies to:

  • Employees (e.g., restaurant servers, salon workers)
  • Gig workers and independent contractors who receive qualified tips

Again, while tips are exempt from federal income tax, they remain subject to FICA taxes, and the deduction does not apply to non-cash tips or service charges.

Employers must report tips separately on W-2s. Independent contractors must track tips for Form 1099-NEC or 1099-K. Critics argue that this could lead to administrative burdens and even “tip inflation” or classification abuse by businesses.

When Does No Tax on Overtime Start?

The law takes effect for taxable years beginning January 1, 2025, and applies through December 31, 2028, unless extended by Congress.

Although the bill is now signed into law, most workers will only notice the benefit when filing their 2025 tax returns in early 2026. The IRS is expected to issue revised withholding guidance by late 2025 or early 2026.

Employers and payroll providers should begin tracking eligible income streams—overtime and tips—separately to ensure compliance with W-2 reporting standards and support accurate tax filings.

Has the Bill Been Passed?

Yes. The No Tax on Overtime and No Tax on Tips provisions are now law under the One Big Beautiful Bill, signed by President Trump on July 4, 2025. The Senate approved the package by a 51–50 vote on July 1, with the House concurring on July 3. IRS implementation guidance is expected in the coming months.

Frequently Asked Questions (FAQ)

Is overtime currently taxed in the U.S.?

Yes. Before 2025, overtime pay is taxed like regular wages—federal income tax, Social Security, and Medicare apply. Starting in 2025, federal income tax will no longer apply to qualifying overtime income, but FICA taxes remain.

Who qualifies?

Non-exempt workers earning less than $160,000 (or $300,000 for joint filers) with a valid Social Security number qualify. Highly compensated employees and independent contractors are not eligible for the overtime tax break.

Will part-time workers benefit?

Only if they work more than 40 hours in a week and are classified as non-exempt under the FLSA. Most part-timers won’t see significant changes.

What’s in the Overtime Tax Relief?

The bill provides an annual deduction on overtime earnings: $12,500 for individuals, $25,000 for joint filers, phasing out beyond $150,000/$300,000. It does not eliminate all taxes on overtime—payroll taxes still apply.

Do states offer similar exemptions?

Most states do not. Alabama implemented a temporary exemption through June 2025, and others like Connecticut and Delaware are considering similar measures. Federal law does not override state income tax unless states act independently.

Conclusion

The No Tax on Overtime and No Tax on Tips provisions are now officially part of U.S. tax law, promising real benefits for hourly and tipped workers. Although full withholding changes may not show up in paychecks until 2026, the law retroactively applies to all qualifying income from January 1, 2025. Employers and workers alike should prepare now by tracking income accurately and consulting tax professionals to maximize savings.

This article is for informational purposes only and should not be considered financial advice. Investing in stocks, cryptocurrencies, or other assets involves risks, including the potential loss of principal. Always conduct your own research or consult a qualified financial advisor before making investment decisions. The author and publisher are not responsible for any financial losses incurred from actions based on this article. While efforts have been made to ensure accuracy, economic data and market conditions can change rapidly. The author and publisher do not guarantee the completeness or accuracy of the information and are not liable for any errors or omissions. Always verify data with primary sources before making decisions.

2 Reasons Robinhood Stock is Dropping

hood stock latest news

Shares of Robinhood Markets Inc (NASDAQ: HOOD) declined sharply Thursday morning, trading at $94.21, down $3.77 or 3.85% as of 10:24 AM ET. The stock is reversing after a high-profile rally, pressured by fresh doubts and technical resistance.

Robinhood stock latest news

Why Is Robinhood Falling?

OpenAI Denial Hits Tokenized Shares Sentiment

Robinhood shares had initially surged after the company launched tokenized shares for private giants like OpenAI and SpaceX, promoting the products as a way for retail investors to access Silicon Valley startups via blockchain.

However, OpenAI quickly issued a strong statement on X, denying any partnership with Robinhood, clarifying that it had never authorized any transfer of its equity, and explicitly rejecting any endorsement of these offerings. That swift denial rattled market confidence and triggered a rapid reversal from fresh highs.

HOOD: Technical Outlook for July 2025

HOOD candlestick chart by trading view

Robinhood had broken its all-time high of $85 on June 25, closing above it on June 30, and touched $100 for the first time on July 2. This move encouraged profit booking by traders.

Now, price action shows a double-top pattern forming around the $100 mark, which could continue to pressure the stock unless it breaks out decisively above that resistance. If Robinhood fails to hold support near $89.70, the next support area could be in the $74–79 zone, followed by a stronger level between $62–67 if selling deepens.

On the hourly timeframe, the Relative Strength Index (RSI) is near 50, indicating the stock is still far from oversold territory.

Also Read – Everything You Need to Know About the Dollar Index in 2025

Recent Performance Snapshot

The company holds a market capitalization of $82.87 billion with a trailing price-to-earnings ratio of 53.90 and earnings per share of $1.75. Robinhood’s next earnings announcement is expected on July 30, 2025. Year to date, the stock has surged 153.17%, far outperforming the S&P 500’s gain of 6.63%. Over one year, Robinhood is up 312.10% versus the S&P 500’s 13.27%, and its three-year return is an impressive 1,053.18% compared to the broader index’s 63.95%. Over the past five years, Robinhood has gained 148.24%, modestly outpacing the S&P 500’s 100.37%.

This article is for informational purposes only and should not be considered financial advice. Investing in stocks, cryptocurrencies, or other assets involves risks, including the potential loss of principal. Always conduct your own research or consult a qualified financial advisor before making investment decisions. The author and publisher are not responsible for any financial losses incurred from actions based on this article. While efforts have been made to ensure accuracy, economic data and market conditions can change rapidly. The author and publisher do not guarantee the completeness or accuracy of the information and are not liable for any errors or omissions. Always verify data with primary sources before making decisions.

Should You Go for Figma’s IPO? – 8 Things to Consider

Figma, a leading cloud-based collaborative design platform, has filed for an initial public offering (IPO), generating significant excitement among investors.

Figma, the widely used cloud-based collaborative design platform, has officially filed for its highly anticipated initial public offering (IPO), capturing significant attention among technology investors. While this article does not make a buy or sell recommendation, it provides eight critical factors you should weigh before deciding whether Figma’s IPO fits your investment goals.

1. IPO Date, Listing Timeline, and Exchange Details

Figma filed its S-1 registration with the U.S. Securities and Exchange Commission (SEC) on July 1, 2025, confirming plans to list on the New York Stock Exchange under the ticker symbol FIG. Industry analysts suggest the IPO will take place in late summer or early fall 2025, possibly as early as August if the SEC review progresses smoothly.

Trading for FIG shares will occur during normal NYSE hours (9:30 AM–4:00 PM ET), with pre-market (4:00 AM–9:30 AM ET) and after-hours (4:00 PM–8:00 PM ET) trading potentially available through certain brokers.

  • Advantage: The NYSE listing brings high liquidity and investor trust.
  • Risk: SEC approval delays could push the listing into September or beyond.

2. IPO Price, Valuation, and Market Cap

Figma has not yet disclosed the specific IPO share price or offering size in its S-1. However, the company was valued at $12.5 billion during a 2024 private tender transaction. Analysts expect a public valuation in the range of $15 billion to $20 billion, depending on pricing and demand.

Industry sources, including Renaissance Capital, estimate the IPO could raise as much as $1.5 billion, making it one of 2025’s most significant technology IPOs alongside other big names such as CoreWeave. The final market capitalization will be determined by the share price and total shares outstanding, which will be updated closer to the listing date.

  • Advantage: A strong valuation reflects robust investor interest and confidence in the company’s business model.
  • Risk: High valuations carry downside if growth momentum slows post-IPO, potentially leading to share price corrections.

3. How and Where to Buy IPO Shares?

If you wish to participate in Figma’s IPO at the offering price, you will need to work through underwriters such as Morgan Stanley, Goldman Sachs, J.P. Morgan, or Allen & Co. Typically, these allocations are reserved for institutional clients and high-net-worth individuals, though some brokers – for example, Fidelity, Charles Schwab, or Robinhood – might offer limited retail IPO allocations.

For most retail investors, buying will be easier once FIG begins public trading on the NYSE. Like all IPOs, oversubscription is possible, which could mean limited availability for retail investors at the initial price.

  • Advantage: Multiple reputable brokerages may participate, expanding accessibility.
  • Risk: Retail buyers could face allocation challenges or higher prices if demand is very strong on day one.

4. S-1 Filing Details and Financials

Figma’s S-1 filing reveals a company with compelling growth metrics and a sharp turnaround in profitability:

  1. 2024 Revenue: $749 million, a 48% increase from 2023
  2. Q1 2025 Revenue: $228.2 million, a 46% jump year-over-year
  3. Rolling 12-month revenue (as of March 2025): $821 million
  4. Gross Margin: A standout 91%
  5. Q1 2025 Net Income: $44.9 million, compared to $13.5 million the previous year
  6. 2024 Net Loss: $732 million, largely from a one-time stock-based compensation expense
  7. Cash and Equivalents: $1.54 billion
  8. Debt: Minimal, consisting mostly of a revolving credit facility
  9. Enterprise Customers: 78% of Forbes 2000 companies, with over 1,000 clients generating more than $100,000 in annual recurring revenue

According to its filing, IPO proceeds will fund global expansion, research in artificial intelligence, and selective acquisitions.

  • Advantage: Strong revenue growth, improving profitability, and a solid cash reserve.
  • Risk: High stock-based compensation expenses could weigh on future earnings, depending on how aggressively Figma continues to incentivize employees.

5. Business Model and Competitive Advantages

Figma runs on a subscription-based SaaS model, providing design and collaboration tools through the cloud to individuals, businesses, and large enterprises. Unlike traditional desktop software, its browser-based platform allows real-time teamwork.

Competitive advantages include:

  1. 95% adoption rate among Fortune 500 companies
  2. 132% net dollar retention, reflecting upsell success
  3. 76% of Fortune 500 customers use multiple Figma products
  4. 85% of monthly users located internationally
  5. Generative AI tools, including partnerships with Adobe Firefly and third-party AI models

Competition includes: Adobe, Canva, Sketch, and InVision, as well as new players leveraging AI such as Anthropic or tools developed by OpenAI.

  • Advantage: Market leadership with strong lock-in through collaborative features and sticky customers.
  • Risk: Emerging AI-native competitors could challenge Figma’s market share.

6. Leadership and Ownership

Founded in 2012 by Dylan Field and Evan Wallace, Figma remains founder-led, with Field as CEO. He is widely credited with pushing its collaborative-first design model and expanding its AI capabilities.

Major shareholders include:

  1. Index Ventures: 16.8%
  2. Greylock: 15.7%
  3. Kleiner Perkins: 14%
  4. Sequoia Capital: 8.7%

Cumulatively, Figma has raised around $749 million across several funding rounds involving top-tier Silicon Valley investors.

  • Advantage: Visionary founder leadership, with respected and experienced backers.
  • Risk: Heavy dependence on Field’s strategic direction could be a weakness if leadership transitions are needed in the future.

7. Crypto Exposure and USDC Holdings

In an unusual twist for a design company, Figma reported in its S-1 that it holds approximately $69.5 million in Bitcoin ETFs (specifically, the Bitwise Bitcoin ETF) and another $30 million in USDC stablecoins, which it plans to convert to Bitcoin.

Also Read – I Created the Best Bitcoin Guide You’ll Ever Read

While this allocation is small compared to its cash reserves, it signals a forward-looking approach to treasury management, similar to moves by Tesla or Block.

  • Advantage: Diversification of assets could enhance returns over time.
  • Risk: Exposure to cryptocurrency volatility and potential regulatory scrutiny around digital assets.

8. Broader Investment Considerations: Risks, Opportunities, and Sentiment

Opportunities:
  1. Figma has strong revenue growth and world-class gross margins.
  2. A customer base of 13 million monthly active users, with two-thirds outside the design profession, creates future upsell opportunities.
  3. Ongoing investment in AI features positions Figma to adapt to rapidly evolving design workflows.
Risks:
  1. Fierce competition from Adobe, Canva, and newer AI-native design apps
  2. Heavy R&D spending (over $750 million in 2024, largely in stock-based compensation)
  3. Exposure to crypto market swings, though small, could unsettle conservative investors
  4. Lofty valuations could face corrections if macroeconomic or sector-specific headwinds emerge

Market sentiment so far is cautiously optimistic, with pre-IPO commentary on social media platforms like X showing excitement about its 132% net dollar retention, profitability turnaround, and high user stickiness.

Expert analysts at Renaissance Capital have expressed bullish projections for the IPO, while some caution that valuations above $15 billion might be aggressive if the tech sector weakens.

Timing considerations: IPOs often trade with high volatility in the first 30 to 90 days. Some investors prefer to wait for a post-lock-up period (commonly 90–180 days) before initiating a position, as early employees and insiders become eligible to sell.

Conclusion

Figma’s IPO represents one of the most significant SaaS opportunities of 2025, showcasing robust growth, profitability improvements, and dominant market share in the collaborative design space. Its dual focus on AI-driven innovation and a proven subscription business model gives it an enviable position relative to many rivals.

However, the combination of intense competition, a possibly high valuation, and modest but nontrivial crypto exposure should caution even growth-oriented investors.

Ultimately, whether Figma is “worth it” depends on your personal risk tolerance, IPO pricing, and a careful reading of the S-1 and subsequent SEC updates. Monitoring institutional demand, short interest, and broader tech-sector sentiment will also be important in the weeks before the IPO. Investors should consider consulting a qualified financial advisor to match this opportunity with their portfolio objectives.


This article is for informational purposes only and should not be considered financial advice. Investing in stocks, cryptocurrencies, or other assets involves risks, including the potential loss of principal. Always conduct your own research or consult a qualified financial advisor before making investment decisions. The author and publisher are not responsible for any financial losses incurred from actions based on this article. While efforts have been made to ensure accuracy, economic data and market conditions can change rapidly. The author and publisher do not guarantee the completeness or accuracy of the information and are not liable for any errors or omissions. Always verify data with primary sources before making decisions.

3 Reasons Palantir Is Crashing – Technical Outlook for Monday

Palantir stock latest crash news

Shares of Palantir Technologies Inc. (NYSE: PLTR) closed sharply lower on Friday, tumbling 9.37% to $130.74 as investors absorbed a wave of selling pressure. The market cap has plunged to $308,534,946,784 as selling pressure intensified.

The stock, which has rallied over 124% from its April swing low, has now pulled back nearly 12% from its all-time high of $148.22.

Price chart of PLTR stock

Why is Palantir going down?

Here are three key reasons driving this drop:

1. Unsustainable Valuations

Palantir is trading at a sky-high price-to-earnings (P/E) ratio of 570.94, based on trailing twelve-month earnings per share of $0.23. Such valuations are hard to justify even for a growth-oriented technology company, especially after an extended rally. Many investors see this P/E as unsustainable, raising concerns that Palantir could be priced far beyond its fundamentals.

2. Profit Booking After a Powerful Rally

The stock surged 124.16% from its April low of $66.12, reaching a record high of $148.22 earlier this month.

Palantir stock candlestick chart by TradingView.

However, RSI had already been diverging since February, warning of a potential pullback.

Traders expecting a deeper correction were initially caught off guard as institutional players continued buying to absorb liquidity. Once broader market participants regained confidence and resumed buying, larger players offloaded their positions at higher prices to maximize liquidity, driving Friday’s sharp decline.

Technically, the stock has broken below its daily 9-day exponential moving average and is testing support in the $125–$130 range, with its weekly 9 EMA also nearby.

A short-term bounce could occur here, but the broader structure suggests a potential move toward the $105–$100 zone, which aligns with the monthly 9 EMA and a key psychological round number.

3. Risks Surrounding Department of Defense Contracts

Investors are also wary of risks tied to Palantir’s government business. The U.S. Department of Defense recently published its fiscal year 2026 budget request, which, after accounting for inflation, is slightly smaller than the previous cycle. Since Palantir depends on significant government and defense contracts, any perceived reduction in defense spending could negatively affect future revenue growth.

Also Read – 5 Reasons Circle (CRCL) Stock Is Crashing as It Touches the $200 Mark

Palantir Technologies Inc. (NYSE: PLTR) has delivered impressive gains for investors over the past year, surging 442.49% and climbing 71.57% year-to-date as of the latest close.

This article is for informational purposes only and should not be considered financial advice. Investing in stocks, cryptocurrencies, or other assets involves risks, including the potential loss of principal. Always conduct your own research or consult a qualified financial advisor before making investment decisions. The author and publisher are not responsible for any financial losses incurred from actions based on this article. While efforts have been made to ensure accuracy, economic data and market conditions can change rapidly. The author and publisher do not guarantee the completeness or accuracy of the information and are not liable for any errors or omissions. Always verify data with primary sources before making decisions.

Reasons Why Hims & Hers Crashed 30.7% Today

Palantir stock latest crash news

New York || 10:39 AM ET – plunging 30.7% to $43.00, down from Friday’s close, after Novo Nordisk abruptly terminated a critical partnership.

Trading volume surged to 39.90 million shares, nearly matching the three-month average, reflecting investor alarm. Despite the plunge, HIMS remains up 83.30% year-to-date (YTD), highlighting its volatile rally.

Why is Hims & Hers Falling Today?

The sell-off is driven by fundamental blows to Hims & Hers’ weight-loss business.

Novo Nordisk (NYSE: NVO) ended a monthlong partnership formed in April 2025 to transition patients from compounded versions of its blockbuster GLP-1 drug Wegovy to branded prescriptions.

Novo Nordisk alleged Hims engaged in “illegal mass compounding” and “deceptive promotion” of unapproved Wegovy knockoffs, which violated laws prohibiting mass sales of compounded drugs under the guise of personalization. The Danish drugmaker, whose own stock dipped 5.15%, stated it would no longer allow Wegovy to be bundled with Hims’ $599/month membership, a key growth driver.

The partnership’s collapse threatens Hims’ $725 million 2025 weight-loss revenue target, with compounded semaglutide accounting for ~25% of 2024 sales ($225 million).

Regulatory risks compound the issue: the FDA’s February 2025 removal of semaglutide from its shortage list, followed by a crackdown on compounders, already disrupted Hims’ GLP-1 supply. Hims’ pivot to oral medications and generic liraglutide has underperformed, per Leerink analyst Michael Cherny.

Additionally, Hims issued a surprise guidance cut on June 23, lowering its 2025 EBITDA forecast by 18% due to a 15% year-over-year rise in customer acquisition costs (CAC) and a 200-basis-point margin decline. Competition from Teladoc and GoodRx has squeezed Hims’ 2.4 million subscriber base (up 38% YoY), slowing core revenue growth from 45% in Q3 2024 to 29% in Q1 2025.

Also Read – Top 7 Stocks That May Benefit from a Strait of Hormuz Closure

Hims & Hers Stock Price June 23, 2025 – Key Metrics

Hims & Hers’ financials reflect its high-risk profile:

MetricValue
Market Cap$9.98 Billion
EPS (TTM)$0.68
Forward EPS (2025E)$0.65(Est)
YTD Performance83.30%
Shares Outstanding213.73M*
Beta3.22

The P/E ratio stands at 65.78, meaning investors are willing to pay $65.78 for every $1 of earnings.

Hims and Hers Health Stock Outlook June 2025

As of 10:39 AM, bearish sentiment prevails.

The stock’s RSI of 39 indicates oversold conditions, but the compounding scandal and guidance cut deter buyers.

Hims and Hers stock outlook june 2025 - chart by trading view

HIMS is trading at its $45 support level; a breach could drive it to the next crucial support zone at $39–$36. If it recovers, $52–$54 may act as resistance, potentially leading to rangebound trading between $36 and $52 for several days. These technical levels are speculative and not investment advice.

A shift to oral medications or European growth via ZAVA could spur recovery, but for now, the compounding scandal keeps HIMS a high-risk play.

This article is for informational purposes only and not financial advice. Investing in stocks involves risks, including potential loss of principal. Conduct your own research or consult a qualified financial advisor before investing. The author and publisher are not liable for losses from actions based on this article. Data accuracy is not guaranteed due to changing market conditions.

How High Could Crude Oil Prices Go If the Strait of Hormuz Is Blocked?

Centene Corporation stock latest news

New York || 03:57 AM ET – Crude oil markets are on edge as rising tensions in the Middle East spark fears of a potential closure of the Strait of Hormuz, a vital maritime corridor for about 20 million barrels of oil per day – equivalent to 20% of global petroleum supply. Even partial disruption could send oil prices soaring, with wide-reaching implications for inflation, global trade, and stock markets.

This article explores crude oil price projections based on technical analysis, evaluates the potential economic fallout, and identifies key sectors that may be affected.


Why the Strait of Hormuz Is Crucial

The Strait of Hormuz, situated between Iran and Oman, is the world’s most important oil chokepoint. In 2024, it handled 20 million barrels per day (b/d) – 25% of seaborne oil trade. Major oil-exporting nations like Saudi Arabia, the UAE, Iraq, and Kuwait depend on this route to supply global markets, particularly in Asia.

Strait of Hormuz

Iran’s threats to block the Strait – escalated following recent U.S. and Israeli strikes on Iranian nuclear sites-have renewed global energy security concerns. While analysts estimate only a 7% probability of full closure, even limited disruptions such as tanker attacks or naval blockades could significantly affect crude oil flows.


Crude Oil Price Outlook – Technical Analysis for June 2025

The WTI crude oil chart offers critical insights into potential future price movements amid rising geopolitical tensions. Traders and analysts are closely watching key support and resistance levels to gauge whether the rally can be sustained or a reversal may be imminent.

If the price sustains above $78 or strong buying interest emerges, the next significant resistance is at $88.

If WTI crude breaches $93, there is a high probability the price may reach $109–$111.

$67–$68 is a significant support zone (see the provided chart for reference).


WTI Crude oil Candlestick Chart by TradingView

Price Scenarios – What Could Happen?

ScenarioPrice RangeAssumptions
Base Case$85–$88Limited escalation; no significant supply interruption
Bullish Case$100–$120Blockade or severe disruption removes 5–7 million b/d
Bearish Case$65–$68Diplomatic resolution; U.S. shale production ramps up

Also Read – Top 7 Stocks That May Benefit from a Strait of Hormuz Closure

Economic Fallout: What Could a Blockade Trigger?

1. Rising Energy Costs

  • Gasoline Prices: Already at $4.38/gal; could spike to $5.00–$5.50
  • Heating Oil: Northeast U.S. homes may pay $125–$240 more per winter
  • Shipping: Freight rates up 60% due to route changes around Cape of Good Hope

2. Inflation and Fed Policy

  • Higher oil prices could delay Fed rate cuts, impacting U.S. monetary policy.
  • Treasury yields may rise, pressuring growth and tech stocks.
  • China’s 2025 GDP forecast may fall below 4.5% amid trade-related slowdowns.

3. Market Impact by Sector

SectorLikely Impact
EnergyOil producers and energy ETFs (XLE, USO) could rally
TransportAirlines and shipping stocks face pressure
EquitiesBroader indices (S&P 500, NASDAQ) vulnerable to pullbacks
Safe HavensCapital could flow into gold and Japanese yen

4. Disruptions in Global Trade

  • Asia (India, China): 84% of oil via Hormuz goes to Asia; India imports 51% of its crude from Gulf nations.
  • LNG Impact: 20% of global LNG flows through the Strait, critical for power and fertilizer sectors.

Historical Comparisons – What Past Crises Tell Us?

EventOutcome
Gulf War (1990)Oil jumped 70% in 3 months after Iraq’s invasion of Kuwait
Tanker Wars (1980s)Iran-Iraq attacks on tankers led to U.S. naval intervention
2019 Hormuz CrisisSeizures of tankers added a $10–$15 premium to crude prices

Final Thoughts

A Strait of Hormuz blockade, though unlikely in the long term, remains a high-impact risk event. Technical indicators suggest WTI could break past $80, with $100–$130 possible if conflict escalates. The economic fallout would ripple across sectors – from gas pumps to tech portfolios.


This article is for informational purposes only and should not be considered financial advice. Investing in stocks, commodities, or other assets involves risks, including the potential loss of principal. Always conduct your own research or consult a qualified financial advisor before making investment decisions. The author and publisher are not responsible for any financial losses incurred from actions based on this article. While efforts have been made to ensure accuracy, economic data and market conditions can change rapidly. The author and publisher do not guarantee the completeness or accuracy of the information and are not liable for any errors or omissions. Always verify data with primary sources before making decisions.

Top 7 Stocks That May Benefit from a Strait of Hormuz Closure

CRCL Stock - latest news

New York || 03:36 AM ET – As geopolitical tensions escalate in the Middle East, particularly around the possible closure of the Strait of Hormuz, global markets are on high alert. The strait – responsible for transporting roughly 24% of global oil trade and one-third of liquefied natural gas (LNG) in Q1 2025 – plays a vital role in maintaining global energy flows.

7 Stocks that may Rise If the Strait of Hormuz Gets Blocked?

Any disruption here could send oil prices surging to $110–$120 per barrel, triggering volatility across economies.

While such a scenario could pose risks for many sectors, it may also create upside opportunities for specific industries.

Below are seven stocks that could benefit if the Strait of Hormuz faces a prolonged disruption.

1. Exxon Mobil (XOM)

Sector: Energy – Oil & Gas Exploration

ExxonMobil stands out as one of the world’s largest integrated oil and gas companies. A closure of the Strait would likely cause oil prices to spike sharply, and ExxonMobil’s strong U.S. shale operations – particularly in the Permian Basin – are well-positioned to capitalize. As oil becomes more expensive globally, producers with low-cost operations outside the Middle East are set to benefit.

Key Catalyst: Rising Brent crude prices and integrated refining operations could drive stock upside.


2. Chevron (CVX)

Sector: Energy – Oil & Gas Production

Chevron’s diverse international portfolio minimizes its dependence on Middle Eastern oil. With upstream operations in the U.S., Canada, and Australia, Chevron could see margins expand amid higher global crude prices. Additionally, its LNG projects in Australia could gain from reduced Qatari exports if the Strait is blocked.

Key Catalyst: Strength in upstream and LNG operations under rising price scenarios.


3. APA Corporation (APA)

Sector: Energy – Independent Oil & Gas

APA Corporation focuses on upstream production in regions like the U.S., Egypt, and the North Sea. With minimal exposure to Middle Eastern logistics, APA could see significant earnings gains from surging oil prices. Its lean cost structure and focus on high-margin wells make it a nimble player in volatile energy markets.

Key Catalyst: Independent producers historically outperform during oil price spikes.


4. Scorpio Tankers (STNG)

Sector: Transportation – Shipping

A closure of the Strait would disrupt traditional shipping routes, increasing the demand for alternative and longer routes such as around the Cape of Good Hope. Scorpio Tankers, a major operator of product tankers, stands to benefit from the resulting surge in shipping rates and freight demand.

Key Catalyst: Global rerouting of petroleum shipping increases tanker day rates and utilization.

Also Read – Top 13 Stocks That Could Be Impacted by a Strait of Hormuz Blockade


5. Northrop Grumman (NOC)

Sector: Industrials – Aerospace & Defense

Rising geopolitical tensions usually trigger an increase in defense spending. Northrop Grumman, a top-tier defense contractor specializing in missile systems, drones, and cybersecurity, is expected to benefit from any military buildup in the Persian Gulf region.

Key Catalyst: Greater demand for U.S. missile defense and naval systems.


6. Barrick Gold (GOLD)

Sector: Materials – Gold Mining

In times of geopolitical turmoil, investors often flee to safe-haven assets like gold. Barrick Gold, one of the largest and lowest-cost producers, could see tailwinds if gold prices spike in reaction to market fear, oil-driven inflation, or rising global risks.

Key Catalyst: Gold’s historical performance as a hedge during military and inflationary crises.


7. Kinder Morgan (KMI)

Sector: Energy – Pipeline Infrastructure

Kinder Morgan operates a massive network of pipelines and energy terminals across North America. If oil and LNG flows through the Strait are restricted, the demand for domestically produced and transported energy could rise, benefiting Kinder Morgan’s throughput volumes.

Key Catalyst: Higher U.S. energy demand and rerouting increase pipeline utilization and stability.


Sector Summary

SectorStockPotential Catalyst
EnergyXOM, CVX, APAOil price surge and non-ME operations
TransportationSTNGTanker rerouting and higher freight rates
DefenseNOCIncreased global military spending
MaterialsGOLDFlight to gold as a safe-haven asset
Energy InfraKMIDomestic pipeline demand boost

The Bottom Line

While a complete closure of the Strait of Hormuz is unlikely due to Iran’s own reliance on it and U.S. naval presence in the region, even a short-term disruption could create meaningful market movements. These seven stocks, spanning multiple sectors, offer exposure to energy price surges, supply chain disruptions, and defense upswings.

This article is for informational purposes only and should not be considered financial advice. Investing in stocks, cryptocurrencies, or other assets involves risks, including the potential loss of principal. Always conduct your own research or consult a qualified financial advisor before making investment decisions. The author and publisher are not responsible for any financial losses incurred from actions based on this article. While efforts have been made to ensure accuracy, economic data and market conditions can change rapidly. The author and publisher do not guarantee the completeness or accuracy of the information and are not liable for any errors or omissions. Always verify data with primary sources before making decisions.

Top 13 Stocks That Could Be Impacted by a Strait of Hormuz Blockade

Strait of Hormuz

New York || 11:30 AM ET – On June 22, 2025, Iran’s parliament voted to recommend closing the Strait of Hormuz following U.S. airstrikes on its nuclear facilities, escalating tensions in a waterway that carries 20% of global oil trade (20 million barrels per day) and 20-30% of liquefied natural gas (LNG). While the decision awaits approval from Iran’s Supreme National Security Council and the Supreme Leader, the threat alone has driven WTI crude to ~$78 per barrel and Brent to ~$80, though prices have corrected slightly since Monday’s market opening.

Any disruption to this vital route, which connects the Persian Gulf to the Gulf of Oman and Arabian Sea, could spike Brent crude above $100 per barrel, with analysts projecting $90-$150 in disruption scenarios, sending ripple effects across U.S. stock sectors, boosting energy and defense while pressuring consumer discretionary and airlines.


Which Sectors Are Directly Tied to the Strait of Hormuz?

The Strait of Hormuz is not just a geopolitical flashpoint – it’s a vital artery for the global economy. From a commercial standpoint, any disruption here sends ripple effects across multiple sectors.

The sectors most directly exposed include:

  • Energy – Oil and gas producers benefit from rising crude prices due to supply shocks.
  • Transportation – Airlines and shipping companies face higher fuel costs and route risks.
  • Industrials – Heavy equipment makers and steel firms tied to energy infrastructure may see volatile demand.
  • Defense – Heightened geopolitical risk can drive up military spending and defense contracts.
  • Oil Tankers & Maritime Insurance – Freight carriers and insurers often see rate spikes amid elevated threat levels.

These sectors represent the first wave of market response during major geopolitical disruptions like a Strait of Hormuz blockade. Their performance is often sector-specific and asymmetric.

Also Read – Top 7 Stocks That May Benefit from a Strait of Hormuz Closure


Energy – Riding the Oil Price Surge

The energy sector includes companies involved in oil, gas, and renewable energy production, exploration, and distribution. It is highly sensitive to crude oil prices, geopolitical events, and supply-demand fluctuations.

A Strait of Hormuz disruption would tighten global oil supply, boosting prices and benefiting oil and gas producers. The S&P 500 Energy Sector has already gained 9.2% in June 2025, reflecting market anticipation of supply risks.

ExxonMobil (XOM): As a major with diversified global operations, ExxonMobil benefits from rising oil prices and its strong balance sheet. Its Gulf partnerships and U.S. shale assets provide resilience. A $100+ Brent spike could drive further gains, though oversupply from non-OPEC+ producers may cap upside.

Chevron (CVX): Chevron’s exposure to OPEC+ stability and its Leviathan gas platform make it a high-beta play. However, regional exposure increases risk if Iranian retaliation escalates.

APA Corp (APA): This smaller U.S. shale producer has surged 18.52% in June, leveraging agility in domestic production. APA’s lack of direct Middle East exposure makes it a safer bet, but its high volatility requires caution in a de-escalation scenario.

Energy sector ETFs like XLE (Energy Select Sector SPDR Fund) may also outperform the broader market during such disruptions.


Transportation – Mixed Impacts from Fuel Costs and Freight Rates

Transportation stocks face divergent outcomes, with airlines pressured by fuel costs and tankers potentially gaining from rerouting premiums. Higher oil prices increase jet fuel costs, while shipping firms navigate route risks.

Delta Air Lines (DAL): Rising oil prices threaten airline margins, as jet fuel constitutes ~30% of operating costs. A $100+ oil spike could push gas prices to $4.50/gallon, reducing consumer travel demand. DAL, down ~1.5% in June, faces further downside if disruptions persist.

United Airlines (UAL): Similar to DAL, UAL is vulnerable to fuel cost spikes and demand contraction. Its stock has lagged, with a ~0.51% June decline.

Tsakos Energy Navigation (TEN): Tanker firms like TEN benefit from freight rate surges. TEN’s long-term contracts ensure revenue stability, making it a top pick for blockade-related gains.

International Seaways (INSW): INSW’s diversified fleet and balance sheet strength position it to capitalize on VLCC rate spikes. Up ~7.52% in June, INSW offers upside if rerouting persists, though de-escalation could compress rates.

Logistics-focused stocks like FedEx (FDX) and UPS (UPS) might face indirect impacts through higher transportation costs and potential route delays in affected regions.


Industrials – Volatile Demand Amid Energy Shocks

Industrials tied to energy infrastructure face mixed impacts, with demand volatility driven by oil price swings and economic slowdown fears.

Caterpillar (CAT): CAT’s heavy equipment is used in oilfield services, but a blockade could reduce global construction demand if gas prices increase, impacting consumer spending.

Nucor (NUE): Steel demand for energy infrastructure (such as pipelines) could rise with oil prices, but tariffs and inflation risks weigh on NUE. Its stock is up ~15% in June, and a broader market sell-off could exacerbate losses.


Defense – Benefiting from Geopolitical Tensions

Heightened U.S. and Israeli military activity in the Gulf boosts defense contractors, with demand for missile defense and cybersecurity solutions surging.

Lockheed Martin (LMT): LMT’s Patriot missiles and F-35 programs position it for contracts if the U.S. Fifth Fleet escalates operations. LMT is a safe haven amid Strait tensions.

Raytheon Technologies (RTX): RTX’s missile defense systems (for example THAAD) and cybersecurity tech benefit from Pentagon spending. RTX offers stability but faces risks if diplomacy prevails.


Oil Tankers & Maritime Insurance – Capitalizing on Risk Premiums

Tanker firms and insurers thrive on disruption-driven rate hikes and premiums.

Frontline (FRO): FRO’s refusal to sail through the Strait highlights risk, but its large VLCC fleet benefits from a 24% freight rate spike. FRO’s ~3.5% June gain makes it a strong play, though de-escalation could reverse gains.

Chubb (CB): Maritime insurers like Chubb see 30-50% premium hikes for Hormuz routes, boosting margins. Chubb may prove to be a diversified bet.


Broader Market Considerations

A full or partial blockade could send oil prices soaring past $105/barrel, potentially driving U.S. gas prices to $4.50-$6.00/gallon and triggering significant declines across the Dow Jones Industrial Average (DJIA), Nasdaq Composite, and S&P 500.

S&P 500 chart

While the S&P 500 may not experience immediate large-scale volatility, sector-specific movements could be sharp. Past oil shocks- such as during the 1973 Oil Crisis or the 1980s Iran-Iraq tanker war – led to sharp rallies in energy stocks and drawdowns in transportation and consumer discretionary names.

Although military experts debate whether Iran could fully block the strait (due to the presence of the U.S. Fifth Fleet and the waterway’s navigable width), even partial disruption or threats alone have historically spooked markets and moved oil prices.


The Bottom Line

Investors should approach Hormuz blockade concerns critically. Iran has threatened Strait closures since the 1980s without following through, and a blockade would cripple its oil exports to China.

While energy stocks offer upside, investors should avoid chasing volatility, focusing instead on undervalued firms with strong fundamentals and hedging against de-escalation risks.


This article is for informational purposes only and should not be considered financial advice. Investing in stocks, cryptocurrencies, or other assets involves risks, including the potential loss of principal. Always conduct your own research or consult a qualified financial advisor before making investment decisions. The author and publisher are not responsible for any financial losses incurred from actions based on this article. While efforts have been made to ensure accuracy, economic data and market conditions can change rapidly. The author and publisher do not guarantee the completeness or accuracy of the information and are not liable for any errors or omissions. Always verify data with primary sources before making decisions.

Is Darden Restaurants (DRI) Stock Poised for a Shift with Bahama Breeze’s Potential Sale?

CRCL Stock - latest news

New York || 05:03 AM ET – In the last trading session on Friday, June 20, 2025, Darden Restaurants, Inc. (NYSE: DRI) closed at $225.78, up 1.36 percent. Recent news about the possible sale or conversion of its Bahama Breeze chain has drawn investor attention. Below, we examine DRI’s stock performance, the latest developments, and factors to monitor.

Stock Performance

Darden Restaurants’ stock rose 1.36 percent on June 20, closing at $225.78 after moving between $222.00 and $226.30. Trading volume was 1.2 million shares, slightly above the average of 1.1 million. Over the past month, DRI has surged 9.96 percent, significantly outperforming the S&P 500’s 0.8 percent gain. The stock has gained 3.72 percent over the past five days, 19.80 percent year-to-date, and an impressive 43.37 percent over the past year. Over five years, DRI has soared 199.01 percent, reflecting its long-term strength. How Darden Restaurants stock performed in June 2025

Latest News

On June 20, Darden announced it is considering “strategic alternatives” for its Bahama Breeze chain, which may involve selling or converting its 14 remaining locations into brands like Olive Garden or LongHorn Steakhouse. This follows the closure of 15 underperforming Bahama Breeze restaurants in May 2025.

During the Q4 earnings call, CEO Rick Cardenas stated that Bahama Breeze is not a strategic priority. Darden reported Q4 revenue of $3.27 billion, up 10.6 percent year-over-year, beating estimates of $3.25 billion. The company increased its quarterly dividend by 7 percent, authorized a $1 billion share repurchase program, and signed a deal to open 30 Olive Garden locations in Canada over the next decade. Latest news about Darden Restaurants stock in June 2025

Technical Analysis and Price Forecast for DRI in June 2025

Darden Restaurants stock technical analysis June 2025

DRI is trading above its 50-day moving average of $215.50 and 200-day moving average of $205.80, confirming a bullish trend. Support is at $218.00, with resistance at $228.00, a level tested in June. The Relative Strength Index (RSI) is at 62, indicating room for growth before reaching overbought territory.

If the stock sustains above 225, it may move toward testing the 230 level next. The strongest support is seen in the 212 to 210 zone.

Valuation Metrics

Darden’s trailing P/E ratio is 25.43, with a forward P/E of 20.92, reflecting anticipated earnings growth. The PEG ratio of 2.20 suggests reasonable valuation for its growth outlook. Market cap stands at $26.42 billion, with an enterprise value of $32.13 billion. The price-to-sales ratio is 2.21, and the price-to-book ratio is 11.43. The enterprise value-to-EBITDA ratio is 16.46, and a beta of 1.25 indicates moderate market volatility.

Darden has 117.2 million shares outstanding, with a float of 116.8 million. In Q4, the company repurchased 0.2 million shares for $51 million and authorized a $1 billion buyback program on June 18, 2025, signaling management’s confidence in the stock’s value.

Key Factors Influencing Darden Restaurants Stock in June 2025

Darden’s Q4 performance, with 10.6 percent revenue growth and 4.6 percent same-store sales gains, driven by Olive Garden and LongHorn Steakhouse, underscores operational strength. The dividend increase and $1 billion buyback program reflect financial confidence, and the potential Bahama Breeze exit could streamline the portfolio. Analyst upgrades and a bullish technical outlook highlight positive momentum. However, the Bahama Breeze sale or conversion carries risks of costs or delays. The casual dining sector faces challenges from inflation and reduced consumer spending, and the stock’s price-to-book ratio of 11.43 may prompt scrutiny from value-focused investors.

This article is for informational purposes only and should not be considered financial advice. Investing in stocks, cryptocurrencies, or other assets involves risks, including the potential loss of principal. Always conduct your own research or consult a qualified financial advisor before making investment decisions. The author and publisher are not responsible for any financial losses incurred from actions based on this article. While efforts have been made to ensure accuracy, economic data and market conditions can change rapidly. The author and publisher do not guarantee the completeness or accuracy of the information and are not liable for any errors or omissions. Always verify data with primary sources before making decisions.

What’s Next for Lockheed Martin Stock After Layoffs?

Lockheed Martin Corporation (NYSE: LMT) rose slightly Friday, up 0.42 percent, but layoffs in its Aeronautics division and a 2.14 percent monthly decline have pushed its market cap to $110.25 billion. Investors are grappling with cost-cutting measures, F-35 challenges, and a strong global backlog, leaving questions about the stock’s future trajectory.

How Lockheed Martin Stock Performed in June?

LMT Stock Performed in June 2025

LMT shares gained 0.42 percent Friday, closing at approximately $437.50. The stock has shed 2.14% this month, trading between $430 and $455, with volume near its June average. Over the past five days, shares fell 1.76 percent, while year-to-date losses stand at 3.16 percent. Longer-term, LMT is up 2.30 percent over one year and 22.75 percent over five years.

Latest News About Lockheed Martin Stock

Lockheed announced roughly 200 layoffs in its Aeronautics unit earlier in 2025, part of a 1 percent workforce reduction (about 1,140 jobs from 122,000 employees) to address F-35 program delays and supply chain pressures. Speculation suggests additional cuts at the Greenville, South Carolina facility, possibly tied to the non-renewal of an F-16 maintenance contract, though details are unconfirmed. The company is offering outplacement support and career counseling to affected workers.

Despite domestic hurdles, Lockheed’s 117-jet F-16 backlog for clients like Bahrain, Slovakia, and Taiwan, within a $173 billion total backlog, remains a cornerstone of its global business.

Friday’s 0.42 percent gain reflects cautious optimism that layoffs will shore up margins, despite a 2.14 percent monthly drop. The 2.81 percent dividend yield and robust international orders likely supported shares, though F-35 order reductions continue to weigh on sentiment.

Also Read – With 248% Return in June, CRCL Market Cap Hits $54 Billion – What Lies Ahead?


Technical Analysis and Price Target Forecast for Lockheed Martin Stock in June 2025

LMT Candlestick Chart Trading View

LMT is trading in a tight range, with support at $435 and resistance at $475. The 50-day moving average sits slightly above current levels, and an RSI of 48 signals neutral-to-bearish momentum. MACD indicates consolidation, reflecting investor uncertainty following layoffs.

If Lockheed Martin’s stock price manages to break above the recent resistance level near $475, we believe it could trigger bullish momentum. In that case, the stock has the potential to rally toward $509, which is seen as the next major upside target based on historical chart patterns and previous consolidation zones.

On the downside, strong buying interest is expected if the stock price falls into the $430 to $420 range. This zone has previously acted as a solid support area, where institutional investors and long-term buyers tend to accumulate shares. It is considered a key level where the stock may find price stability during any market correction.


What Is the Market Sentiment for Lockheed Martin Stock?

Sentiment remains cautiously optimistic. Lockheed’s $173 billion backlog and 2.81 percent dividend yield attract institutional investors, but layoffs, a 2.14 percent monthly decline, and F-35 uncertainties dampen enthusiasm. Geopolitical tensions support long-term demand, though U.S. budget cuts and policy shifts add risks.

Key Financial Metrics of Lockheed Martin Stock in June

According to Yahoo Finance, Lockheed trades at a forward P/E of 17.24 and a trailing P/E of 20.28. Its market cap is $110.25 billion, with an enterprise value of $128.75 billion. The PEG ratio is 1.71, and the price-to-book ratio is 16.50, positioning LMT as a premium defensive stock.

Lockheed Martin has approximately 252 million shares outstanding as of mid-2025, stable after modest share repurchasing.


Is Lockheed Martin Stock a Good Choice Right Now?

This article does not offer investment advice. Key considerations include:

Positives:

  • $173 billion backlog, including 117 F-16s
  • 2.81 percent dividend yield for income stability
  • Cost-cutting to protect margins

Negatives:

  • Layoffs and 2.14 percent monthly decline
  • F-35 order cuts and program delays
  • U.S. budget and policy uncertainties

This article is for informational purposes only and should not be considered financial advice. Investing in stocks, cryptocurrencies, or other assets involves risks, including the potential loss of principal. Always conduct your own research or consult a qualified financial advisor before making investment decisions. The author and publisher are not responsible for any financial losses incurred from actions based on this article. While efforts have been made to ensure accuracy, economic data and market conditions can change rapidly. The author and publisher do not guarantee the completeness or accuracy of the information and are not liable for any errors or omissions. Always verify data with primary sources before making decisions.