Figure Technology Solutions (FIGR) Stock Forecast 2030 and 2035

Figure Technologies went public on September 11, 2025, pricing its IPO at $25 per share and raising $787.5 million. The offering valued the company at $5.3 billion, and shares debuted on Nasdaq under the ticker "FIGR," closing the first day trading over 40% above IPO price.

Figure Technology Solutions, trading under the ticker FIGR on Nasdaq, is a pioneering fintech company leveraging blockchain technology for lending and digital asset marketplaces.

ItemDetails
TickerFIGR
CEOMike Cagney
Founded2018
SectorFinancials
IndustryCredit Services, Fintech, Crypto
IPO DateSeptember 11, 2025
IPO Price$25/share
Valuation$5.3 billion (post-IPO)
PeersSOFI, UPST, LC, AFRM, BlockFi, COIN, HOOD, BLND, PGY, Figure AI
Figure Technologies is a blockchain lender and marketplace operator. Its platform enables consumer and institutional lending, especially home equity loans, by automating and tokenizing those transactions through blockchain.

Founded in 2018 by Mike Cagney, who previously co-founded SoFi, Figure went public on September 11, 2025, raising $787.5 million at an initial public offering price of $25 per share, which valued the company at $5.3 billion. Figure has originated over $16 billion in home equity loans and secured partnerships with more than 160 global institutions, positioning itself as a leader in AI-driven, blockchain-enabled lending.

Also Read – What is Blockchain in Cryptocurrency?

As a newly listed company, Figure’s stock price outlook for 2030 and 2035 depends on market trends, regulatory developments in cryptocurrency, and macroeconomic conditions, including U.S. policies on digital assets. This analysis projects Figure’s growth, identifies key headwinds and tailwinds, and compares it to peers, including Circle Internet Group.

Headwinds for Figure Tech

Figure Technology faces several headwinds that could challenge its growth trajectory. Regulatory uncertainty remains a major factor, as changes in policy can quickly alter profitability and expansion opportunities.

The company’s elevated revenue valuation, currently around four to six times earnings, could also raise skepticism among investors if growth slows. Competition is intensifying as decentralized finance (DeFi) players and traditional banks continue adopting similar technologies.

Additionally, custody and compliance burdens pose ongoing operational challenges, while sector volatility leaves Figure exposed to sudden market shifts and the potential for execution missteps.

Tailwinds for Figure Tech

Despite these challenges, Figure enjoys strong tailwinds that are helping drive its growth.

U.S. regulatory reforms introduced in 2025, including the GENIUS Act and supportive Trump administration crypto policies, have improved institutional confidence in fintech innovation. Investor appetite for blockchain lending, artificial intelligence-driven automation, and real-world asset tokenization has reached record levels.

Figure has also distinguished itself by processing loans in just ten days compared with an industry average of forty-two days, which has significantly boosted adoption and originations. The company’s rapid scaling is evident in its $29 million profit in 2025, a sharp turnaround from a $15 million loss in 2024, highlighting robust operational momentum.

Growth in Nasdaq and Fintech Peers

The Nasdaq fintech sector as a whole is projected to maintain a CAGR of 16.2% through 2032, while the global blockchain lending market is expected to grow even faster at 43.65% over the same period.

Peer fintech companies such as SoFi, Upstart, LendingClub, Robinhood, Coinbase, and Affirm historically achieved CAGR ranges of 15% to 29% in revenue during their rapid expansion years. Platforms that integrate artificial intelligence, blockchain, and lending are positioned to benefit the most from this wave of growth.

Also Read – 3 Important Differences Between Cryptography and Blockchain

Five-Year and Ten-Year FIGR Stock and Revenue Outlook

In 2025, Figure’s valuation stood at around $5.3 billion, with projected revenue of approximately $350 million.

Stock Price Prediction – 2030

Assuming a 30% revenue CAGR, which is slightly below the 35% average of peers like SoFi (33%), Upstart (37%), and Affirm (40%), Figure’s revenue could reach approximately $871 million by 2030. If we apply a 12x price-to-sales multiple, consistent with peer averages, this projects a stock price in the range of $120 to $150. Such an outlook implies a 25% to 35% annualized return, significantly outpacing the Nasdaq’s historical 15% CAGR.

In a bullish scenario, the stock could rise as high as $200, supported by favorable regulatory policies and accelerated Web3 adoption.

On the other hand, a bearish case of around $100 is possible if housing markets weaken or if governments introduce restrictive crypto regulations.

Stock Price Prediction – 2035

Looking further ahead, by 2035, Web3 adoption could be more mainstream, opening stronger growth opportunities for Figure.

At a conservative 25% CAGR, revenue could reach around $2.1 billion, while at the higher peer average of 35%, it could grow to $3.8 billion.

Applying a 10x price-to-sales multiple suggests a stock price range of $300 to $400, with the broader forecast falling between $250 and $500, depending on the pace of blockchain adoption.

Also Read – I Created the Best Bitcoin Guide You’ll Ever Read

How is Circle company different from Figure Technologies?

Circle Internet Group and Figure Technologies are both top fintechs using blockchain, but their focus areas are distinct. 

Circle is a global payments and crypto infrastructure company best known for issuing USD Coin (USDC), a leading stablecoin, and building systems for fast, secure, cross-border transactions. Its core market is digital payments and enabling businesses to use stablecoins securely.

In contrast, Figure Technologies specializes in blockchain-powered lending, particularly home equity loans, and tokenizing financial assets. Figure’s strength is automating credit origination, asset trading, and capital market processes through blockchain, making lending faster and more transparent.

In short, Circle powers digital payments and stablecoin markets, while Figure makes lending and asset trading easier via blockchain – two different innovation tracks within financial technology.

CompanyFocusCore ProductMarket Position
CirclePaymentsUSDC StablecoinGlobal, infrastructure
FigureLendingHome equity loansAI, blockchain-powered lending

Can you buy FIGR stock?

Yes, you can buy FIGR stock as it is listed on Nasdaq and available for trading through registered brokers.

This article is for informational purposes only and should not be considered financial advice. Investing in stocks, cryptocurrencies, or other assets involves risks, including the potential loss of principal. Always conduct your own research or consult a qualified financial advisor before making investment decisions. The author and publisher are not responsible for any financial losses incurred from actions based on this article. While efforts have been made to ensure accuracy, economic data and market conditions can change rapidly. The author and publisher do not guarantee the completeness or accuracy of the information and are not liable for any errors or omissions. Always verify data with primary sources before making decisions.

First Circle, Now Ripple Applies for OCC Charter

Circle, the issuer of the USDC stablecoin, kicked off a transformative trend by applying for a national banking charter from the U.S. Office of the Comptroller of the Currency (OCC) on June 30, 2025.

Now, Ripple, the privately held company behind the RLUSD stablecoin, has followed suit with its own OCC application on July 2, 2025. These moves signal a seismic shift in the crypto industry’s push to integrate with traditional finance, leveraging a crypto-friendly regulatory climate under the Trump administration to gain federal oversight.

Circle’s bid aims to establish First National Digital Currency Bank, N.A., allowing direct custody of its $61.5 billion USDC reserves, reducing dependence on third-party banks like BNY Mellon. Ripple’s application, paired with oversight from the New York Department of Financial Services, seeks to enhance trust in RLUSD and expand its XRP Ledger’s institutional use. Both companies are capitalizing on the OCC’s recent crypto custody rule, which permits banks to manage digital assets without prior approval, paving the way for broader services like institutional crypto custody.

The timing aligns with growing legislative momentum, including the proposed GENIUS Act for stablecoin regulation, which could further legitimize crypto in mainstream finance. Yet, challenges like regulatory scrutiny and market volatility loom. As Circle and Ripple, the latter still a private entity, pursue banking charters, their efforts could redefine the convergence of decentralized finance and regulated banking, setting a new standard for the crypto industry’s evolution.

This article is for informational purposes only and should not be considered financial advice. Investing in stocks, cryptocurrencies, or other assets involves risks, including the potential loss of principal. Always conduct your own research or consult a qualified financial advisor before making investment decisions. The author and publisher are not responsible for any financial losses incurred from actions based on this article. While efforts have been made to ensure accuracy, economic data and market conditions can change rapidly. The author and publisher do not guarantee the completeness or accuracy of the information and are not liable for any errors or omissions. Always verify data with primary sources before making decisions.

Circle Internet Group Unveils Circle Gateway, Driving CRCL Stock Higher

CRCL's USDC

New York || 4:54 p.m. ET – Circle Internet Group, Inc. (NYSE: CRCL), the issuer behind the world’s second-largest stablecoin USDC, announced the upcoming launch of Circle Gateway, a major crosschain breakthrough for stablecoin transfers. CRCL stock closed Tuesday at $192.53, gaining $11.50 or 6.3% on the session, supported by renewed investor optimism around Circle’s innovation roadmap and the recent passage of the GENIUS Act.

Solving the Multichain Challenge

The blockchain ecosystem has long been fragmented across networks like Ethereum, Solana, and Avalanche. Users holding USDC on one chain often face delays and added costs to move funds to another, relying on bridges or third-party liquidity providers. These hurdles slow stablecoin adoption and complicate operations for exchanges, payment processors, and institutions.

Circle Gateway, announced on July 1, 2025, aims to eliminate this fragmentation by introducing a unified USDC balance through a non-custodial smart contract. This structure will allow users to instantly access their USDC across multiple blockchains, removing the need for manual bridging or rebalancing liquidity.

Also Read – CRCL’s USDC & FI’s FIUSD – The Stablecoin Business Model Everyone Should Understand

How Circle Gateway Works

Circle Gateway’s approach is designed for simplicity and efficiency:

  • Users deposit USDC into a non-custodial smart contract
  • A single balance is created, instantly accessible on supported chains
  • Transfers can happen in real time, without bridges or third-party intermediaries

The company plans to roll out the new service on testnets for Avalanche, Base, and Ethereum later this month, with additional blockchain integrations expected in the future.

CRCL Stock Momentum Remains Strong

CRCL shares have surged since Circle’s June 5, 2025 IPO, which was priced at $31 and closed its first trading day at $83.23, up 168%. On Tuesday, July 1, 2025, the stock closed at $192.53 after hitting an intraday high of $194.32 and a low of $171.50, with trading volume exceeding 30.9 million shares. The market capitalization stands around $69 billion, reflecting sustained confidence in Circle’s stablecoin leadership, partnerships, and regulatory focus.

Broader Vision for Stablecoins

Founded in 2013, Circle is committed to making digital dollars as easy and reliable as email. USDC, with a circulating supply around $61.4 billion, is the second-largest stablecoin globally. Circle also offers EURC, a euro-backed stablecoin, and USYC, a tokenized money market fund (not available in the United States).

The company operates the Circle Payments Network, supports crosschain protocols, and holds key regulatory licenses, including approval from the New York Department of Financial Services and the Bermuda Monetary Authority. These compliance measures, paired with monthly attestations from a Big Four auditor, reinforce user trust and institutional confidence.

Conclusion

Circle Gateway marks an important step forward for chain-agnostic stablecoin transfers, providing seamless, instant USDC access across multiple blockchains. As Circle begins its testnet rollout this month, developers, businesses, and investors will be watching closely to see how this technology may transform the future of digital finance.

This article is for informational purposes only and should not be considered financial advice. Investing in stocks, cryptocurrencies, or other assets involves risks, including the potential loss of principal. Always conduct your own research or consult a qualified financial advisor before making investment decisions. The author and publisher are not responsible for any financial losses incurred from actions based on this article. While efforts have been made to ensure accuracy, economic data and market conditions can change rapidly. The author and publisher do not guarantee the completeness or accuracy of the information and are not liable for any errors or omissions. Always verify data with primary sources before making decisions.
Circle Crashes 39% from All-Time High, Nearly $27 Billion in Value Erased

Why is NEGG stock falling?

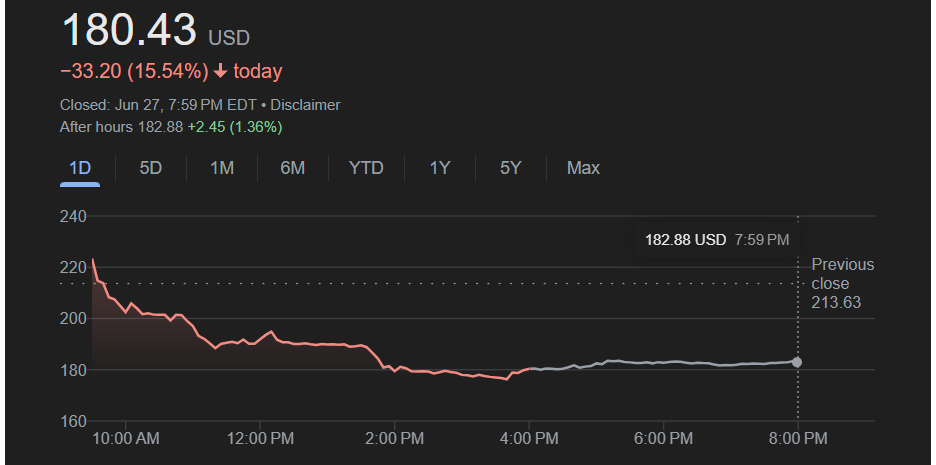
Circle Internet Group Inc. (NYSE: CRCL) closed Friday at $180.43, down 15.54% on the day and ending a bruising week with a 24.91% weekly decline.

Since touching an all-time high of $298.99 on Monday after announcing a major partnership with Fiserv, the stock has seen relentless selling pressure. CRCL attempted a modest rebound of 7.56% on Thursday but could not sustain the momentum, breaking down again Friday to finish near session lows.

CRCL Friday's Closing

Friday’s trading opened at $223.65 and reached an early high at the same level before collapsing to an intraday low of $175.60. After-hours prices recovered slightly to $182.88, up 1.36%, but market confidence remains weak. The company’s market capitalization has shrunk to $40.15 billion from its Monday peak of roughly $67 billion, wiping out nearly $27 billion in value in just five trading days.

Also Read – 5 Reasons Circle (CRCL) Stock Is Crashing as It Touches the $200 Mark

According to Yahoo Finance, Circle’s valuation metrics remain stretched despite the correction. Its trailing P/E ratio stands at 2,070, with a forward P/E of 128.21, and a lofty price-to-book ratio of 53.90. These numbers underline investor concerns about overheating.

Since its IPO price of $31, CRCL has still delivered a staggering return of approximately 481% even at $180.43, reflecting the scale of the prior rally.

Technical Outlook for Monday

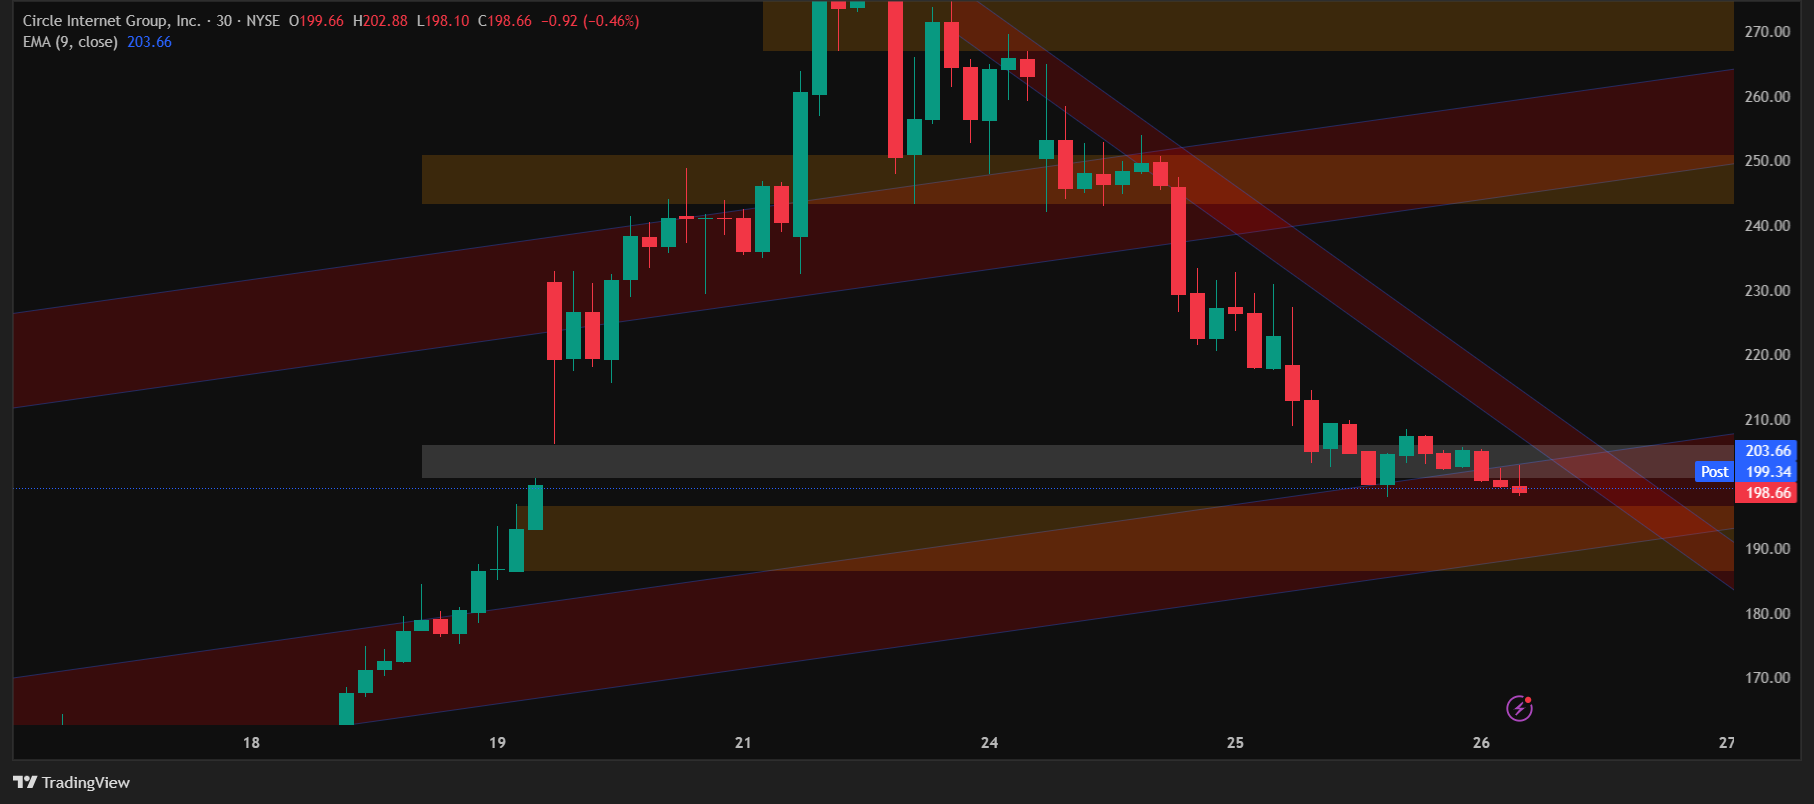
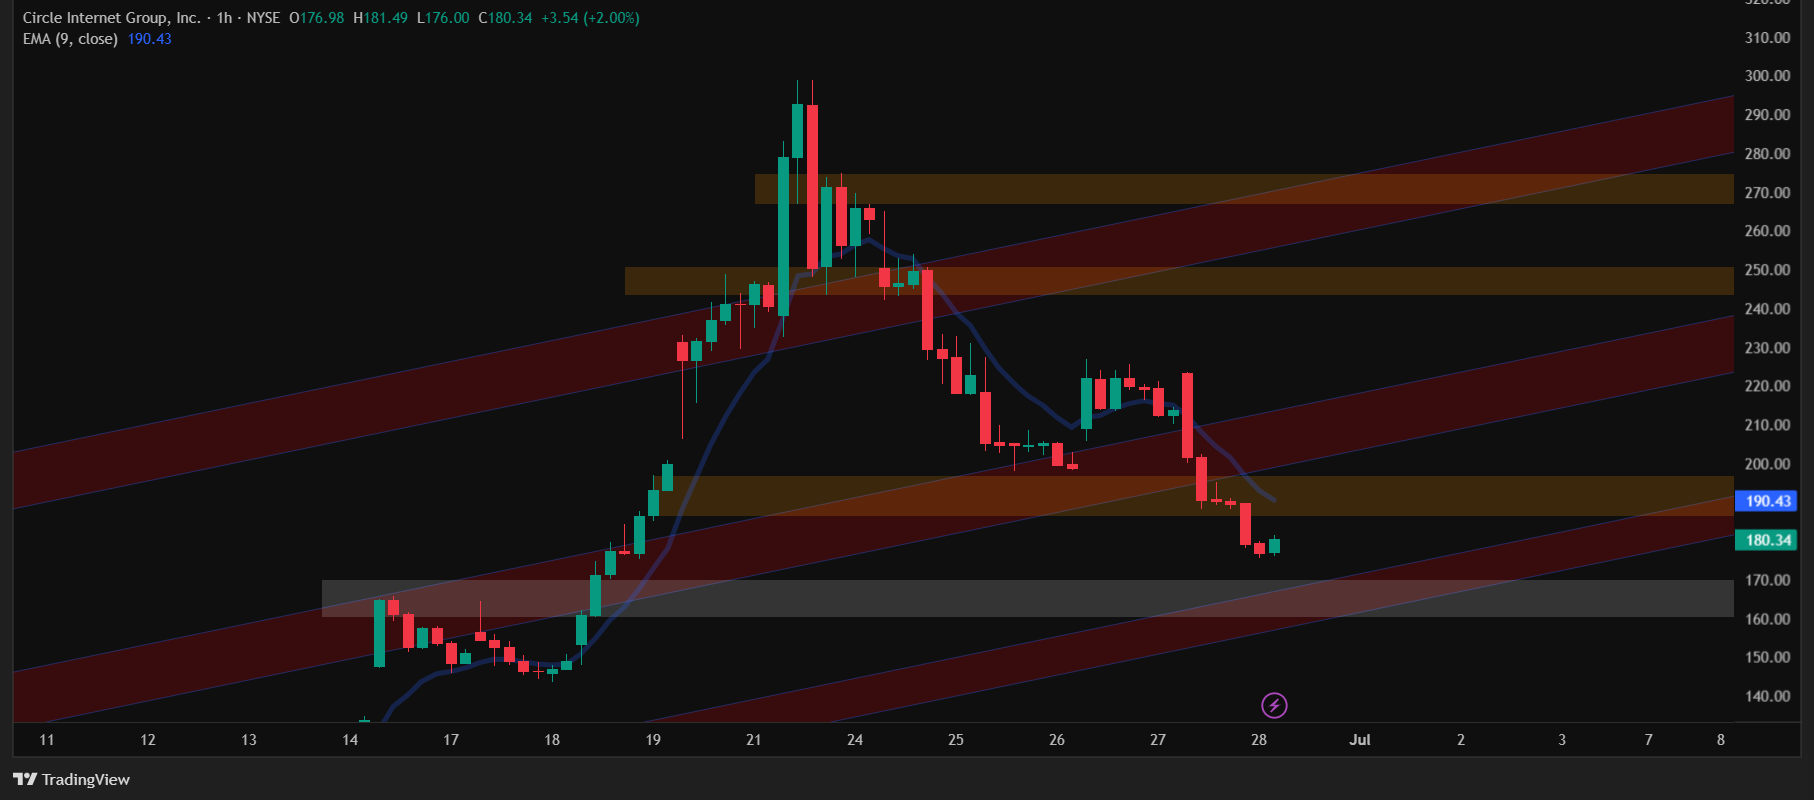
CRCL’s price chart is showing concerning weakness. The stock decisively broke through its first parallel channel support in the 190–200 zone, which had served as a critical technical level earlier in the week.

With Friday’s deep close, CRCL is now trading inside a second parallel channel, bounded by 170–160 as crucial support. If this lower channel fails to hold, the next significant levels could be much deeper.

CRCL candlestick chart by trading view

Short-term resistance is likely to emerge near 190, coinciding with the broken prior support, while the upper band of the current channel around 205–210 will serve as a major resistance level on any meaningful bounce.

How Much Will It Fall?

Given the severe weekly drop of nearly 25% and a 39.65% collapse from Monday’s all-time high, sentiment is highly fragile. If CRCL cannot hold above the 170–160 channel support early next week, the decline could accelerate toward 150 or lower in a washout phase.

At the same time, the Relative Strength Index is hovering around 35 on the hourly timeframe, approaching oversold territory. That could temporarily slow the decline.

For now, the chart suggests a bearish bias with the potential to retest the 170–160 zone.

Valuation Still in Question

Circle’s valuation metrics are extremely rich compared to traditional fintech peers. A trailing P/E above 2,000, forward P/E over 128, and price-to-book ratio of nearly 54 put its fundamentals under intense scrutiny. Combined with a collapse in technical structure and critical comments from the Bank for International Settlements (BIS) questioning the long-term viability of stablecoins, CRCL’s profile has shifted from high-flying to highly vulnerable in a matter of days.

As of now, Circle’s massive run from its $31 IPO to $298.99 on Monday, a 864% gain at the top, is experiencing a harsh reality check. Even after falling to $180.43, the stock retains an approximate 481% return from IPO, underscoring just how inflated the price had become.

This article is for informational purposes only and should not be considered financial advice. Investing in stocks, cryptocurrencies, or other assets involves risks, including the potential loss of principal. Always conduct your own research or consult a qualified financial advisor before making investment decisions. The author and publisher are not responsible for any financial losses incurred from actions based on this article. While efforts have been made to ensure accuracy, economic data and market conditions can change rapidly. The author and publisher do not guarantee the completeness or accuracy of the information and are not liable for any errors or omissions. Always verify data with primary sources before making decisions.

Why Is CRCL Stock Going Up? – Is It Just a Minor Pullback?

CRCL Bounces 14% – Is This Rally for Real or Just a Technical Rebound?

Circle Internet Group Inc. (NYSE: CRCL) surged over 14% in early trading on Thursday, rising $28.33 to hit $226.95. This sharp rebound comes after the stock closed at $198.62 the previous day – marking a three-day plunge totaling 33.78% from Monday’s peak of $298.99. Today’s price action has pushed Circle’s market cap back up to approximately $49.03 billion, compared to Tuesday’s low of $43.8 billion.

Also Read – 5 Reasons Circle (CRCL) Stock Is Crashing as It Touches the $200 Mark

The rally appears to be a technical pullback, following a steep sell-off that wiped out nearly $24 billion in market capitalization within 72 hours. While traders and investors are watching closely, many are wondering: Is this the bottom – or just a pause before more downside?


A Closer Look: Is CRCL Stock Out of Danger?

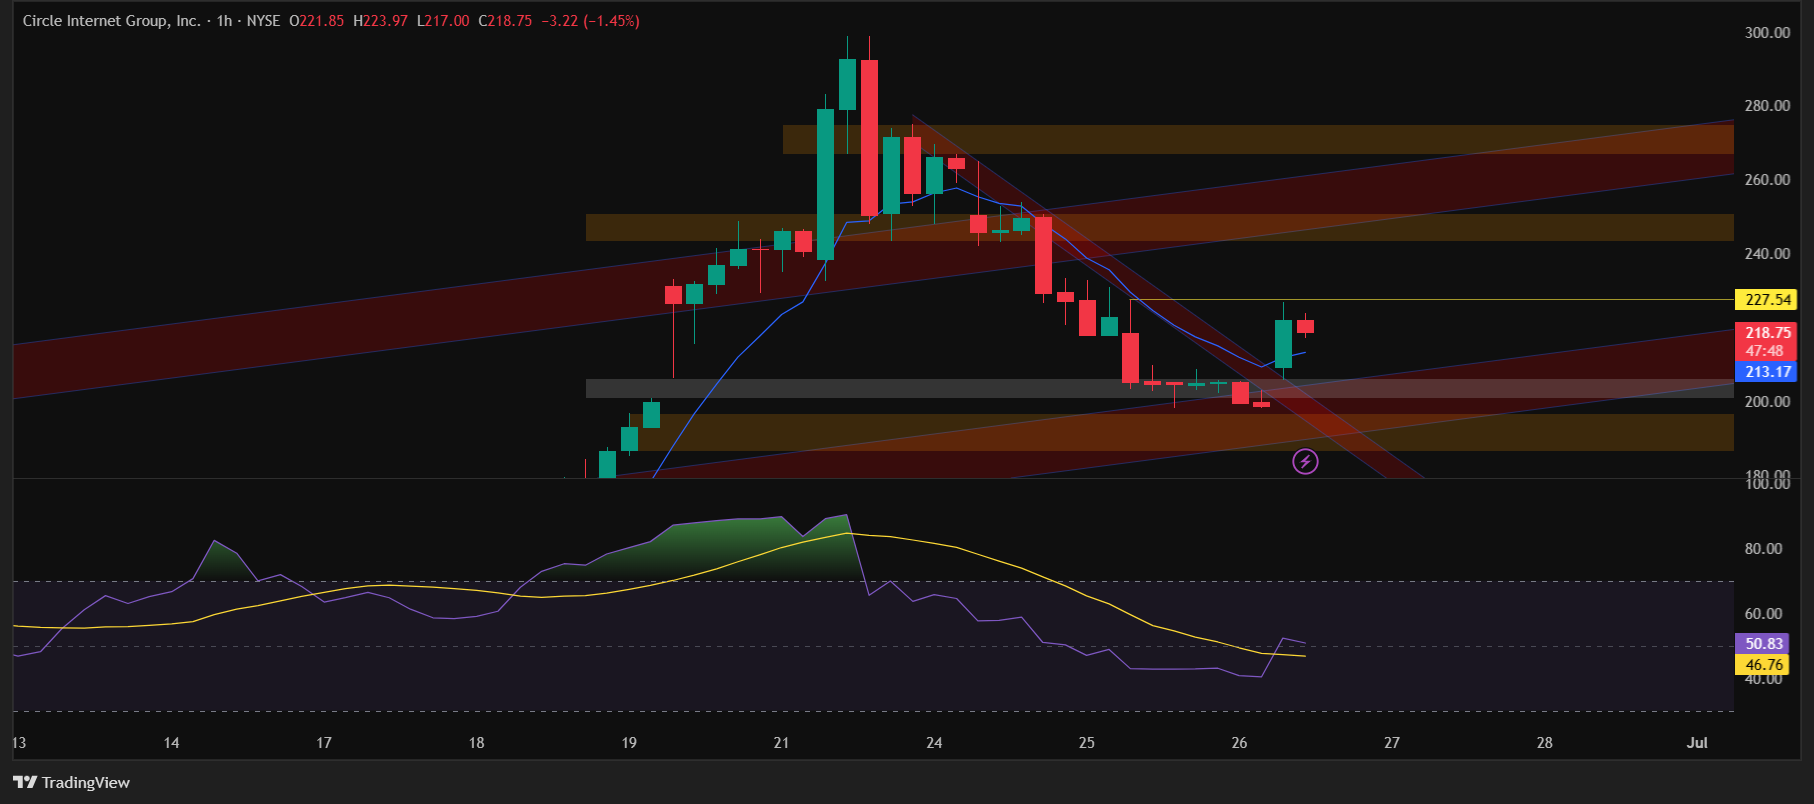
For investors hopeful that Circle’s worst days are over, the answer isn’t so simple. According to recent candlestick chart patterns, CRCL is not in confirmed bullish territory yet. Technically, the stock is still in correction mode and is only rebounding from a critical support zone between $198–$206.

CRCL Technical Analysis – Candlestick Chart by TradingView

To regain a bullish outlook, Circle needs to sustain above $250 – a key resistance level – for several sessions. Until then, price action may stay confined to a parallel channel that appears to be forming between $206 and $255. This range-bound movement is consistent with what has previously been observed in CRCL’s chart structure.

The stock briefly broke above a minor trendline, indicating short-term momentum. However, there is a high probability that price could retest the 9-day EMA, which currently sits at $194.85 on the daily timeframe. At the time of writing, the stock is showing some rejection near the previous session’s high, suggesting buyers are cautious around resistance zones.

Meanwhile, the RSI (Relative Strength Index) is hovering around 50, indicating neither overbought nor oversold conditions. For a stronger reversal confirmation, RSI would ideally need to bounce from near-oversold levels with increasing momentum.

Also Read – CRCL’s USDC & FI’s FIUSD – The Stablecoin Business Model Everyone Should Understand


This intraday spike may provide short-term relief, but given the volatility and broader market reaction to stablecoin regulation updates – including the BIS report that criticized the viability of stablecoins — investors should remain alert. Technical setups hint at continued volatility unless CRCL reclaims and holds higher levels with strong volume.


This article is for informational purposes only and should not be considered financial advice. Investing in stocks, cryptocurrencies, or other assets involves risks, including the potential loss of principal. Always conduct your own research or consult a qualified financial advisor before making investment decisions. The author and publisher are not responsible for any financial losses incurred from actions based on this article. While efforts have been made to ensure accuracy, economic data and market conditions can change rapidly. Always verify data with primary sources before making decisions.

One More Reason Fuels the CRCL Crash – $24 Billion Wiped Out So Far

Circle Internet Group Inc. (NYSE: CRCL) extended its dramatic downtrend for a third consecutive session, closing at $198.62, down 10.79% from yesterday’s close. This sharp decline follows two straight days of losses and now amounts to a weekly drop of 17.3%, wiping out nearly $24 billion in market capitalization from Monday’s intraday peak of $298.99, when CRCL’s valuation briefly touched $67 billion.

Today, the market closed with a strong bearish marubozu candle, signaling relentless selling pressure throughout the session. CRCL opened at $218.54, reached an intraday high of $227.54, but sold off aggressively to a session low of $198.00.

Also Read – 4 Reasons Circle (CRCL) Stock is Crashing – Will It Hit $200 Next?


What Triggered This Latest Selloff?

Wednesday’s drop was fueled by a fresh macro headwind: a critical report by the Bank for International Settlements (BIS) – the global financial institution owned by 63 central banks, including the U.S. Federal Reserve, ECB, and Bank of Japan. Often called the “central bank of central banks,” the BIS holds significant sway over global monetary policy perspectives.

In its newly published analysis, the BIS acknowledged the value of tokenization – the process of converting real-world assets or fiat currencies into digital tokens for use on blockchain networks – but dismissed stablecoins like USDC as insufficient for systemic financial infrastructure.

Also Read – 3 Important Differences Between Cryptography and Blockchain

According to the report,

stablecoins offer some promise on tokenization, but fall short of requirements to be the mainstay of the monetary system when set against the three key tests of singleness, elasticity, and integrity.”

This statement undermines the foundational business case for Circle’s USDC, which boasts a $61.9 billion market cap and processed $2.61 trillion in annual transaction volume, positioning itself as the go-to stablecoin for regulated financial rails.

Also Read – CRCL’s USDC & FI’s FIUSD – The Stablecoin Business Model Everyone Should Understand


Valuation and Institutional Rotation Add to Pressure

Wednesday’s fall adds to existing concerns that began mounting earlier in the week. On Monday, CRCL reached an intraday high of $298.99, reflecting a 750% gain from its $31 IPO price. However, that surge was quickly followed by heavy institutional selling.

Leading the exit was Cathie Wood’s ARK Invest, which sold 415,844 CRCL shares worth $109.6 million on June 23 and booked a total of $352 million in profits. While ARK still holds 3.2 million shares, accounting for 7.8% of its ARKW fund, the strategic shift in favor of Coinbase (COIN) – a firm with stronger diversification, scaling infrastructure via its Base Layer 2 network – shows a clear reallocation of fintech exposure.


Technical Breakdown: All Eyes on $188–$190

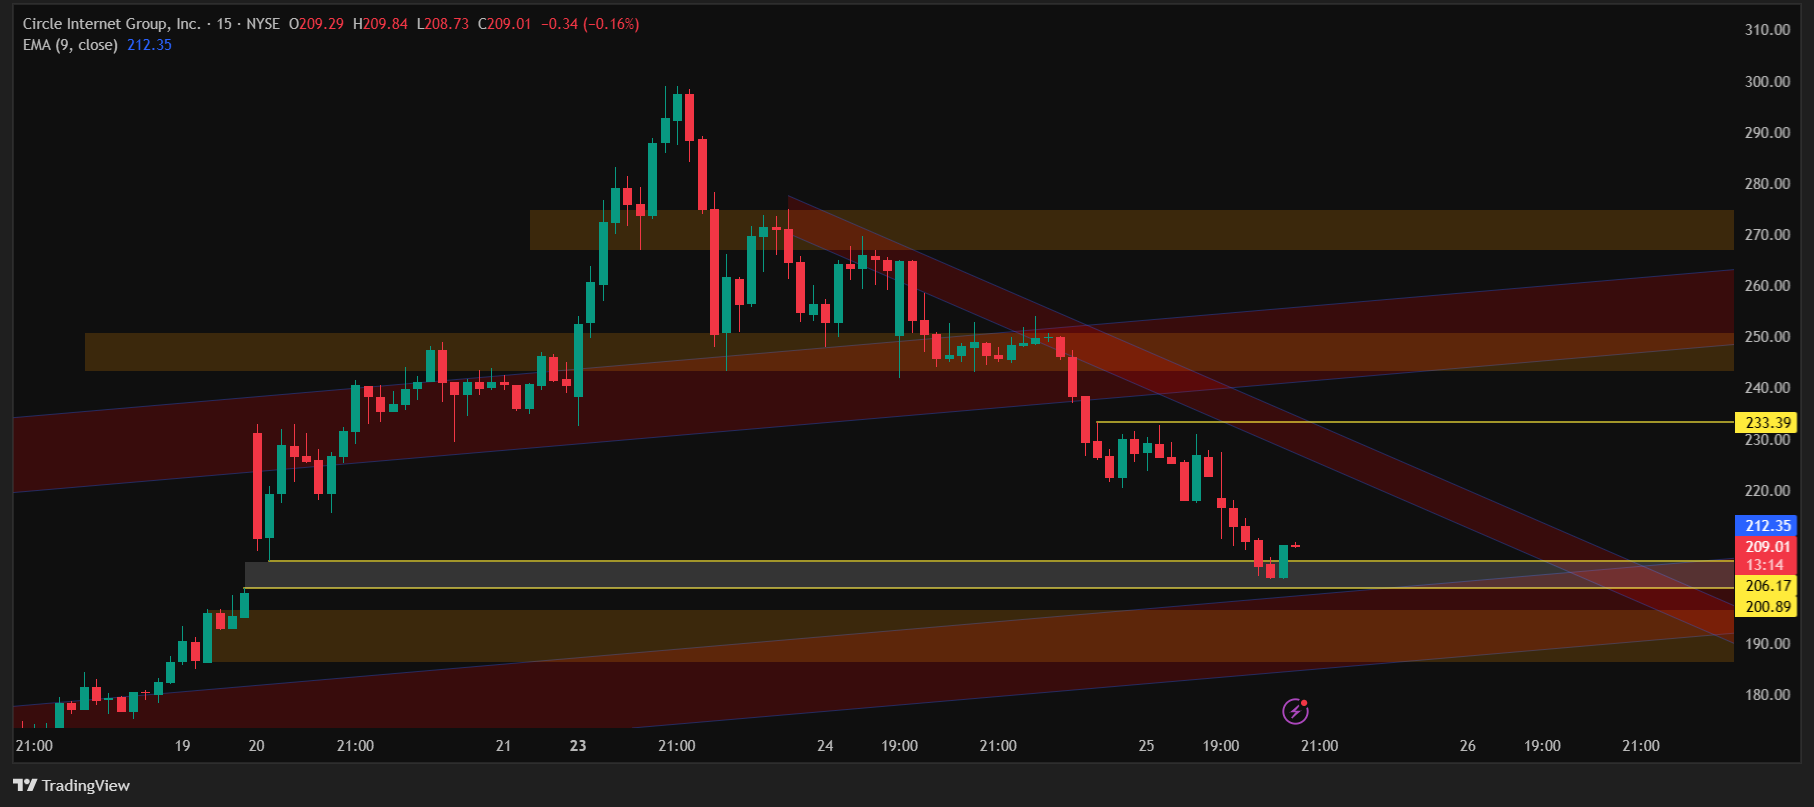
On the technical front, CRCL has now filled the price gap between $200–$206, a zone previously highlighted by us as an inevitable magnet for price correction. The stock is now hovering at a critical confluence zone around $198–$200, where technical and geometric support levels meet.

CRCL candlestick chart by trading view

The 9-day EMA on the daily chart sits near $188–$190, a zone that could act as the next key support if selling continues. Any bounce toward $200–$205 would need strong volume confirmation to reverse the bearish trend.

The Relative Strength Index (RSI) on the daily timeframe is currently at 40.43, just above the oversold threshold of 30. This suggests that while the stock has weakened considerably, it hasn’t yet hit panic-selling levels typically associated with technical reversals.


Summary

With the macro narrative turning cautious, regulatory uncertainty resurfacing, and key support zones being tested, CRCL’s near-term trajectory remains volatile. While Circle’s fundamentals – including its USDC dominance, partnerships with Fiserv, and regulatory leadership – remain strong, the market is clearly entering a valuation reset phase.

Also Read – USDC vs. RLUSD vs. USDT – Key Differences and Why They Matter


This article is for informational purposes only and should not be considered financial advice. Investing in stocks, cryptocurrencies, or other assets involves risks, including the potential loss of principal. Always conduct your own research or consult a qualified financial advisor before making investment decisions. The author and publisher are not responsible for any financial losses incurred from actions based on this article. While efforts have been made to ensure accuracy, economic data and market conditions can change rapidly. The author and publisher do not guarantee the completeness or accuracy of the information and are not liable for any errors or omissions. Always verify data with primary sources before making decisions.
Circle Fills the Gap Between $200–$206 as Stock Sinks 9% and Market Cap Drops $5 Billion

CRCL Bounces 14% – Is This Rally for Real or Just a Technical Rebound?

Circle Internet Financial Ltd. (NYSE: CRCL) took a beating on June 25, 2025, plunging 9% intraday to $202.60, extending its 7.48% mid-morning drop to $206.00.

Also Read – 4 Reasons Circle (CRCL) Stock is Crashing – Will It Hit $200 Next?

The slide filled a technical gap between $200-$206, formed during last week’s 750% rally from a $31 IPO to a $298.99 peak. CRCL’s market cap now stands at $44.79B, down $5B from Monday’s $49.1B. Trading volume hit 24.49M shares, signaling intense selling pressure.

Circle Stock Crashes 9% Intraday to $202.60. chart by tradingview

The drop aligns with Cathie Wood’s ARK Invest offloading $352M in CRCL shares.

From a technical standpoint, CRCL’s RSI is at 35, inching closer to the oversold threshold of 30. The gap between $200–$206, visible in last week’s rapid rally, has now been completely filled – a move often seen as a potential bounce zone for short-term traders. However, whether this leads to a reversal or a further slide toward the $190–$200 range remains uncertain.

With institutional profit-taking, valuation concerns, and broader risk sentiment affecting fintech stocks, Circle’s near-term trajectory may depend on buyers’ willingness to defend the $200 support level.

As of now, the technical structure suggests a likely retest of $190–$200 if the stock fails to hold above today’s lows. Analysts and traders will be closely watching the close for confirmation of strength or further downside.


This article is for informational purposes only and should not be considered financial advice. Investing in stocks, cryptocurrencies, or other assets involves risks, including the potential loss of principal. Always conduct your own research or consult a qualified financial advisor before making investment decisions. The author and publisher are not responsible for any financial losses incurred from actions based on this article. While efforts have been made to ensure accuracy, economic data and market conditions can change rapidly. The author and publisher do not guarantee the completeness or accuracy of the information and are not liable for any errors or omissions. Always verify data with primary sources before making decisions.
Cathie Says – CRCL Bye, COIN Hi – But Why?

Cathie Wood’s ARK Invest, known for bold tech bets.

Cathie Wood’s ARK Invest has stirred the market again – this time by trimming its position in Circle Internet Group (NYSE: CRCL) while boosting its stake in Coinbase (NASDAQ: COIN). On June 23, 2025, ARK sold 415,844 CRCL shares worth $109.6 million, part of a larger divestment totaling $352 million, according to reports from Cointelegraph.

CRCL Stock - latest news

What’s behind the rebalancing?

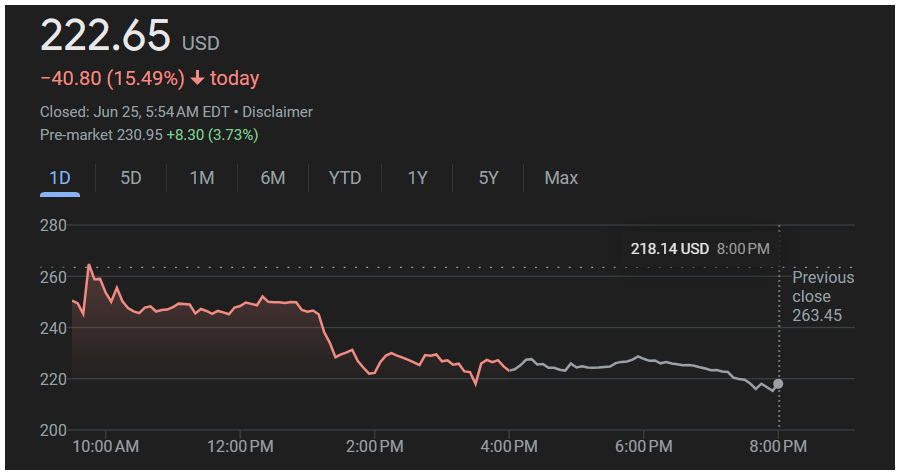
It’s a strategic pivot rooted in profit-taking after Circle’s explosive 750% rally from its $31 IPO price to an all-time high of $298.99, which briefly pushed its market cap to $67 billion. CRCL dropped 15.49% to $222.65 on tuesday, cutting its market cap to approximately $49.1 billion, with after-hours trading slipping further to $218.14.

At the time of writing, it is trading 3.90% higher at $232 in the pre-market session.

Also Read – 4 Reasons Circle (CRCL) Stock is Crashing – Will It Hit $200 Next?

Importantly, ARK hasn’t fully exited. It still holds 3.2 million CRCL shares, accounting for 7.8% of ARKW, signaling continued confidence in USDC (Circle’s flagship stablecoin). USDC currently boasts a $61.9 billion market cap and $2.61 trillion in annual transaction volume, according to CoinMarketCap.

However, CRCL’s P/E ratio of 238 and EV/EBITDA of 197.04 point to a stretched valuation. In contrast, Coinbase offers diversified exposure to the crypto ecosystem. ARK acquired 4,198 COIN shares worth $1.48 million, capitalizing on its $955.8 million Q1 2025 revenue, expanding Base Layer 2 network, and the broader 15% rally in Bitcoin.

While the GENIUS Act supports the stablecoin sector by clarifying U.S. regulations, ARK’s rotation into COIN appears to hedge against potential volatility and overvaluation in CRCL – balancing its fintech bet between infrastructure (COIN) and tokenization (CRCL).


This article is for informational purposes only and should not be considered financial advice. Investing in stocks, cryptocurrencies, or other assets involves risks, including the potential loss of principal. Always conduct your own research or consult a qualified financial advisor before making investment decisions. The author and publisher are not responsible for any financial losses incurred from actions based on this article. While efforts have been made to ensure accuracy, economic data and market conditions can change rapidly. The author and publisher do not guarantee the completeness or accuracy of the information and are not liable for any errors or omissions. Always verify data with primary sources before making decisions.

Circle Stock Rebounds 4.42% in Pre-Market Ahead of Wall Street Open – Can It Reclaim $250?

CRCL Bounces 14% – Is This Rally for Real or Just a Technical Rebound?

New York, 05:42 AM ET: Circle Internet Group Inc. (NYSE: CRCL) surged 4.42% to $232.48 in pre-market trading at 8:00 AM EDT, rebounding from Wednesday’s 15.49% plunge to $222.65 . The drop, extending a correction from a $298.99 peak on June 23, wiped $18B off CRCL’s market cap, now $49B. Investors are eyeing Circle’s USD Coin (USDC), with $2.61T in 2024 transactions, as a stabilizing force.

CRCL price chart

The recovery follows a brutal two-day slide, sparked by Cathie Wood’s ARK Invest selling 1.7M CRCL shares for $352M. Despite CRCL’s 750% rally since its $31 IPO on June 5, 2025, its P/E of 238 signals overvaluation.

Also Read – 4 Reasons Circle (CRCL) Stock is Crashing – Will It Hit $200 Next?

A Fiserv partnership for USDC payments and the GENIUS Act’s regulatory clarity bolster confidence, yet Wednesday’s bearish marubozu candlestick and RSI at 40.77 highlight caution.

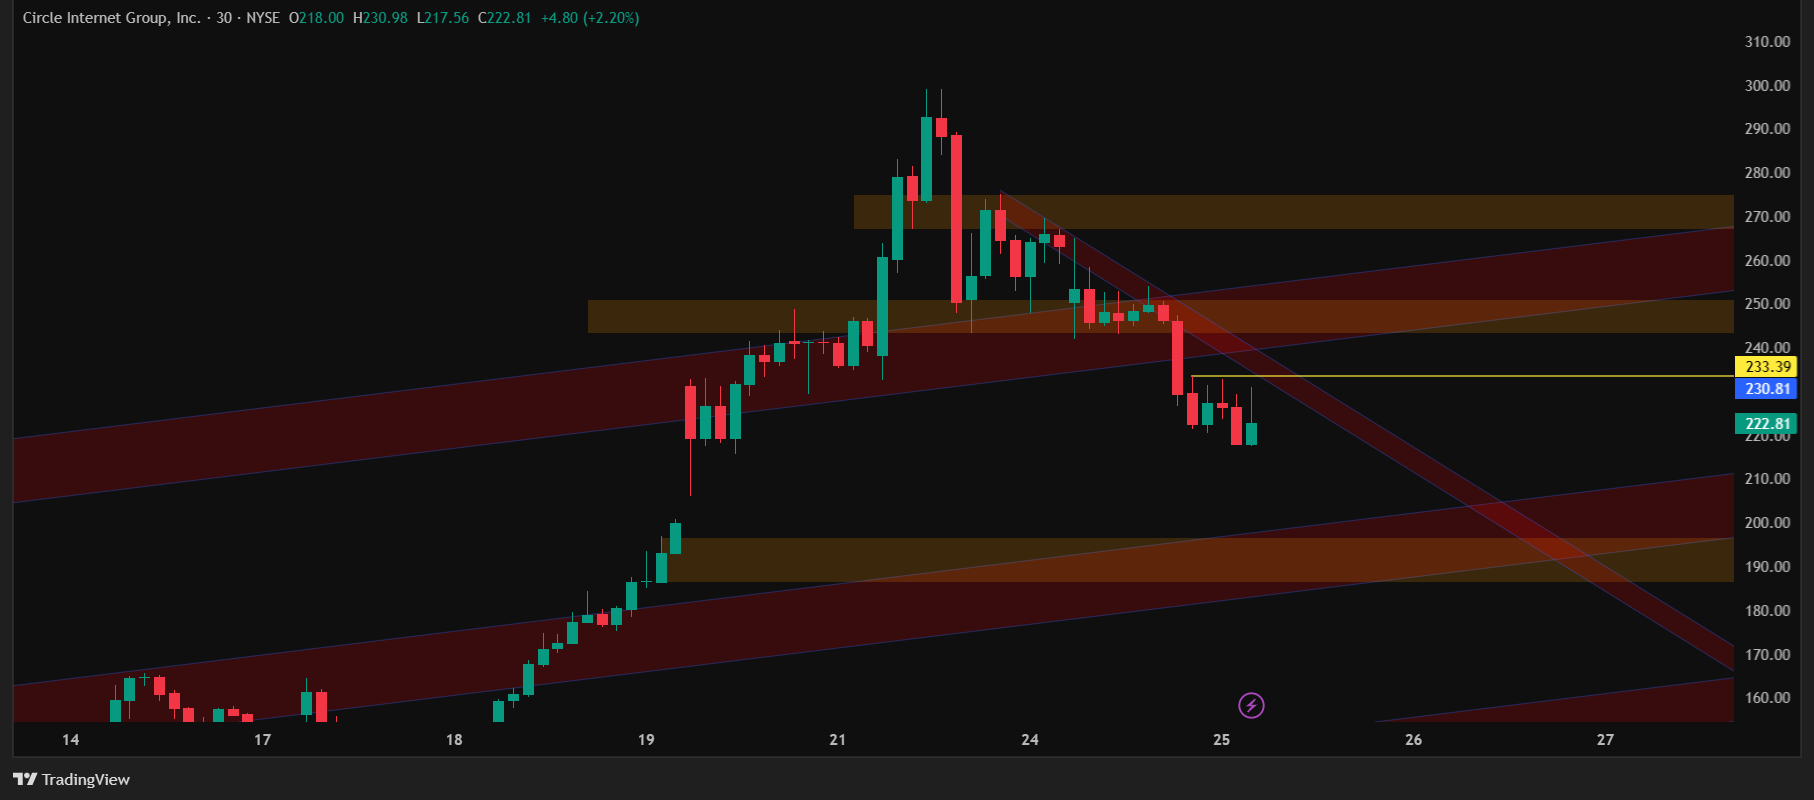
CRCL breached $245-$250 support, retracing to $230 (hourly 9EMA). The daily 9EMA at $186.55 nears a $185-$205 support zone, while $243-$250 is now major resistance, with $233-$238 as a minor hurdle.

RSI at 40.77 suggests potential to fill a $206 gap or test $200, but pre-market strength hints at a $200-$250 range.

This article is for informational purposes only and should not be considered financial advice. Investing in stocks, cryptocurrencies, or other assets involves risks, including the potential loss of principal. Always conduct your own research or consult a qualified financial advisor before making investment decisions. The author and publisher are not responsible for any financial losses incurred from actions based on this article. While efforts have been made to ensure accuracy, economic data and market conditions can change rapidly. The author and publisher do not guarantee the completeness or accuracy of the information and are not liable for any errors or omissions. Always verify data with primary sources before making decisions.
CRCL Wipes Out $5 Billion in Market Value, Drops to $49 Billion – Is a Deeper Slide Coming?

Why is NEGG stock falling?

Circle Internet Financial Ltd. (NYSE: CRCL), the fintech powerhouse behind the USDC stablecoin, has hit a rough patch. On Tuesday, June 25, its stock plummeted 15.49%, closing at $222.65 – down from Monday’s close of $263.50. This sharp decline erased nearly $5 billion from its market capitalization, leaving it at $49.1 billion.

The stock opened at $250.42 – a key support level – before sinking to an intraday low of $217.58. After hours, it dipped further to $218.14, shedding another 2.03% ($4.51). Despite this tumble, CRCL remains up an impressive 42.40% over the past five days, though the recent drop has investors questioning whether the worst is yet to come.

Also Read – 4 Reasons Circle (CRCL) Stock is Crashing – Will It Hit $200 Next?

Cathie Wood’s ARK Invest Shakes Up the Market

The financial world buzzed with news of Cathie Wood’s ARK Invest, a prominent ETF provider, unloading a significant chunk of CRCL stock. Instead, Wood redirected capital into Robinhood (HOOD) and Coinbase (COIN) shares – a move that’s amplified the bearish sentiment around CRCL. ARK’s decisions often sway market trends, and this sell-off has contributed to the stock’s downward spiral.

The timing is notable: Monday saw CRCL surge 25% to an intraday peak of $298.99 on news of a partnership with Fiserv, only to crash 11.9% from that high. Tuesday’s 17.89% drop from an intraday peak of $265 to the low of $217.58 underscores the volatility gripping the stock.

Technical Breakdown: Bearish Signals Dominate

CRCL stock candlestick chart showing recent price movements, support and resistance levels, displayed on TradingView platform.

The charts tell a grim story. Tuesday’s close featured a bearish marubozu candlestick – a sign of unrelenting selling pressure. The stock, now at $222.50, has breached its critical $245-250 support zone and retraced to $230, aligning with the 9EMA on the hourly timeframe.

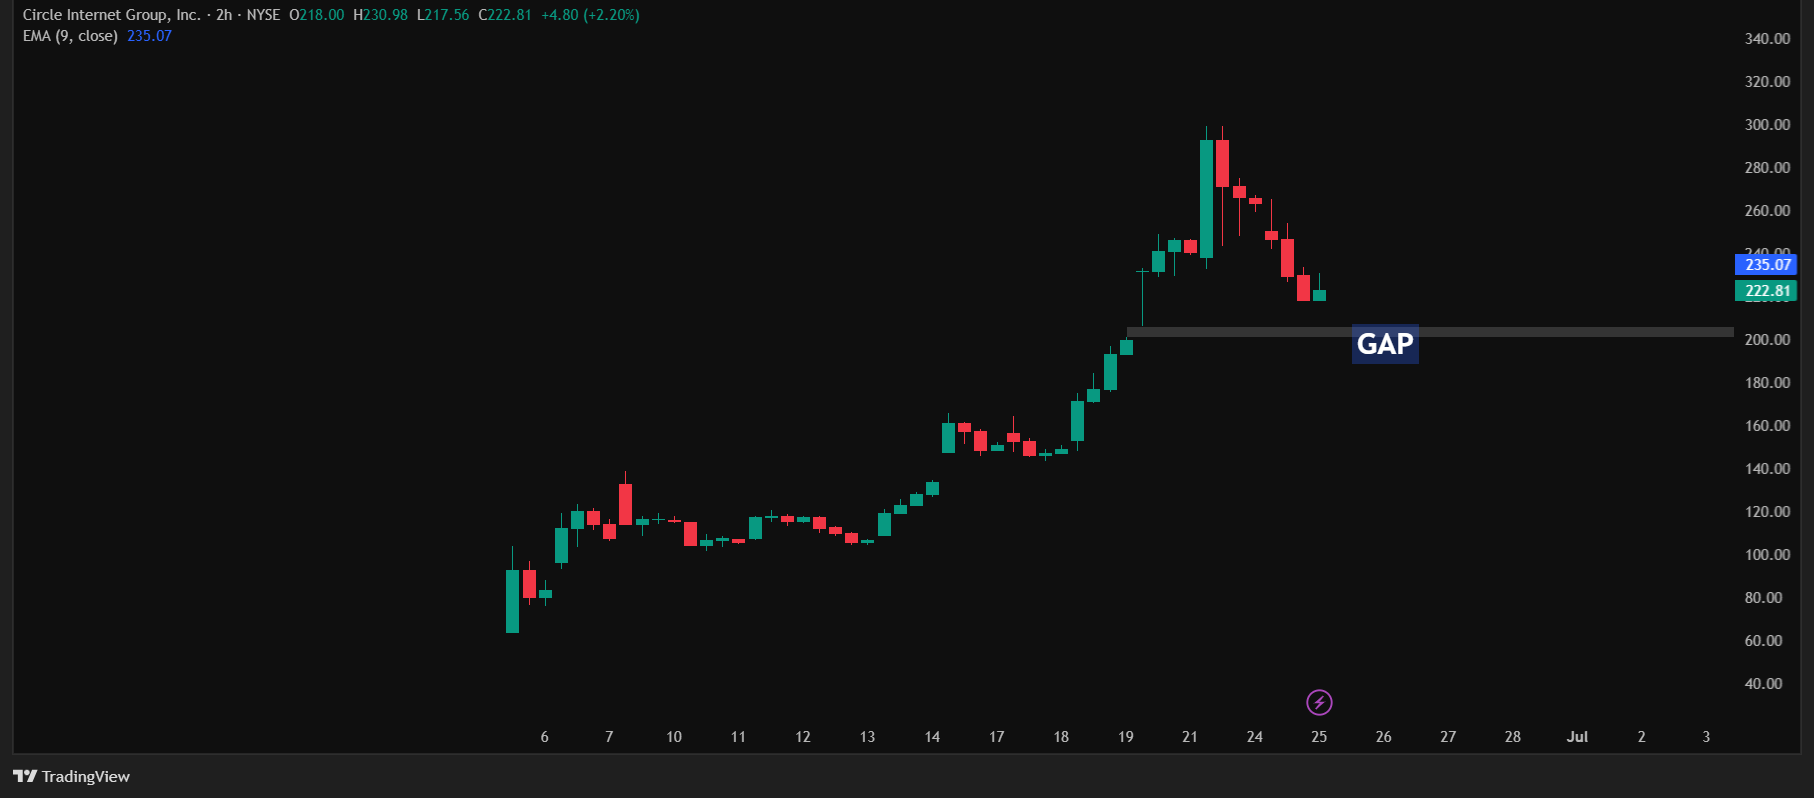
On the daily chart, the 9EMA support sits at $186.55, near a broader support range of $185-205, based on simple price action analysis. Meanwhile, the $243-250 zone has flipped into a major resistance, with $233-238 acting as a minor hurdle below it.

The Relative Strength Index (RSI) stands at 40.77 – not yet in oversold territory (below 30) – suggesting room for further downside. Analysts see CRCL potentially filling a gap below $206 and testing the $200 level.

Chart showing a gap in the candlestick chart of CRCL – Chart by TradingView

For now, the stock appears poised to trade range-bound between $200 and $250, reflecting a cooling-off period after its meteoric 750% rise from an IPO price of $31. That overstretched rally, paired with a high P/E ratio compared to industry peers, had long hinted at an overdue correction.

Key Technical Levels:

  • Support: $185-205 (daily 9EMA at $186.55), $200 zone
  • Resistance: $233-238 (minor), $243-250 (major)
  • RSI: 40.77 (neutral, not oversold)

CRCL Financials: A Silver Lining Amid the Crash?

Despite the stock’s recent decline, Circle’s fundamentals remain strong. For the fiscal year, the company reported a net income of $155.67 million and revenue of $1.68 billion, with 110.07 million shares outstanding (Source: TradingView).

As a leader in the stablecoin space, Circle’s business model is closely tied to the growing adoption of digital assets – a trend that could support its long-term outlook. However, the recent market cap contraction and technical headwinds continue to overshadow these strengths in the short term.

Also Read – CRCL’s USDC & FI’s FIUSD – The Stablecoin Business Model Everyone Should Understand

What’s Next for CRCL?

CRCL’s $5 billion market cap wipeout is a stark reminder of the volatility that follows high-flying stocks. Cathie Wood’s pivot to Robinhood and Coinbase has fueled the sell-off, while technical indicators point to a possible drop to $200. Profit-taking after a 750% post-IPO run was inevitable, but the depth of this correction – coupled with a lofty P/E ratio – raises questions about near-term stability. Still, Circle’s strong financials and its foothold in the stablecoin market suggest resilience over the long haul.

Also Read – 6 Must-Know Things About DeFi in 2025

Will it get worse? The $200 level looms as a critical test. If it holds, CRCL could stabilize within the $200-250 range. A break below, however, might signal deeper trouble. Investors should keep a close eye on volume, RSI, and any fresh catalysts to gauge the stock’s next chapter. For now, caution is the name of the game.

This article is for informational purposes only and should not be considered financial advice. Investing in stocks, cryptocurrencies, or other assets involves risks, including the potential loss of principal. Always conduct your own research or consult a qualified financial advisor before making investment decisions. The author and publisher are not responsible for any financial losses incurred from actions based on this article. While efforts have been made to ensure accuracy, economic data and market conditions can change rapidly. The author and publisher do not guarantee the completeness or accuracy of the information and are not liable for any errors or omissions. Always verify data with primary sources before making decisions.