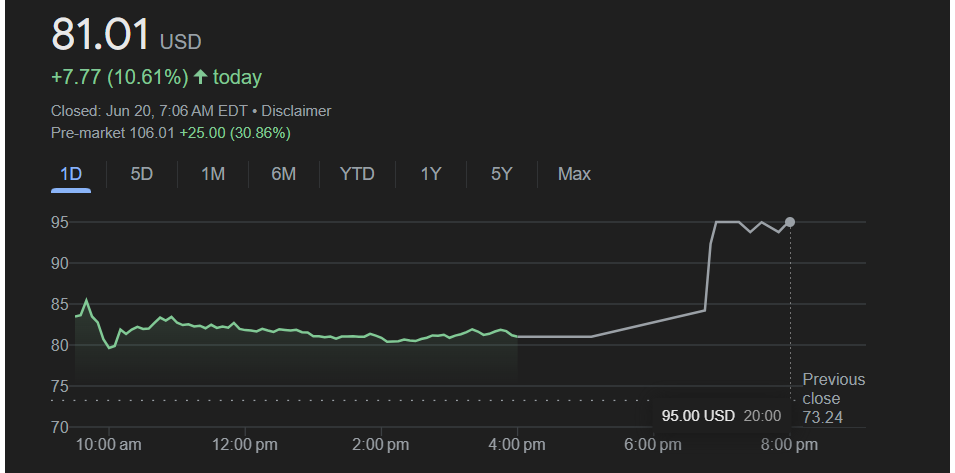
On June 20, 2025, GMS Inc. (NYSE: GMS) stock surged 27% in pre-market trading, reaching $106 per share, surpassing its all-time high of $105.54.

The catalyst for this sharp rise was news of acquisition offers from two major players: QXO Inc., led by billionaire Brad Jacobs, and home improvement giant Home Depot, as reported by The Wall Street Journal on June 19, 2025.
Performance Breakdown
GMS has shown remarkable price movement across various timeframes, driven by recent acquisition speculation and solid earnings.
| Time Period | GMS Return (%) |
|---|---|
| 5 Days | 4.84% |
| 1 Month | 7.87% |
| 6 Months | -4.40% |
| Year-to-Date | -5.46% |
| 1 Year | -8.73% |
| 5 Years | 264.75% |
| All-Time (Since IPO, May 2016) | ~260.4% |
Key Financial Metrics
GMS, a leading distributor of wallboard and suspended ceilings systems, has a market capitalization of $3.083 billion as of June 20, 2025. Its trailing twelve-month (TTM) earnings per share (EPS) is $2.92, with a price-to-earnings (PE) ratio of 27.74. Forward EPS for fiscal 2026 is estimated at $3.15, per analyst projections from Yahoo Finance, yielding a forward PE ratio of approximately 23.24.
The company has 39.8 million shares outstanding. The next earnings date is scheduled for August 2025.
Also Read – Tesla Stock Generates 381% Return Over 5 Years – Technical Analysis Signals Range-Bound Trading on June 20
Technical Analysis

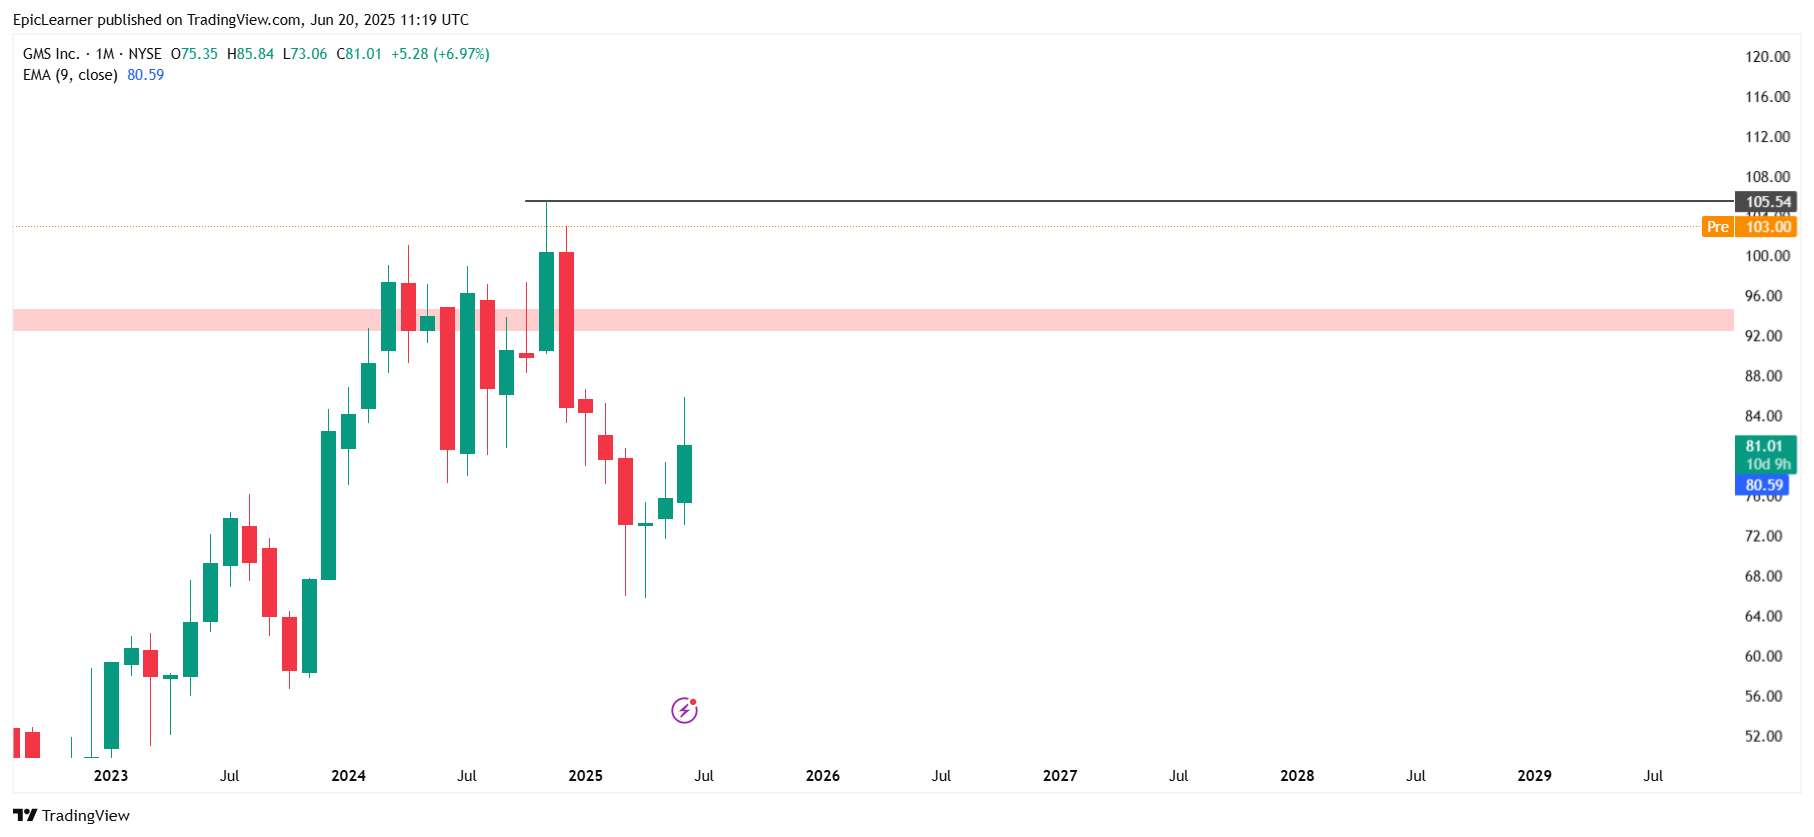
The stock’s pre-market surge to $106 marks a breakout above its all-time high of $105.54, with the price trading above its 9-day exponential moving average (EMA) on daily, weekly, and monthly charts, signaling strong bullish momentum.
The 50-day moving average, a key indicator for short-term trends, is around $80, and the 200-day moving average is near $75, both well below the current price.
If the stock pulls back, support is likely in the $92–$94 range. However, the rapid 27% pre-market jump suggests potential for further upside, though overbought conditions could trigger a near-term pullback. The stock’s high volume and breakout above resistance levels indicate strong buyer interest, but traders should watch for confirmation above $105 to sustain the rally.
Catalysts and Immediate Triggers
The primary driver of GMS’s price surge is the dual acquisition offers. On June 18, 2025, QXO Inc., a building-products distributor led by Brad Jacobs, proposed to acquire GMS for $5 billion, or $95.20 per share in cash, a 27% premium over the 60-day volume-weighted average price of $74.82, as reported by Hartford Business Journal.
Jacobs threatened a hostile takeover if GMS’s management rejects the offer, marking his second such move in the sector this year. Additionally, The Wall Street Journal reported on June 19, 2025, that Home Depot made a competing offer, though details remain undisclosed. GMS confirmed it received QXO’s unsolicited proposal and is reviewing it, per a Yahoo Finance report on June 20, 2025.
The company also reported strong Q4 fiscal 2025 earnings on June 18, 2025, with adjusted EPS of $1.29 beating estimates of $1.11 and revenue of $1.33 billion surpassing forecasts of $1.30 billion, further fueling positive sentiment.
Forward-Looking View and Investment Case
The short-term outlook for GMS is bullish, driven by acquisition speculation and strong Q4 results. Analysts’ “Hold” rating reflects caution due to the stock’s rapid rise and potential overvaluation at $106 compared to the $80 median target.
Upside risks include a bidding war between QXO and Home Depot, which could push the stock higher. However, downside risks include earnings volatility, economic uncertainty, and declining commercial construction demand, as highlighted in GMS’s recent 10-K filing. Geopolitical risks and labor shortages also pose challenges.
This article is for informational purposes only and should not be considered financial advice. Investing in stocks, cryptocurrencies, or other assets involves risks, including the potential loss of principal. Always conduct your own research or consult a qualified financial advisor before making investment decisions. The author and publisher are not responsible for any financial losses incurred from actions based on this article. While efforts have been made to ensure accuracy, economic data and market conditions can change rapidly. The author and publisher do not guarantee the completeness or accuracy of the information and are not liable for any errors or omissions. Always verify data with primary sources before making decisions.
Dawson Blake is a financial markets expert with over 10 years of experience, focusing mainly on stock market news and price movements. He aims to become a top-tier authority in curating stock news content that readers can trust as their go-to source for market information. Dawson enjoys breaking down market activity, company updates, and daily trends to help investors stay informed and make smarter financial decisions. His writing is simple, clear, and designed to make the stock market easy to follow for everyone.

