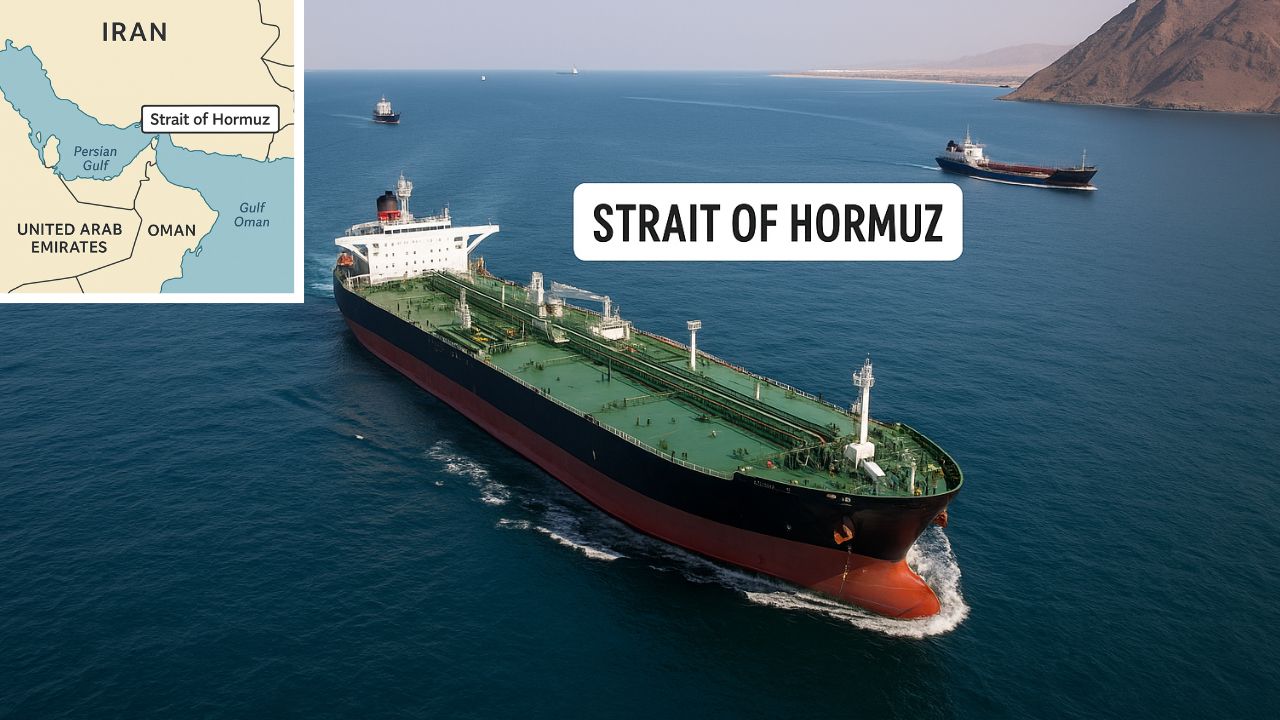
New York || 03:57 AM ET – Crude oil markets are on edge as rising tensions in the Middle East spark fears of a potential closure of the Strait of Hormuz, a vital maritime corridor for about 20 million barrels of oil per day – equivalent to 20% of global petroleum supply. Even partial disruption could send oil prices soaring, with wide-reaching implications for inflation, global trade, and stock markets.
This article explores crude oil price projections based on technical analysis, evaluates the potential economic fallout, and identifies key sectors that may be affected.
Why the Strait of Hormuz Is Crucial
The Strait of Hormuz, situated between Iran and Oman, is the world’s most important oil chokepoint. In 2024, it handled 20 million barrels per day (b/d) – 25% of seaborne oil trade. Major oil-exporting nations like Saudi Arabia, the UAE, Iraq, and Kuwait depend on this route to supply global markets, particularly in Asia.

Iran’s threats to block the Strait – escalated following recent U.S. and Israeli strikes on Iranian nuclear sites-have renewed global energy security concerns. While analysts estimate only a 7% probability of full closure, even limited disruptions such as tanker attacks or naval blockades could significantly affect crude oil flows.
Crude Oil Price Outlook – Technical Analysis for June 2025
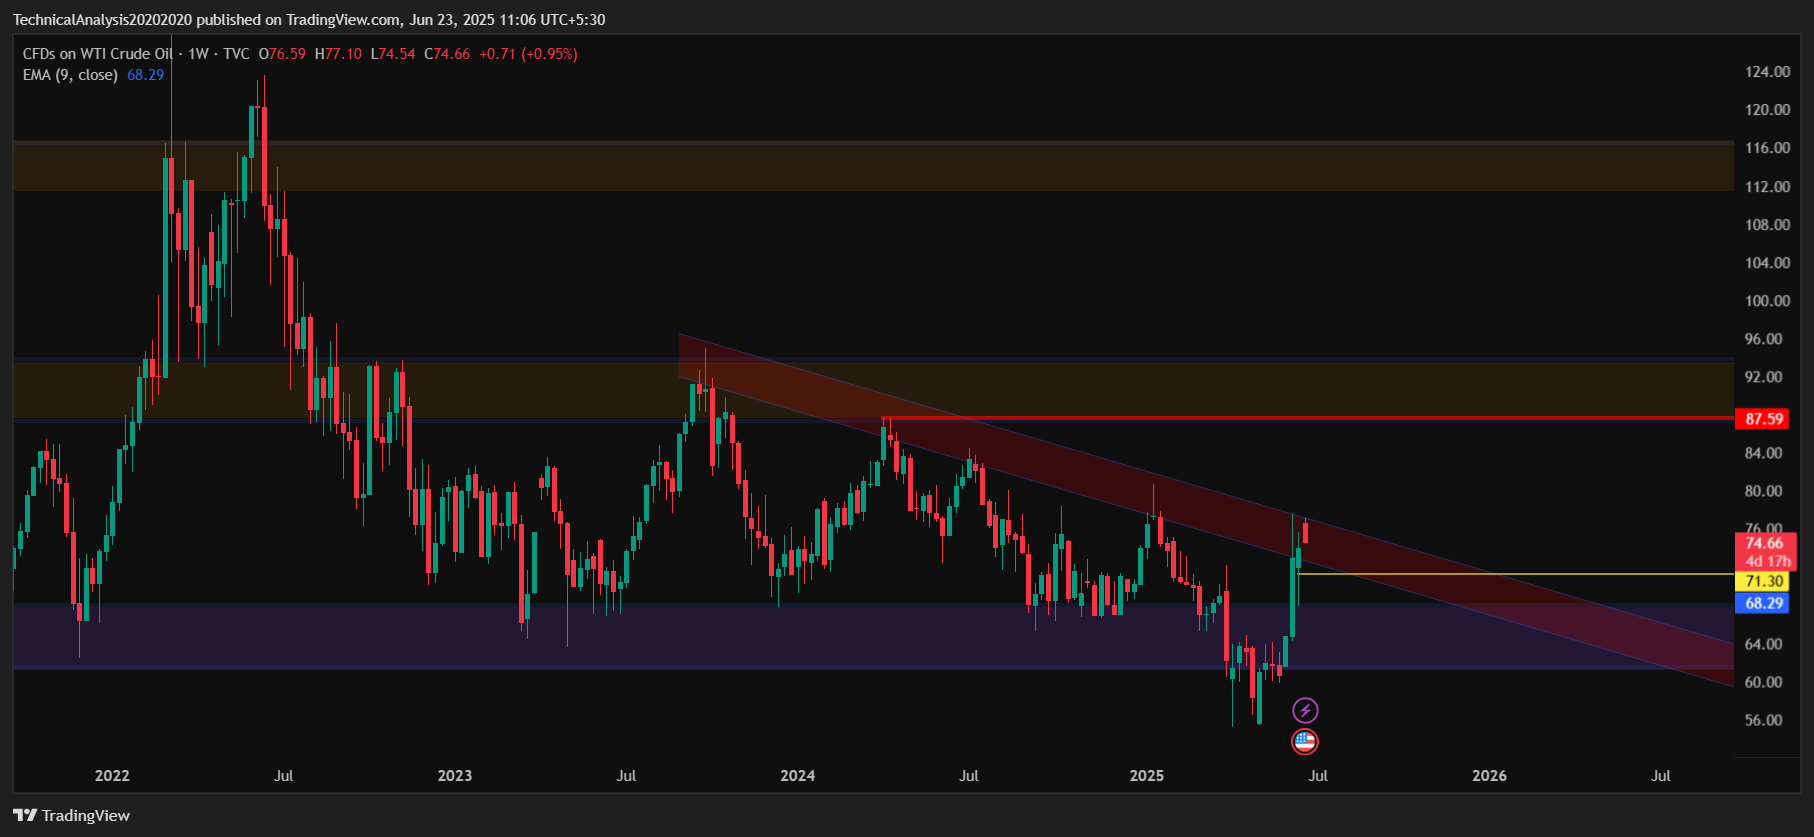
The WTI crude oil chart offers critical insights into potential future price movements amid rising geopolitical tensions. Traders and analysts are closely watching key support and resistance levels to gauge whether the rally can be sustained or a reversal may be imminent.
If the price sustains above $78 or strong buying interest emerges, the next significant resistance is at $88.
If WTI crude breaches $93, there is a high probability the price may reach $109–$111.
$67–$68 is a significant support zone (see the provided chart for reference).

Price Scenarios – What Could Happen?
| Scenario | Price Range | Assumptions |
|---|---|---|
| Base Case | $85–$88 | Limited escalation; no significant supply interruption |
| Bullish Case | $100–$120 | Blockade or severe disruption removes 5–7 million b/d |
| Bearish Case | $65–$68 | Diplomatic resolution; U.S. shale production ramps up |
Also Read – Top 7 Stocks That May Benefit from a Strait of Hormuz Closure
Economic Fallout: What Could a Blockade Trigger?
1. Rising Energy Costs
- Gasoline Prices: Already at $4.38/gal; could spike to $5.00–$5.50
- Heating Oil: Northeast U.S. homes may pay $125–$240 more per winter
- Shipping: Freight rates up 60% due to route changes around Cape of Good Hope
2. Inflation and Fed Policy
- Higher oil prices could delay Fed rate cuts, impacting U.S. monetary policy.
- Treasury yields may rise, pressuring growth and tech stocks.
- China’s 2025 GDP forecast may fall below 4.5% amid trade-related slowdowns.
3. Market Impact by Sector
| Sector | Likely Impact |
|---|---|
| Energy | Oil producers and energy ETFs (XLE, USO) could rally |
| Transport | Airlines and shipping stocks face pressure |
| Equities | Broader indices (S&P 500, NASDAQ) vulnerable to pullbacks |
| Safe Havens | Capital could flow into gold and Japanese yen |
4. Disruptions in Global Trade
- Asia (India, China): 84% of oil via Hormuz goes to Asia; India imports 51% of its crude from Gulf nations.
- LNG Impact: 20% of global LNG flows through the Strait, critical for power and fertilizer sectors.
Historical Comparisons – What Past Crises Tell Us?
| Event | Outcome |
|---|---|
| Gulf War (1990) | Oil jumped 70% in 3 months after Iraq’s invasion of Kuwait |
| Tanker Wars (1980s) | Iran-Iraq attacks on tankers led to U.S. naval intervention |
| 2019 Hormuz Crisis | Seizures of tankers added a $10–$15 premium to crude prices |
Final Thoughts
A Strait of Hormuz blockade, though unlikely in the long term, remains a high-impact risk event. Technical indicators suggest WTI could break past $80, with $100–$130 possible if conflict escalates. The economic fallout would ripple across sectors – from gas pumps to tech portfolios.
This article is for informational purposes only and should not be considered financial advice. Investing in stocks, commodities, or other assets involves risks, including the potential loss of principal. Always conduct your own research or consult a qualified financial advisor before making investment decisions. The author and publisher are not responsible for any financial losses incurred from actions based on this article. While efforts have been made to ensure accuracy, economic data and market conditions can change rapidly. The author and publisher do not guarantee the completeness or accuracy of the information and are not liable for any errors or omissions. Always verify data with primary sources before making decisions.
Dawson Blake is a financial markets expert with over 10 years of experience, focusing mainly on stock market news and price movements. He aims to become a top-tier authority in curating stock news content that readers can trust as their go-to source for market information. Dawson enjoys breaking down market activity, company updates, and daily trends to help investors stay informed and make smarter financial decisions. His writing is simple, clear, and designed to make the stock market easy to follow for everyone.

